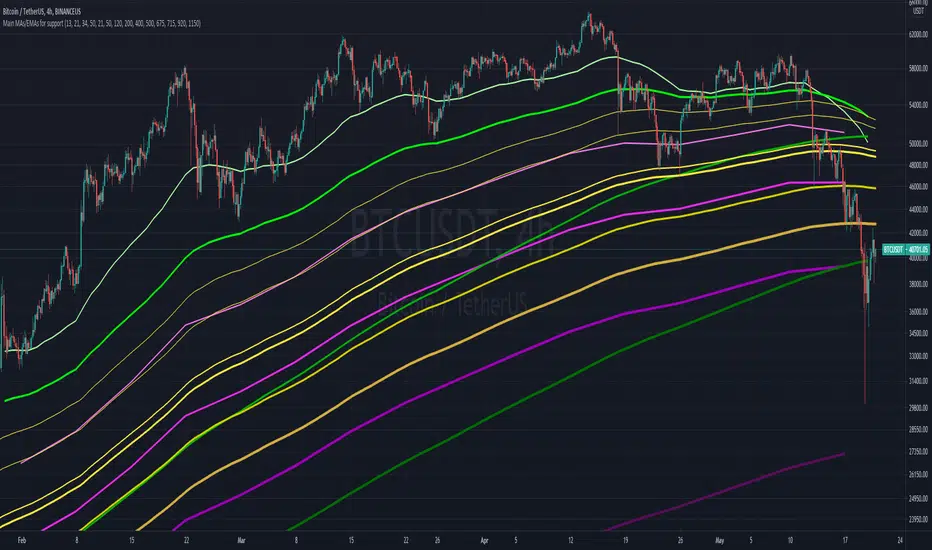
Main MAs and EMAs multi-timeframe for supportObjective is to map out different multi-timeframe support/resistance , all at once. Includes weekly, daily and 4H EMAs and MAs, as per the follow (allowing customization)
WEEKLY (in pink/purple variations):
- 13 EMA
- 21 EMA
- 34 EMA
- 50 M.A
DAILY (in green variations):
- 21 EMA
- 50 EMA
- 120 M.A.
- 200 M.A.
4H (in yellow/golden colors):
- 400 EMA
- 500 EMA
- 675 EMA
- 715 EMA
- 920 EMA
- 1150 EMA
Notes:
- Quite useful to all types of assets; crypto, commodities , stocks, etc...
- Ideally not to be visible all the time, as it can "pollute" the charts. But very helpful in moments of great volatility
Wyszukaj w skryptach "细算江西救护车家长倒赚了四万三+-医疗花费13万(家长视频)++医保报"
Custom Multi-Timeframe Screener with AlertsThis is a multi-timeframe screener with alerts. Use this way you can create a screener on indicators using 2 or more timeframes.
In TradingView there is a limit of 40 security function calls. Every timeframe requires another security call so you can screen fewer symbols with any additional timeframe.
In this example, I use 2 timeframes, so the maximum amount of symbols you can scan is 40/2 = 20.
For 3 timeframes - 13, 4tfs - 10, 5tfs - 8 symbols and so on.
In this simplistic example, I require a cross of EMAs on the current timeframe and confirmation that one EMA above/below another from the second timeframe.
Of course, you can create much more complicated functions for this screener.
Params
- higher timeframe
- ema params
- 20 symbol inputs for instruments you want to use in this screener
Alerts
You can create an alert from it easily by selecting the screener name from the list and then selecting "Any alert() function call".
No additional configuration is required, message and alert on close is generated in the code.
You should better change the default name for your alert. Sometimes because of big amount of inputs you might receive an error.
Disclaimer
Please remember that past performance may not be indicative of future results.
Due to various factors, including changing market conditions, the strategy may no longer perform as good as in historical backtesting.
This post and the script don’t provide any financial advice.

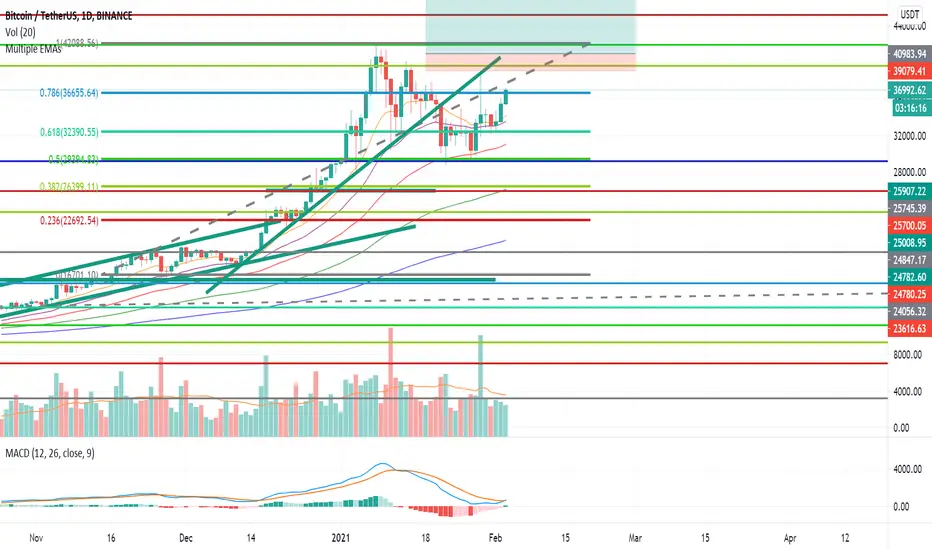
Bear & Bull Zone Signal StrategySince I love to mix and match, here is something fresh and that actually works on the breakout of Ethereum without losing your ass on lagging indicators.
It blends some of the nice parts of my previous scripts while moving to big boy pants with a twist on the Fibonacci retracement using SMA and EMA at multiple levels to do a sanity check.
Is it too good to be true? Nope, just what happens when a Solution Architect starts messing around with crypto and applies engineering and mathematics to the mix. You get a strategy that really doesn't have high profit losses when you tweak it just the right way.
What's the right tweak you ask?
1. Start with a 30 minute timeframe and set your window start date to the date the market began the bear or bull run
2. Make sure you can see your strategy performance window (not the graph one)
3. Set Stop Loss and Target Profit to 50%
4. Use your mouse wheel or up and down arrows and mess around with the RSI, go down one at a time but no lower than 7. Whichever value displayed the highest long or short gain is the one to pick.
5. Now select long or short only based on whichever one shows the highest gain.
6. Now go to K and D, leave K as 3 and check what happens when D is 4 or 5. Leave D at the value that gives you the highest gain.
7. Now go to EMA Fast and Slow Lengths. Leave Fast at 5 and check what happens when the Slow is moved up to 11 or 12, do the gains go up. If not, check what happens when Slow is moved down to 9, 8, or 7. Whichever gives you the highest gain, leave it there. Now go mess with the fast length, keep in mind that fast must always be less than slow. So check values down to 3 and up to 6. Same concept, mo money...leave it be.
8. Now go mess with the Target Profit, I start at 5, hit enter, then go to 7, hit enter, then 9...up by 2 until I get to 21 to make sure I don't hastily pick a low one and always keep in mind between which values the gain switched from high to low. For example, in this example I published at 11 it was $5k and at 13 it was $3700 for the gains. So after I got up to 21 I went back to 11 and started going up by 0.01 steps until the value dropped, which was at 11.19 so I set it at 11.18.
9. Now stop loss is trickier, you've maximized the gains, which means if you set the stop loss at a low value you will sacrifice gains. Typically by this point your loss is less than 10% with this script. So, my approach is to find the value where the stop loss doesn't change what I've tweaked already. In this example, I did the same start at 5 and go up by 2 and saw that when I went to 17 it stopped changing. So I started going back down by 0.5 and saw at 15.5 the gains went lower again. Now I started going back up in steps of 0.01 and at 15.98 it went back to the high gain I already tweaked for. I kept stop loss there and unleashed the strategy on ETH.
So far so good, no bad trades and it's been behaving pretty well.

MA Strategy Emperor insiliconotThe Script offers 9 different EMAs with 14 different MA types.
The make use of the script is to find the entry on the 1-4 hour altcoins while using the in-built 13/21 crossover strategy to be used in sync with Heikin Ashi cross-over with Fib levels of 0.236 Fib level.
How to use it.
Entry is to be made when the
1. Cross over gives a P(Positive Sign) and the candle completely closes above the cross-over
2. When the Heikin Ashi turns green and the next green HA candle goes above the previous green HA candle.
3. The price should be at-least above the 0.236 Level from the Swing high.
All the Best.
EmperorBTC

Reverse Stochastic Momentum Index On ChartIntroducing the Reverse Stochastic Momentum Index "On Chart" version
According to Investopedia :
“The Stochastic Momentum Index (SMI) is a more refined version of the stochastic oscillator, employing a wider range of values and having a higher sensitivity to closing prices.”
The SMI is considered a refinement of the stochastic oscillator developed by William Blau and introduced in 1993 in an attempt to provide a more reliable indicator, less subject to false swings.
It calculates the distance of the current closing price as it relates to the median of the high/low range of price.
The SMI has a normal range of values between +100 and -100.
When the present closing price is higher than the median, or midpoint value of the high/low range, the resulting value is positive.
When the current closing price is lower than that of the midpoint of the high/low range, the SMI has a negative value.
Here I have reverse engineered the SMI formula to derive 2 functions.
One function calculates the chart price at which the SMI will reach a particular SMI scale value.
The second function calculates the chart price at which the SMI will crossover its signal line.
I have employed those functions here to give the "crossover" price levels for :
Upper alert level ( default 40, color : aqua blue )
Mid-Line ( default value 0, color : white )
Lower alert level ( default -40, color : purple )
Signal line ( default 13, colors : bright red & lime green )
And also to give the SMI eq price ( colors : red & green )
The midline, upper and lower alert levels return the closing price which would make SMI equal to their respective values
The user can infer from this that.....
Closing above these prices will cause the Stochastic Momentum Index to cross above the associated levels
Closing below these prices will cause the Stochastic Momentum Index to cross below the associated levels
Signal line returns the closing price where Stochastic Momentum Index is equal to its signal line
The user can infer from this that.....
Closing above this price will cause the Stochastic Momentum Index to cross above the signal line
Closing below this price will cause the Stochastic Momentum Index to cross below the signal line
SMI eq price returns the closing price which would make the SMI equal to its previous value
The user can infer from this that.....
Closing above this price will cause the Stochastic Momentum Index to increase
Closing below this price will cause the Stochastic Momentum Index to decrease
Note : all returned prices have a returned value filter to replace any values below zero with zero to help prevent auto focus issues.
These levels are displayed as plotted lines on the chart and also as an optional infobox with choice of displayed info.
This allows the user to see directly on the chart the interplay between the various crossover levels and price action and to precisely plan entries, exits and stops for their SMI based trades.
Traditionally traders and analysts will consider:
Positives values above 40 indicate a bullish trend
Negative values below -40 indicate a bearish trend .
Common traditional ways to derive signals from the SMI :
When the SMI crosses below -40 and then moves back above it, a buy signal is generated.
When the SMI crosses above +40 and then moves back below it, a sell signal is generated.
When the SMI line crosses above the signal line. A signal to buy is generated
When the SMI line crosses below the signal line signal to sell is generated.
When the SMI crosses above the zeroline, signal line and the SMI eq level many interpret that as a full bullish bias signal and take trades only in that direction, vice versa for bearish bias.
Traders also look for divergences between the SMI and price action.
The SMI is often used in conjunction with the Chande Momentum Oscillator or R squared indicator to determine overall market trendiness where the SMI is used to determine the direction of the trend, and also with volume indicators to show if the momentum carries significant selling or buying pressure.

72s Strat: Backtesting Adaptive HMA+ pt.1This is a follow up to my previous publication of Adaptive HMA+ few months ago, as a mean to provide some kind of initial backtesting tools. Which can be use to explore many possible strategies, optimise its settings to better conform user's pair/tf, and hopefully able to help tweaking your general strategy.
If you haven't read the study or use the indicator, kindly go here first to get the overall idea.
The first strategy introduce in this backtest is one most basic already described in the study; buy/sell is when movement is there and everything is on the right side; When RSI has turned to other side, we can use it as exit point (if in profit of course, else just let it hit our TP/SL, why would we exit before profit). Also, base on RSI when we make entry, we can further differentiate type of signals. --Please check all comments in code directly where the signals , entries , and exits section are.
Second additional strategy to check; is when we also use second faster Adaptive HMA+ for exit. So this is like a double orders on a signal but with different exit-rule (/more on this on snapshots below). Alternatively, you can also work the code so to only use this type of exit.
There's also an additional feature which you can enable its visuals, the Distance Zone , is to help measuring price distance to our xHMA+. It's just a simple atr based envelope really, I already put the sample code in study's comment section, but better gonna update it there directly for non-coder too, after this.
In this sample I use Lot for order quantity size just because that's what I use on my broker. Also what few friends use while we forward-testing it since the study is published, so we also checked/compared each profit/loss report by real number. To use default or other unit of measurement, change the entry code accordingly.
If you change your order size, you should also change the commission in Properties Tab. My broker commission is 5 USD per order/lot, so in there with example order size 0.1 lot I put commission 0.5$ per order (I'll put 2.5$ for 0.5 lot, 10$ for 2 lot, and so on). Crypto usually has higher charge. --It is important that you should fill it base on your broker.
SETTINGS
I'm trying to keep it short. Please explore it further again. (Beginner should also first get acquaintance with terms use here.)
ORDERS:
Base Minimum Profit Before Exit:
The number is multiplier of ongoing ATR. Means that when basic exit condition is met, algo will check whether you're already in minimum profit or not, if not, let it still run to TP or SL, or until it meets subsequent exit condition, then it will check again.
Default Target Profit:
Multiplier of ATR at signal. If reached before any eligible exit condition is met, exit TP.
Base StopLoss Point:
You can change directly in code to use other like ATR Trailing SL, fix percent SL, or whatever. In the sample, 4 options provided.
Maximum StopLoss:
This is like a safety-net, that if at some point your chosen SL point from input above happens to be exceeding this maximum input that you can tolerate, then this max point is the one will be use as SL.
Activate 2nd order...:
The additional doubling of certain buy/sell with different exits as described above. If enable, you should also set pyramiding to at least: 2. If not, it does nothing.
ADAPTIVE HMA+ PERIOD
Many users already have their own settings for these. So in here I only sample the default as first presented in the study. Make it to your adaptive.
MARKET MOVEMENT
(1) Now you can check in realtime how much slope degree is best to define your specific pair/tf is out of congestion (yellow) area. And (2) also able to check directly what ATR lengths are more suitable defining your pair's volatility.
DISTANCE ZONE
Distance Multiplier. Each pair/tf has its own best distance zone (in xHMA+ perspective). The zone also determine whether a signal should appear or not. (Or what type of signal, if you wanna go more detail in constructing your strategy)
USAGE
(Provided you already have your own comfortable settings for minimum-maximum period of Adaptive HMA+. Best if you already have backtested it manually too and/or apply as an add-on to your working strategy)
1. In our experiences, first most important to define is both elements in the Market Movement Settings . These also tend to be persistent for whole season since it's kinda describing that pair/tf overall behaviour. Don't worry if you still get a low Profit Factor here, but by tweaking you should start to see positive changes in one of Max Drawdown and Net Profit, or Percent Profitable.
2. Afterwards, find your pair/tf Distance Zone . When optimising this, what we seek is just a "not to bad" equity curves to start forming. At least Max Drawdown should lessen more. Doesn't have to be great already, but should be better, no red in Net Profit.
3. Then go manage the "Trailing Minimum Profit", TP, SL, and max SL.
4. Repeat 1,2,3. 👻
5. Manage order size, commission, and/or enable double-order (need pyramiding) if you like. Check if your equity can handle max drawdown before margin call.
6. After getting an acceptable backtest result, go to List of Trades tab and find the biggest loss or when many sequencing loss in a row happened. Click on it to go to exact point on chart, observe why the signal failed and get at least general idea how it can be prevented . The rest is yours, you should know your pair/tf more than other.
You can also re-explore your minimum-maximum period for both Major and minor xHMA+.
Keep in mind that all numbers in Setting are conceptually in a form of range . You don't want to get superb equity curves but actually a "fragile" , means one can easily turn it to disaster just by changing only a fraction in one/two of the setting.
---
If you just wanna test the strength of the indicator alone, you can disable "Use StopLoss" temporarily while optimising settings.
Using no SL might be tempting in overall result data in some cases, but NOTE: It is not recommended to not using SL, don't forget that we deliberately enter when it's in high volatility. If want to add flexibility or trading for long-term, just maximise your SL. ie.: chose SL Point>ATR only and set it maximum. (Check your max drawdown after this).
I think this is quite important specially for beginners, so here's an example; Hypothetically in below scenario, because of some settings, the buy order after the loss sell signal didn't appear. Let's say if our initial capital only 1000$ using leverage and order size 0,5 lot (risky position sizing already), moreover if this happens at the beginning of your trading season, that's half of account gone already in one trade . Your max SL should've made you exit after that pumping bar.
The Trailing Minimum Profit is actually look like this. Search in the code if you want to plot it. I just don't like too many lines on chart.
To maximise profit we can try enabling double-order. The only added rule coded is: RSI should rising when buy and falling when sell. 2nd signal will appears above or below default buy/sell signal. (Of course it's also prone to double-loss, re-check your max drawdown after. Profit factor play its part in here for a long run). Snapshot in comparison:
Two default sell signals on left closed at RSI exit, the additional sell signal closed later on when price crossover minor xHMA+. On buy side, price haven't met our minimum profit when first crossunder minor xHMA+. If later on we hit SL on this "+buy" signal, at least we already profited from default buy signal. You can also consider/treat this as multiple TP points.
For longer-term trading, what you need to maximise is the Minimum Profit , so it won't exit whenever an exit condition happened, it can happen several times before reaching minimum profit. Hopefully this snapshot can explain:
Notice in comparison default sell and buy signal now close in average after 3 days. What's best is when we also have confirmation from higher TF. It's like targeting higher TF by entering from smaller TF.
As also mention in the study, we can still experiment via original HMA by putting same value for minimum-maximum period setting. This is experimental EU 1H with Major xHMA+: 144-144, Flat market 13, Distance multiplier 3.6, with 2nd order activated.
Kiwi was a bit surprising for me. It's flat market is effectively below 6, with quite far distance zone of 3.5. Probably because I'm using big numbers in adaptive period.
---
The result you see in strategy tester report below for EURUSD 15m is using just default settings you see in code, as follow:
0,1 lot for each order (which is the smallest allowed by my broker).
No pyramiding. Commission: 0.5 usd per order. Slippage: 3
Opening position is only using basic strategy #1 (RSI exit). Additional exit not activated.
Minimum Profit: 1. TP: 3.
SL use: Half-distance zone. Max SL: 4.5.
Major xHMA+: 172-233. minor xHMA+: 89-121
Distance Zone Multiplier: 2.7
RSI: Standard 14.
(From our forward-testing, the difference we get from net profit is because of the spread, our entry isn't exactly at the close/open price. Not so much though, but not the same. If somebody can direct me to any example where we can code our entry via current bid/ask price, that would be awesome!)
It's already a long post (sorry), think I'm gonna pause here. Check out the code :)
---
DISCLAIMER: Past performance is no guarantee of future results , and so on.. you know the drill ;)
Please read whole description first before using, don't take 1-2 paragraph and claim it's the whole logic, you are responsible of your own actions and understanding.

4X EMA and volume strategyThis is a strategy made from multiple types of EMA and volume(EOM).
This is a long only strategy.
EMA 1 = 13
EMA 2 = 21
EMA 3 = 50
EMA 4 = 180
In this case we have 2 options for entry:
1.We check that are candles are in ascending order and EOM is above 0 - > long, descending and eom<0 -> exit long
2.We check if we have a crossover between the first ema with the second and the third. Cross up -> long, crossdown -> exit long
If you have any questions let me know!

(Custom)Bollingers Bands Fibonacci ratiosThis is a modified Bollinger bands that uses EMA,with ATH to get a main average and then takes Standard Deviations by Fib ratios outwards. It is very useful for Entries and exits. I Typically use it to exit longs or shorts, entries are a bit harder. Generally the price will wick just barely or briefly into the end of one of the bands and then leave, it PINGs it and that is your exit. It is a little hard to predict in real time and set a Take profit at any exact point because it is always moving, but because it constantly adjust it is pretty damn accurate at nailing it. They sorta work at any timeframe, so its up to you, though for Crypto it doesnt do so well above 4hr because it can pump really hard or dump hard and super stretch the bands. Best numbers for the Average are Fib numbers. Stick to using 13, 21, and 34. 34 is my favorite and works best for me, But its up to you. Sometimes its benificial to use 34 on lower timeframes and maybe a smaller number on larger ones IE 21 or 2 or 4hr charts.
Once again it is up to you how to use it. I dont have credit for the original version of it. It is someone else's who I think modified another person's version lol. Ill try and find their name and post a comment though for who I took the original code from.

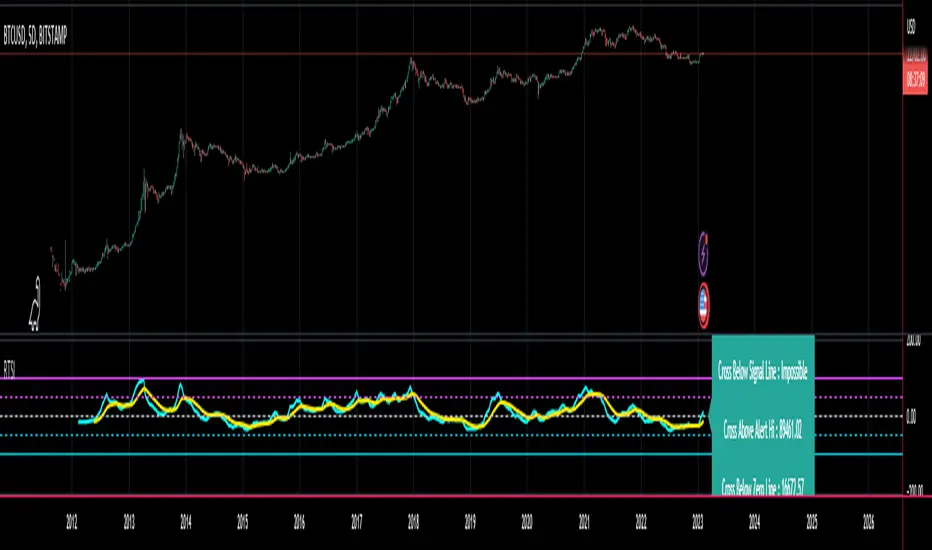
CT Reverse True Strength Indicator On ChartIntroducing the Caretakers “On Chart” Reverse True Strength Index.
According to Wikipedia….
“The True Strength Index (TSI) is a technical indicator used in the analysis of financial markets that attempts to show both trend direction and overbought/oversold conditions. It was first published William Blau in 1991.
The indicator uses moving averages of the underlying momentum of a financial instrument.
Momentum is considered a leading indicator of price movements, and a moving average characteristically lags behind price.
The TSI combines these characteristics to create an indication of price and direction more in sync with market turns than either momentum or moving average.”
The TSI has a normal range of values between +100 and -100.
Traditionally traders and analysts will consider:
Positives values above 25 to indicate an “overbought” condition
Negative values below -25 to indicate an “oversold” condition
I have reverse engineered the True Strength Index formula to derive 2 new functions.
1) The reverse TSI function is dual purpose which can be used to calculate….
The chart price at which the TSI will reach a particular TSI scale value.
The chart price at which the TSI will equal its previous value.
2) The reverse TSI signal cross function can be used to calculate the chart price at which the TSI will cross its signal line.
I have employed these functions here to return the price levels where the True Strength Index would equal :
Upper alert level ( default 25 )
Zero-Line
Lower alert level ( default -25 )
Previous TSI (eq) value
TSI signal line
In this “On Chart” version of the reverse True Strength Index the crossover levels are displayed both as lines on the chart and via an optional info-box with choice of user selected info.
Chart Line Colors
Upper alert level... ( Fuchsia )
Zero-Line............ ( White )
Lower alert level... ( Aqua )
TSI (eq)...............( TSI (eq) > close..Orange, TSI (eq) < close..Lime )
TSI signal line........( Signal Cross Line > Close..Aqua, Signal Cross Line < Close..Fuchsia )
How to interpret the displayed prices returned from the TSI scale zero line and upper and lower alert levels.
Closing exactly at the given price will cause the True Strength Index value to equal the scale value.
Closing above the given price will cause the True Strength Index to cross above the scale value.
Closing below the given price will cause the True Strength Index to cross below the scale value.
How to interpret the displayed price returned from the TSI (eq)
Closing exactly at the price will cause the True Strength Index value to equal the previous TSI value.
Closing above the price will cause the True Strength Index value to increase.
Closing below the price will cause the True Strength Index value to decrease.
How to interpret the displayed price returned from the TSI signal line crossover.
Closing exactly at the given price will cause the True Strength Index value to equal the signal line.
Closing above the given price will cause the True Strength Index to cross above the signal line.
Closing below the given price will cause the True Strength Index to cross below the signal line.
Common methods to derive signals from the TSI :
Zero-line crossovers
When the CMO crosses above the zero-line, a buy signal is generated.
When the CMO crosses below the zero-line, a sell signal is generated.
“Overbought” and “Oversold” crossovers
When the SMI crosses below -25 and then moves back above it, a buy signal is generated.
When the SMI crosses above +25 and then moves back below it, a sell signal is generated.
What Does the True Strength Index (TSI) Tell You?
The indicator is primarily used to identify overbought and oversold conditions in an asset's price, spot divergence, identify trend direction and changes via the zero-line, and highlight short-term price momentum with signal line crossovers.
Since the TSI is based on price movements, oversold and overbought levels will vary by the asset being traded. Some stocks may reach +30 and -30 before tending to see price reversals, while another stock may reverse near +20 and -20.
Mark extreme TSI levels, on the asset being traded, to see where overbought and oversold is. Being oversold doesn't necessarily mean it is time to buy, and when an asset is overbought it doesn't necessarily mean it is time to sell. Traders will typically watch for other signals to trigger a trade decision. For example, they may wait for the price or TSI to start dropping before selling in overbought territory. Alternatively, they may wait for a signal line crossover.
Signal Line Crossovers
The true strength index has a signal line, which is usually a seven- to 13-period EMA of the TSI line. A signal line crossover occurs when the TSI line crosses the signal line. When the TSI crosses above the signal line from below, that may warrant a long position. When the TSI crosses below the signal line from above, that may warrant selling or short selling.
Signal line crossovers occur frequently, so should be utilized only in conjunction with other signals from the TSI. For example, buy signals may be favoured when the TSI is above the zero-line. Or sell signals may be favoured when the TSI is in overbought territory.
Zero-line Crossovers
The zero-line crossover is another signal the TSI generates. Price momentum is positive when the indicator is above zero and negative when it is below zero. Some traders use the zero-line for a directional bias. For example, a trader may decide only to enter a long position if the indicator is above its zero-line. Conversely, the trader would be bearish and only consider short positions if the indicator's value is below zero.
Breakouts and Divergence
Traders can use support and resistance levels created by the true strength index to identify breakouts and price momentum shifts. For instance, if the indicator breaks below a trendline, the price may see continued selling.
Divergence is another tool the TSI provides. If the price of an asset is moving higher, while the TSI is dropping, that is called bearish divergence and could result in a downside price move. If the TSI is rising while the price is falling, that could signal higher prices to come. This is called bullish divergence.
Divergence is a poor timing signal, so it should only be used in conjunction with other signals generated by the TSI or other technical indicators.
The Difference Between the True Strength Index (TSI) and the Moving Average Convergence Divergence (MACD) Indicator.
The TSI is smoothing price changes to create a technical oscillator. The moving average convergence divergence (MACD) indicator is measuring the separation between two moving averages. Both indicators are used in similar ways for trading purposes, yet they are not calculated the same and will provide different signals at different times.
The Limitations of Using the True Strength Index (TSI)
Many of the signals provided by the TSI will be false signals. That means the price action will be different than expected following a trade signal. For example, during an uptrend, the TSI may cross below the zero-line several times, but then the price proceeds higher even though the TSI indicates momentum has shifted down.
Signal line crossovers also occur so frequently that they may not provide a lot of trading benefit. Such signals need to be heavily filtered based on other elements of the indicator or through other forms of analysis. The TSI will also sometimes change direction without price changing direction, resulting in trade signals that look good on the TSI but continue to lose money based on price.
Divergence also tends to unreliable on the indicator. Divergence can last so long that it provides little insight into when a reversal will actually occur. Also, divergence isn't always present when price reversals actually do occur.
The TSI should only be used in conjunction with other forms of analysis, such as price action analysis and other technical indicators.
This is not financial advice, use at your own risk.
Fibonnaci Moving Averages by WaspeRIn this script you will find a preset of 7 moving averages - 8,13,34,55,89,144,233 based on Fibonacci progression.
You can select between - SMA, EMA, WMA, RMA and HMA.
You have input options for period, type and source and you can modify the parameters based to your needs.
I am new to pine coding and this is my first script. Comments and feedback are welcome.

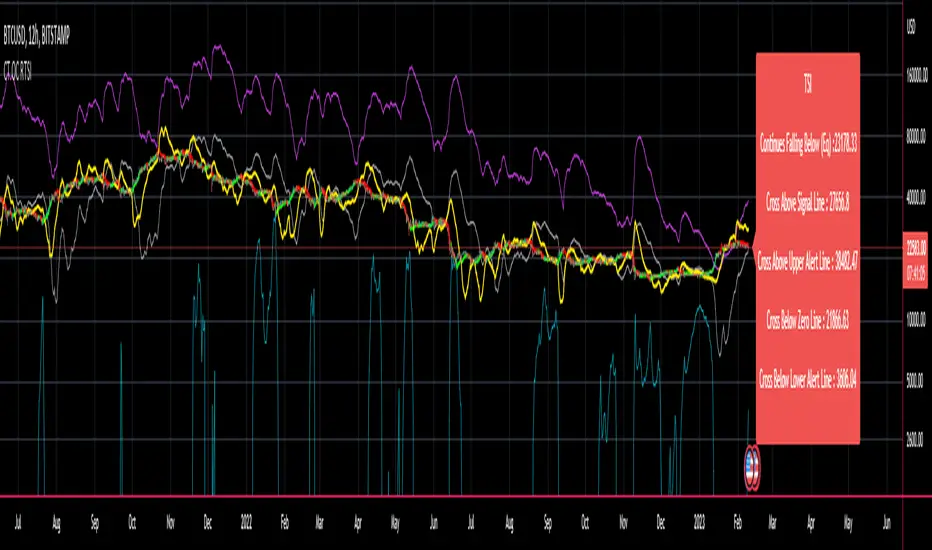
CT Reverse True Strength IndicatorIntroducing the Caretakers Reverse True Strength Index.
According to Wikipedia….
“The True Strength Index (TSI) is a technical indicator used in the analysis of financial markets that attempts to show both trend direction and overbought/oversold conditions. It was first published William Blau in 1991.
The indicator uses moving averages of the underlying momentum of a financial instrument.
Momentum is considered a leading indicator of price movements, and a moving average characteristically lags behind price.
The TSI combines these characteristics to create an indication of price and direction more in sync with market turns than either momentum or moving average.”
The TSI has a normal range of values between +100 and -100.
Traditionally traders and analysts will consider:
Positives values above 25 to indicate an “overbought” condition
Negative values below -25 to indicate an “oversold” condition
I have reverse engineered the True Strength Index formula to derive 2 new functions.
The reverse TSI function is dual purpose which can be used to calculate….
The chart price at which the TSI will reach a particular TSI scale value.
The chart price at which the TSI will equal its previous value.
The reverse TSI signal cross function can be used to calculate the chart price at which the TSI will cross its signal line.
I have employed these functions here to return the price levels where the True Strength Index would equal :
Upper alert level ( default 25 )
Zero-Line
Lower alert level ( default -25 )
Previous TSI (eq) value.
TSI signal line
These crossover levels are displayed via an optional info-box with choice of user selected info.
How to interpret the displayed prices returned from the TSI scale zero line and upper and lower alert levels.
Closing exactly at the given price will cause the True Strength Index value to equal the scale value.
Closing above the given price will cause the True Strength Index to cross above the scale value.
Closing below the given price will cause the True Strength Index to cross below the scale value.
How to interpret the displayed price returned from the TSI (eq)
Closing exactly at the price will cause the True Strength Index value to equal the previous TSI value.
Closing above the price will cause the True Strength Index value to increase.
Closing below the price will cause the True Strength Index value to decrease.
How to interpret the displayed price returned from the TSI signal line crossover.
Closing exactly at the given price will cause the True Strength Index value to equal the signal line.
Closing above the given price will cause the True Strength Index to cross above the signal line.
Closing below the given price will cause the True Strength Index to cross below the signal line.
Common methods to derive signals from the TSI :
Zero-line crossovers
When the CMO crosses above the zero-line, a buy signal is generated.
When the CMO crosses below the zero-line, a sell signal is generated.
“Overbought” and “Oversold” crossover
When the SMI crosses below -25 and then moves back above it, a buy signal is generated.
When the SMI crosses above +25 and then moves back below it, a sell signal is generated.
What Does the True Strength Index (TSI) Tell You?
The indicator is primarily used to identify overbought and oversold conditions in an asset's price, spot divergence, identify trend direction and changes via the zero-line, and highlight short-term price momentum with signal line crossovers.
Since the TSI is based on price movements, oversold and overbought levels will vary by the asset being traded. Some stocks may reach +30 and -30 before tending to see price reversals, while another stock may reverse near +20 and -20.
Mark extreme TSI levels, on the asset being traded, to see where overbought and oversold is. Being oversold doesn't necessarily mean it is time to buy, and when an asset is overbought it doesn't necessarily mean it is time to sell. Traders will typically watch for other signals to trigger a trade decision. For example, they may wait for the price or TSI to start dropping before selling in overbought territory. Alternatively, they may wait for a signal line crossover.
Signal Line Crossovers
The true strength index has a signal line, which is usually a seven- to 13-period EMA of the TSI line. A signal line crossover occurs when the TSI line crosses the signal line. When the TSI crosses above the signal line from below, that may warrant a long position. When the TSI crosses below the signal line from above, that may warrant selling or short selling.
Signal line crossovers occur frequently, so should be utilized only in conjunction with other signals from the TSI. For example, buy signals may be favoured when the TSI is above the zero-line. Or sell signals may be favoured when the TSI is in overbought territory.
Zero-line Crossovers
The zero-line crossover is another signal the TSI generates. Price momentum is positive when the indicator is above zero and negative when it is below zero. Some traders use the zero-line for a directional bias. For example, a trader may decide only to enter a long position if the indicator is above its zero-line. Conversely, the trader would be bearish and only consider short positions if the indicator's value is below zero.
Breakouts and Divergence
Traders can use support and resistance levels created by the true strength index to identify breakouts and price momentum shifts. For instance, if the indicator breaks below a trendline, the price may see continued selling.
Divergence is another tool the TSI provides. If the price of an asset is moving higher, while the TSI is dropping, that is called bearish divergence and could result in a downside price move. If the TSI is rising while the price is falling, that could signal higher prices to come. This is called bullish divergence.
Divergence is a poor timing signal, so it should only be used in conjunction with other signals generated by the TSI or other technical indicators.
The Difference Between the True Strength Index (TSI) and the Moving Average Convergence Divergence (MACD) Indicator.
The TSI is smoothing price changes to create a technical oscillator. The moving average convergence divergence (MACD) indicator is measuring the separation between two moving averages. Both indicators are used in similar ways for trading purposes, yet they are not calculated the same and will provide different signals at different times.
The Limitations of Using the True Strength Index (TSI)
Many of the signals provided by the TSI will be false signals. That means the price action will be different than expected following a trade signal. For example, during an uptrend, the TSI may cross below the zero-line several times, but then the price proceeds higher even though the TSI indicates momentum has shifted down.
Signal line crossovers also occur so frequently that they may not provide a lot of trading benefit. Such signals need to be heavily filtered based on other elements of the indicator or through other forms of analysis. The TSI will also sometimes change direction without price changing direction, resulting in trade signals that look good on the TSI but continue to lose money based on price.
Divergence also tends to unreliable on the indicator. Divergence can last so long that it provides little insight into when a reversal will actually occur. Also, divergence isn't always present when price reversals actually do occur.
The TSI should only be used in conjunction with other forms of analysis, such as price action analysis and other technical indicators.
This is not financial advice, use at your own risk.
Ripster EMA CloudsEMA Cloud By Ripster
EMA Cloud System is a Trading System Invented by Ripster where areas are shaded between two desired EMAs. The concept implies the EMA cloud area serves as support or resistance for Intraday & Swing Trading. This can be utilized effectively on 10 Min for day trading and 1Hr/Daily for Swings. Ripster himself utilizes various combinations of the 5-12, 34-50, 8-9, 20-21 EMA clouds but the possibilities are endless to find what works best for you.
“Ideally, 5-12 or 5-13 EMA cloud acts as a fluid trendline for day trades. 8-9 EMA Clouds can be used as pullback Levels –(optional). Additionally, a high level price over or under 34-50 EMA clouds confirms either bullish or bearish bias on the price action for any timeframe” – Ripster

MA Trend MonitorMA Trend Monitor base on 3 Moving Average to define and display trend status on all time frame.
1. Calculate
* Fast Moving Average apply to High Price and Low Price
* Slow Moving Average apply to Close Price
* Trend defined by rule below:
- Up trend when Moving Average of Low Price moving above Moving Average of Close Price
- Down trend when Moving Average of High Price moving below Moving Average of Close Price
- Sideway when Moving Average of Close Price moving between 2 Moving Average of High and Low Price
2. Interface
* Color:
- Up trend: green
- Down trend: red
- Sideway: gray
* Fast Moving Average
- Default period: 20
- Moving Average Type: EMA/SMA
* Slow Moving Average
- Default period: 70
- Moving Average Type: EMA/SMA
* Line Resolution
- Number of Line: 13 (from 1 minute to 1 Month)
- Resolution of each line adjustable or disable.

Multi Moving Average Crossing (by Coinrule)Moving Averages are among the most common trading indicators. They are straightforward to interpret and effective to use.
One of the limitations of using moving averages is they can provide buy and sell signals with a relatively high lag , making it very difficult to spot the lows and tops of the trend.
Moving averages calculated with a low number of periods like the MA9 (the average of the previous nine price periods) react very fast to price moves providing prompt signals. On the other side, more signals may end up with more false-signals and more trades in a loss.
On the contrary, moving averages calculated with a higher number of periods like the MA100 (which considers the previous one hundred price periods) give more reliable signals, but with a delay.
A system catching the crossing of the MA50 over the MA100 is a good compromise for successful long-term strategies. It provides, on average, reliable buy signals.
The Multi Moving Average Crossing Strategy tries to optimize the exit without waiting for the same opposite crossing (MA50 below MA100). It uses the MA9 crossing below the MA50, instead, to spot a better time for selling.
The setup is as follows.
BUY when the Moving Average 50 crosses above the Moving Average 100
SELL when the Moving Average 9 crosses below the Moving Average 50
The higher is the time frame to calculate the Moving Averages, the better is the overall performance of the strategy. The 4-hour (or 6-hour) time frame seems to be the best, even if it results in fewer trades. If you want to trade more still with good results, the 1-hour time is a good compromise.
Advantages of the strategy
This strategy seeks to catch those that are more likely relevant uptrends and close the trade relatively quickly. More trades mean more opportunities. This is especially effective if you run the strategy on all the available coins on the market, as you could do with Coinrule.
Generally, a Multi Moving Averages approach beats the classic crossing strategy involving only two Moving Averages. We backtested a sample of twenty trading pairs to assess the benefits empirically.
The results show that the Multi Moving Average Strategy
outperforms 13 out of 20 times
has 95% higher average return
has 67% higher median return
The strategy assumes each order to trade 30% of the available capital and opens a trade at a time. A trading fee of 0.1% is taken into account.

Torben Median Evolved OscillatorExtending the Works of Torben Mogensen, on Torben Median
Median Filtering is an important technique !
The median filter is a non-linear digital filtering technique, often used to remove noise from an image or signal. Such noise reduction is a typical pre-processing step to improve the results of later processing (for example, edge detection on an image). Median filtering is very widely used in digital image processing because, under certain conditions, it preserves edges while removing noise (but see the discussion below), also having applications in signal processing.
Have taken two T-Medians
#1 of Length 13
#2 of Length 55
The Indicator plots the Relationship projection of Medians with the Closing Price as an Area Chart
Provision for Alerts
You get
> Green T-Median Alert
> Red T-Median Alert
Enjoy!


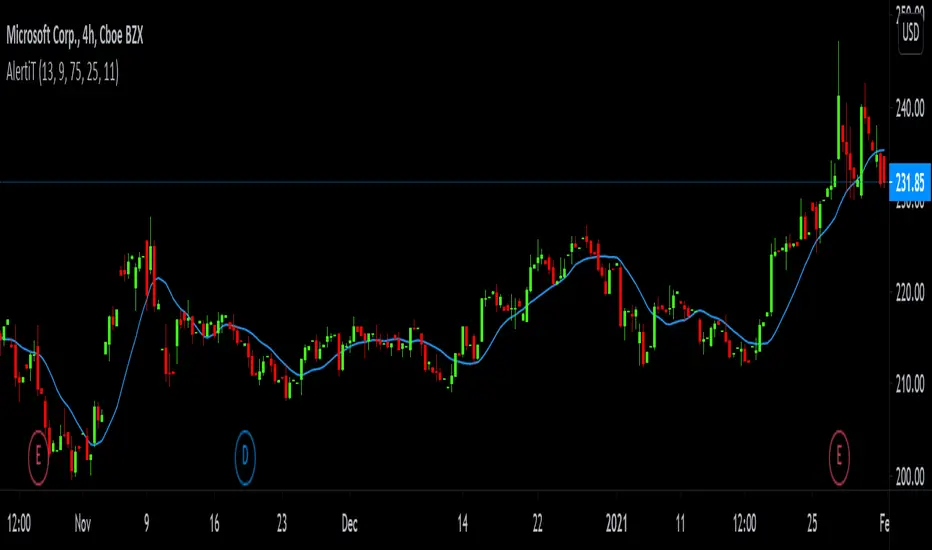
AlertiTI can't be glued to all charts on all tickers all the time. I have a life you know, lol.
So in the spirit of getting fresh air, running errands, working and having fun with family & friends, I setup this AlertiT script.
Three indicators: RSI, SMA and Momentum are used in this script alert.
The alert will be triggered if any of the indicators crosses a specified input.
The message will contain the name of the indicator and its current value.
The default is 13 SMA, 9 RSI +75:-25 and 11 Momentum.
I provided an input in the dialogue box so the variables can be adjusted to suit your needs.
Source is open, high, low, close.
Do your own due diligence, your risk is 100% your responsibility. You win some or you learn some. Consider being charitable with some of your profit to help humankind. Small incremental steps work : If you double a penny a day for a month it = $5,368,709. Good luck and happy trading friends...
*3x lucky 7s of trading*
7pt Trading compass:
Price action, entry/exit
Volume average/direction
Trend, patterns, momentum
Newsworthy current events
Revenue
Earnings
Balance sheet
7 Common mistakes:
+5% portfolio trades, risk management
Beware of analysts motives
Emotions & Opinions
FOMO : bad timing
Lack of planning & discipline
Forgetting restraint
Obdurate repetitive errors, no adaptation
7 Important tools:
Trading View app!, Brokerage UI
Accurate indicators & settings
Wide screen monitor/s
Trading log (pencil & graph paper)
Big organized desk
Reading books, playing chess
Sorted watch-list
Checkout my indicators:
Fibonacci VIP - volume
Fibonacci MA7 - price
pi RSI - trend momentum
TTC - trend channel
AlertiT - notification
www.tradingview.com
Multi MA CloudsEMA Clouds are used for identifying trends. It helps to see moving averages as in a range especially when you look at them in Micro time frames like 1/5/10/15/30 mins. So these Clouds could be used for Intraday trading for identifying trends and pullbacks.
For example, on a 10min chart, once you see a parabolic move, don't take trade until the bar touches 5/13 or 8/9 EMA clouds.
There are other EMA cloud scripts available but this one gives you option to choose MA Type and Source in addition to providing all well known MA range in one script. You can modify the MA length as you wish. So you can disable one you don't want to see on the chart.
Please look at my other scripts at www.tradingview.com

RK's 13 - Moving Average with Fibonacci Lines█ OVERVIEW
After some chart measures, I noticed that if we took the difference between fast and slow Moving Average lines and apply the Fibonacci ratios, we get a very reliable support and resistance level for each bar.
So, I made this script to help me (and anyone who wants to use it) know where we should close or put stops in our orders.
█ HOW TO USE IT:
Choose your preferred Moving Average type and Lengths;
Select the Fibonacci Ratios and test Reverse Lines option to get better levels.
Other useful input options:
Show Labels: Display every Fibonacci Ratio you are using;
Labels Offset Position: Place where the Fibonacci Ratio will appear and get the price in that position;
Project Moving Average Lines in the Future: Draws project Line in the chart.
Tips:
• If you put your mouse in the ratio label, it will show the price in that position
• This script works better when the lines are well apart.

Indices Sector SigmaSpikes█ OVERVIEW
“The benchmark Dow Jones Industrial Average is off nearly 300 points as of midday today...”
“So what? Is that a lot or a little? Should we care?”
-Adam H Grimes-
This screener aims to provide Bird-Eye view across sector indices, to find which sector is having significant or 'out-of-norm' move in either direction.
The significance of the move is measured based on Sigma Spikes, a method proposed by Adam H. Grimes, where Standard Deviation of returns used as a baseline.
*You can google his blog or read his book, got some gold in there, especially on how he use indicators for trading
█ Understanding Sigma Spikes
As described by Grimes, moves in markets are only meaningful when we consider what “normal” is for that market.
Without that baseline, the daily change number, and even the percent change on the day doesn’t really mean much.
To overcome that problem, Sigma Spikes, as a measure of volatility, attempt to put todays change in price (aka return) in context of the standard deviation of 20 days daily's return.
Refer chart below:
1. The blue bars refer to each days return
2. The orange line is 1 time standard deviation of past 20days daily's return (today not included)
3. The red line is 2 time standard deviation of past 20days daily's return (today not included)
Using the ratio of today's return over the Std Deviation, determining your threshold (1,2,3,etc) will be the key that tells if today's move is significant or not.
*Threshold referring to times standard deviation, and different market may require different threshold.
*20 Days period are based on the Lookback Period, adjustable from user input window.
█ Features
- Scan up to 13 symbols at a time (Bursa (MYX) indices are defaulted, but you may change to any symbols/index from the user input setting)
█ Limitation
- Due to multiple use of security() function required to call other symbols, expect the screener to be slow at certain times
- Custom Timeframe currently accept only Daily and Weekly. I'll try to include lower timeframe in the next update
█ Disclaimer
Past performance is not an indicator of future results.
My opinions and research are my own and do not constitute financial advice in any way whatsoever.
Nothing published by me constitutes an investment recommendation, nor should any data or Content published by me be relied upon for any investment/trading activities.
I strongly recommends that you perform your own independent research and/or speak with a qualified investment professional before making any financial decisions.
Any ideas to further improve this indicator are welcome :)

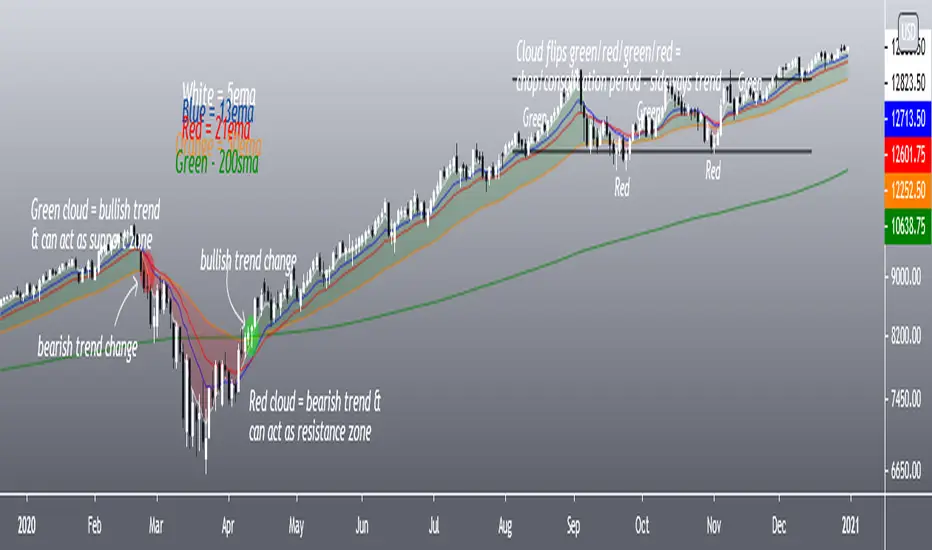
TM Cloud 5/50EMAsA collection of moving averages to form a green/red cloud/trend signal and areas of support and resistance accordingly
4 EMAs (5, 13, 21 & 50)
1 SMA (200)
Green/Red Cloud is formed based on location of 5ema and 50ema. Cloud is green when the 5ema is above the 50ema and red when the 5ema is below. The color of the cloud dictates support or resistance nature of the area.