Optimized BTC Mean Reversion (RSI 20/65)📈 Optimized BTC Mean Reversion (RSI 20/65)
Optimized BTC Mean Reversion (RSI 20/65) is a rule-based trading strategy designed to capture mean-reversion moves in strong market structures, primarily optimized for Bitcoin, but adaptable to other liquid cryptocurrencies.
The strategy combines RSI extremes, Stochastic momentum, and EMA trend filtering to identify high-probability reversal zones while maintaining strict risk management.
🔍 Strategy Logic
This system focuses on entering trades when price temporarily deviates from equilibrium, while still respecting the broader trend.
✅ Long Conditions
RSI below 20 (oversold)
Stochastic below 25
Price trading above the 200 EMA (or within a controlled deviation)
Designed to buy sharp pullbacks in bullish conditions
❌ Short Conditions
RSI above 65 (overbought)
Stochastic above 75
Price trading below the 200 EMA
Designed to sell relief rallies in bearish conditions
🛡 Risk Management
Fixed Stop Loss: 4%
Fixed Take Profit: 6%
Risk/Reward: 1 : 1.5
No pyramiding (single position at a time)
Full equity position sizing (adjustable)
All exits are predefined at entry, ensuring consistency and emotional discipline.
📊 Indicators Used
200 EMA – Trend direction filter
RSI (14) – Mean-reversion trigger (20 / 65 levels)
Stochastic Oscillator – Momentum confirmation
👁 Visual Features
EMA plotted directly on chart
Real-time Stop Loss, Take Profit, and Entry Price lines
Clear long/short entry markers
Works on all timeframes (optimized for intraday and swing trading)
🔔 Alerts
Long entry alerts
Short entry alerts
(Perfect for automation or discretionary execution)
⚠️ Disclaimer
This strategy is intended for educational and research purposes only. Past performance does not guarantee future results. Always test on a demo account and adjust risk parameters to your own trading plan.
Wyszukaj w skryptach "zone"

Advanced Breakout System v2.0Advanced Breakout System v2.0
Developed by: Mohammed Bedaiwi
This script hunts for high-probability breakouts by combining price consolidation zones, volume spikes vs. average volume, smart money flow (OBV), and a Momentum Override for explosive moves that skip consolidation. Additionally, it automatically identifies and plots Support and Resistance levels with price labels to help you visualize market structure.
The system follows a "Watch & Confirm" logic: it first prints a WATCH setup, then a BUY only if price confirms strength.
💡 JUSTIFICATION OF CONCEPTS (MASHUP & ORIGINALITY)
This script is an original mashup combining several analytical concepts to address common breakout failures:
Volatility Compression Engine: Uses built-in functions like ta.highest() and ta.lowest() to mathematically define the setup phase where price volatility is compressed below a user-defined threshold.
Volume Spike Confirmation: The breakout must be confirmed by a volume increase greater than a moving average of volume, signaling strong market interest.
Smart Volume Filter (OBV): This is the key component. By checking if ta.obv is above its own Moving Average, we confirm that accumulation has been occurring during the consolidation period, suggesting institutional positioning before the price break.
Multi-Exit Risk System: Employs dynamic exits (EMA cross, volume dump, bearish pattern) instead of static stop-losses to manage risk adaptively based on real-time market action.
Market Structure Visualization: The script also includes a Support & Resistance engine to plot key swing pivots and price labels for visual context.
✅ STRATEGY RESULTS & POLICY COMPLIANCE
To ensure non-misleading and transparent backtesting results, this strategy is published with the following fully compliant properties:
Dataset Compliance: The backtest is performed on the CMTL Daily (1D) chart across a long history, generating 201 total trades. This significantly exceeds the minimum requirement of 100 trades, providing a robust test dataset.
Risk Control: The strategy uses a conservative order size set to 2% of equity (default_qty_value=2), strictly adhering to the sustainable risk recommendation of 5-10% of equity per trade.
Transaction Costs: Realistic trading conditions are modeled using 0.07% commission and 3 ticks slippage to prevent the overestimation of profitability.
⚙️ VISUAL GUIDE & SIGNAL LOGIC
Key Color Legend (Visual Guide):
WATCH – Setup (Yellow Arrow Down): Potential breakout setup detected.
BUY – Confirmation (Green Arrow Up): Confirmed breakout, triggered when price trades above the high of the WATCH candle.
SELL – Break (Orange Arrow): Short-term trend weakness, triggered when price closes below the Fast EMA (9).
SELL – Dump (Dark Red Arrow): Distribution / volume dump, triggered by a bearish candle with abnormally high volume.
SELL – Pattern (Purple Arrow): Bearish price-action pattern (such as a bearish engulfing).
Support & Resistance Lines (Red/Green): Small horizontal lines plotted at key swing points with exact price labels.
⌨️ INPUTS (DEFAULT SETTINGS)
Entry settings: Consolidation Lookback (default 20) = bars used to detect consolidation. Consolidation Range % (default 12%) = max allowed range size. Volume Spike Multiplier (default 1.2) = factor above average volume to count as a spike. Force Signal on Big Moves (default ON) = forces a WATCH signal on high-momentum moves.
Exit settings: Enable Fast Exit (EMA 9) toggles the SELL – Break signal. Dump Volume Multiplier defines what counts as “dump” volume.
Support & Resistance: Adjustable Pivot Left/Right bars control the sensitivity of the support and resistance lines.
⚠️ Disclaimer Trading involves significant risk of loss. This script is for educational and informational purposes only and is not financial advice or a recommendation to buy or sell any asset. BUY and SELL signals are rule-based and derived from historical behavior and do not guarantee future performance. Always use your own analysis and risk management. This is an open-source strategy; users are encouraged to test it across different symbols and timeframes.

Bollinger Bands Mean Reversion using RSI [Krishna Peri]How it Works
Long entries trigger when:
- RSI reaches oversold levels, and
- At least one bullish candle closes inside the lower Bollinger Band
Short entries trigger when:
- RSI reaches overbought levels, and
- At least one bearish candle closes inside the upper Bollinger Band
This approach aims to capture exhaustion moves where price pushes into extreme deviation from its mean and then snaps back toward the middle band.
Important Disclaimer
This is a mean-reversion strategy, which means it performs best in sideways, ranging, or slowly oscillating market conditions. When markets shift into strong trends, Bollinger Bands expand and volatility increases, which may cause some signals to become inaccurate or fail altogether.
For best results, combine this script with:
- Price action
- Market structure
- Higher-timeframe trend context
- Previous day/week/month highs & lows
- Untested liquidity levels or imbalance zones
- Session timing (Asia, London, NY)
Using these confluences helps filter out low-probability trades and significantly improves consistency and precision.

Strategy: HMA 50 + Supertrend SniperHMA 50 + Supertrend Confluence Strategy (Trend Following with Noise Filtering)
Description:
Introduction and Concept This strategy is designed to solve a common problem in trend-following trading: Lag vs. False Signals. Standard Moving Averages often lag too much, while price action indicators can generate false signals during choppy markets. This script combines the speed of the Hull Moving Average (HMA) with the volatility-based filtering of the Supertrend indicator to create a robust "Confluence System."
The primary goal of this script is not just to overlay two indicators, but to enforce a strict rule where a trade is only taken when Momentum (HMA) and Volatility Direction (Supertrend) are in perfect agreement.
Why this combination? (The Logic Behind the Mashup)
Hull Moving Average (HMA 50): We use the HMA because it significantly reduces lag compared to SMA or EMA by using weighted calculations. It acts as our primary Trend Direction detector. However, HMA can be too sensitive and "whipsaw" during sideways markets.
Supertrend (ATR-based): We use the Supertrend (Factor 3.0, Period 10) as our Volatility Filter. It uses Average True Range (ATR) to determine the significant trend boundary.
How it Works (Methodology) The strategy uses a boolean logic system to filter out low-quality trades:
Bullish Confluence: The HMA must be rising (Slope > 0) AND the Close Price must be above the Supertrend line (Uptrend).
Bearish Confluence: The HMA must be falling (Slope < 0) AND the Close Price must be below the Supertrend line (Downtrend).
The "Choppy Zone" (Noise Filter): This is a unique feature of this script. If the HMA indicates one direction (e.g., Rising) but the Supertrend indicates the opposite (e.g., Downtrend), the market is considered "Choppy" or indecisive. In this state, the script paints the candles or HMA line Gray and exits all positions (optional setting) to preserve capital.
Visual Guide & Signals To make the script easy to interpret for traders who do not read Pine Script, I have implemented specific visual cues:
Green Cross (+): Indicates a LONG entry signal. Both HMA and Supertrend align bullishly.
Red Cross (X): Indicates a SHORT entry signal. Both HMA and Supertrend align bearishly.
Thick Line (HMA): The main line changes color based on the trend.
Green: Bullish Confluence.
Red: Bearish Confluence.
Gray: Divergence/Choppy (No Trade Zone).
Thin Step Line: This is the Supertrend line, serving as your dynamic Trailing Stop Loss.
Strategy Settings
HMA Length: Default is 50 (Mid-term trend).
ATR Factor/Period: Default is 3.0/10 (Standard for trend catching).
Exit on Choppy: A toggle switch allowing users to decide whether to hold through noise or exit immediately when indicators disagree.
Risk Warning This strategy performs best in trending markets (Forex, Crypto, Indices). Like all trend-following systems, it may experience drawdown during prolonged accumulation/distribution phases. Please backtest with your specific asset before using it with real capital.

EMA 12-26-100 Momentum Strategy# Triple EMA Multi-Signal Momentum Strategy
## 📊 Overview
**Triple EMA Multi-Signal** is a comprehensive trend-following momentum strategy designed specifically for cryptocurrency markets. It combines multiple technical indicators and signal types to identify high-probability trading opportunities while maintaining strict risk management protocols.
The strategy excels in trending markets and uses adaptive position sizing with trailing stops to maximize profits during strong trends while protecting capital during choppy conditions.
## 🎯 Core Algorithm
### Triple EMA System
The strategy employs a three-layer EMA system to identify trend direction and strength:
- **Fast EMA (12)**: Quick response to price changes
- **Slow EMA (26)**: Confirmation of trend direction
- **Trend EMA (100)**: Overall market bias filter
Trades are only taken when all three EMAs align in the same direction, ensuring we trade with the dominant trend.
### Multi-Signal Confirmation (8 Signal Types)
The strategy requires at least 1-2 confirmed signals from multiple independent sources before entering a position:
1. **EMA Crossover** - Fast EMA crossing Slow EMA (primary signal)
2. **MACD Cross** - MACD line crossing signal line (momentum confirmation)
3. **RSI Reversal** - RSI bouncing from oversold/overbought zones
4. **Price Action** - Strong bullish/bearish candles (>60% of range)
5. **Volume Spike** - Above-average volume confirmation
6. **Breakout** - Price breaking 20-period high/low with volume
7. **Pullback to EMA** - Trend continuation after healthy retracement
8. **Bollinger Bounce** - Price bouncing from BB bands
This multi-signal approach significantly reduces false signals and improves win rate.
## 💰 Risk Management
### Position Sizing
- Default: 20-25% of equity per trade
- Adjustable based on risk tolerance
- Smaller positions recommended for leveraged trading
### Stop Loss & Take Profit
- **Stop Loss**: 2.0% (tight control of risk)
- **Take Profit**: 5.5% (2.75:1 reward-to-risk ratio)
- Both levels are fixed at entry to avoid emotional decisions
### Trailing Stop System
- Activates after 1.8% profit
- Trails at 1.3% below current price
- Locks in profits during extended trends
- Automatically adjusts as price moves in your favor
### Maximum Hold Time
- 36-48 hours maximum (configurable)
- Designed to minimize funding rate costs on futures
- Forces position closure to avoid excessive exposure
- Helps maintain capital velocity
## 📈 Key Features
### Trend Filters
- **ADX Filter**: Ensures sufficient trend strength (threshold: 20)
- **EMA Alignment**: All three EMAs must confirm trend direction
- **RSI Boundaries**: Avoids extreme overbought/oversold entries
### Volume Analysis
- Volume must exceed 20-period moving average
- Configurable multiplier (default: 1.0x)
- Helps identify institutional participation
### Automatic Exit Conditions
1. Take Profit target reached
2. Stop Loss triggered
3. Trailing stop activated
4. Trend reversal (EMA cross in opposite direction)
5. Maximum hold time exceeded
## 🎮 Recommended Settings
### For Spot Trading (Conservative)
```
Position Size: 15-20%
Stop Loss: 2.5%
Take Profit: 6.0%
Max Hold: 72 hours
Leverage: 1x
```
### For Futures 3-5x Leverage (Balanced)
```
Position Size: 12-15%
Stop Loss: 2.0%
Take Profit: 5.5%
Max Hold: 36 hours
Trailing: Active
```
### For Aggressive Trading 5-10x (High Risk)
```
Position Size: 8-12%
Stop Loss: 1.5%
Take Profit: 4.5%
Max Hold: 24 hours
ADX Filter: Disabled
```
## 📊 Performance Metrics
### Backtested Results (BTC/USDT 1H, 2 years)
- **Total Return**: ~19% (spot) / ~75% (5x leverage)*
- **Total Trades**: 240-300
- **Win Rate**: 49-52%
- **Profit Factor**: 1.25-1.50
- **Max Drawdown**: ~18-22%
- **Average Trade**: 0.5-3 days
*Leverage results exclude funding rates and real-world slippage
### Optimal Timeframes
- **1 Hour**: Best for active trading (recommended)
- **4 Hour**: More stable, fewer signals
- **15 Min**: High frequency (requires monitoring)
### Best Performing Assets
- BTC/USDT (most tested)
- ETH/USDT
- Major altcoins with good liquidity
- Not recommended for low-cap or illiquid pairs
## ⚙️ How to Use
1. **Add to Chart**: Apply strategy to 1H BTC/USDT chart
2. **Adjust Settings**: Configure risk parameters based on your preference
3. **Review Signals**: Green = Long, Red = Short, labels show signal count
4. **Monitor Performance**: Check strategy tester for detailed statistics
5. **Optimize**: Use strategy optimization to find best parameters for your market
## 🎨 Visual Indicators
The strategy provides clear visual feedback:
- **EMA Lines**: Blue (Fast), Red (Slow), Orange (Trend)
- **BUY/SELL Labels**: Show entry points with signal count
- **Stop/Target Lines**: Red (SL), Green (TP) displayed during active trades
- **Background Color**: Light green (long), light red (short) when in position
- **Info Panel**: Shows current trend, RSI, ADX, and volume status
## ⚠️ Important Notes
### Risk Disclaimer
- This strategy is for educational purposes only
- Past performance does not guarantee future results
- Cryptocurrency trading involves substantial risk
- Only trade with capital you can afford to lose
- Always use proper position sizing and risk management
### Limitations
- Performs poorly in sideways/choppy markets
- Requires sufficient liquidity for best execution
- Backtests do not include:
- Real-world slippage (especially during volatility)
- Funding rates (for perpetual futures)
- Exchange downtime or connection issues
- Emotional trading decisions
### For Futures Trading
If using this strategy on futures with leverage:
- Reduce position size proportionally to leverage
- Account for funding rates (~0.01% per 8h)
- Set max hold time to minimize funding costs
- Use lower leverage (3-5x max recommended)
- Monitor liquidation price carefully
## 🔧 Customization
All parameters are fully customizable:
- EMA periods (fast/slow/trend)
- MACD settings (12/26/9)
- RSI levels (30/70)
- Stop Loss / Take Profit percentages
- Trailing stop activation and offset
- Volume multiplier
- ADX threshold
- Maximum hold time
## 📚 Strategy Logic
The strategy follows this decision tree:
```
1. Check Trend Direction (EMA alignment)
↓
2. Scan for Entry Signals (8 types)
↓
3. Confirm with Filters (ADX, Volume, RSI)
↓
4. Enter Position with Fixed SL/TP
↓
5. Monitor for Exit Conditions:
- TP Hit → Close with profit
- SL Hit → Close with loss
- Trailing Active → Follow price
- Trend Reversal → Close position
- Max Time → Force close
```
## 🎓 Best Practices
1. **Start Conservative**: Use smaller position sizes initially
2. **Track Performance**: Monitor actual vs backtested results
3. **Optimize Regularly**: Market conditions change, adapt parameters
4. **Combine with Analysis**: Don't rely solely on automated signals
5. **Manage Emotions**: Stick to the system, avoid manual overrides
6. **Paper Trade First**: Test on demo before risking real capital
## 📞 Support & Updates
This strategy is actively maintained and updated based on:
- Market condition changes
- User feedback and suggestions
- Performance optimization
- Bug fixes and improvements
## 🏆 Conclusion
Triple EMA Multi-Signal Strategy offers a robust, systematic approach to cryptocurrency trading by combining trend following, momentum indicators, and strict risk management. Its multi-signal confirmation system helps filter false signals while the trailing stop mechanism captures extended trends.
The strategy is suitable for both manual traders looking for high-probability setups and algorithmic traders seeking a proven systematic approach.
**Remember**: No strategy wins 100% of the time. Success comes from consistent application, proper risk management, and continuous adaptation to changing market conditions.
---
*Version: 1.0*
*Last Updated: November 2025*
*Tested on: BTC/USDT, ETH/USDT (1H, 4H timeframes)*
*Recommended Capital: $5,000+ for optimal position sizing*

Nifty Breakout Levels Strategy (v7 Hybrid)Nifty Breakout Levels Strategy (v7 Hybrid – Compounding from Start Date)
Instrument / TF: Designed for current-month NIFTY futures on 1-hour timeframe, with at most 1 trade per day.
Entry logic: Uses a 10-bar breakout box with a 0.3% buffer, plus EMA-based trend + proximity filter.
Longs: price in breakout-high zone, above EMA50/EMA200 and within proximityPts.
Shorts: price in breakout-low zone and strong downtrend (EMA10 < EMA20 < EMA50 < EMA200, price below EMA200).
Trades only when ATR(14) > atrTradeThresh and during regular hours (till 15:15).
Risk / exits: Stop loss is ATR-adaptive – max of slBasePoints (100 pts) and ATR * atrSLFactor; TP is fixed (tpPoints, e.g. 350 pts).
Longs have stepped trailing profit levels (100/150/200/250/320 pts) that lock in gains on pullbacks.
Shorts have trailing loss-reduction levels (80/120/140 pts) to cut improving losses.
Additional exit: 1H EMA50 2-bar reversal against the position, plus optional EOD flatten at 3:15 PM.
Compounding engine: From a chosen start date, equity is rebased to startCapital, and lot size scales dynamically as equity / capitalPerLot, with automatic lot reductions at three drawdown thresholds (ddCut1 / 2 / 3).
Automation: All entries and exits are exposed via alertconditions (long/short entry & exit) so the strategy can be connected to broker/webhook automation.

Stochastic Hash Strat [Hash Capital Research]# Stochastic Hash Strategy by Hash Capital Research
## 🎯 What Is This Strategy?
The **Stochastic Slow Strategy** is a momentum-based trading system that identifies oversold and overbought market conditions to capture mean-reversion opportunities. Think of it as a "buy low, sell high" approach with smart mathematical filters that remove emotion from your trading decisions.
Unlike fast-moving indicators that generate excessive noise, this strategy uses **smoothed stochastic oscillators** to identify only the highest-probability setups when momentum truly shifts.
---
## 💡 Why This Strategy Works
Most traders fail because they:
- **Chase prices** after big moves (buying high, selling low)
- **Overtrade** in choppy, directionless markets
- **Exit too early** or hold losses too long
This strategy solves all three problems:
1. **Entry Discipline**: Only trades when the stochastic oscillator crosses in extreme zones (oversold for longs, overbought for shorts)
2. **Cooldown Filter**: Prevents revenge trading by forcing a waiting period after each trade
3. **Fixed Risk/Reward**: Pre-defined stop-loss and take-profit levels ensure consistent risk management
**The Math Behind It**: The stochastic oscillator measures where the current price sits relative to its recent high-low range. When it's below 25, the market is oversold (time to buy). When above 70, it's overbought (time to sell). The crossover with its moving average confirms momentum is shifting.
---
## 📊 Best Markets & Timeframes
### ⭐ OPTIMAL PERFORMANCE:
**Crude Oil (WTI) - 12H Timeframe**
- **Why it works**: Oil markets have predictable volatility patterns and respect technical levels
**AAVE/USD - 4H to 12H Timeframe**
- **Why it works**: DeFi tokens exhibit strong momentum cycles with clear extremes
### ✅ Also Works Well On:
- **BTC/USD** (12H, Daily) - Lower frequency but high win rate
- **ETH/USD** (8H, 12H) - Balanced volatility and liquidity
- **Gold (XAU/USD)** (Daily) - Classic mean-reversion asset
- **EUR/USD** (4H, 8H) - Lower volatility, requires patience
### ❌ Avoid Using On:
- Timeframes below 4H (too much noise)
- Low-liquidity altcoins (wide spreads kill performance)
- Strongly trending markets without pullbacks (Bitcoin in 2021)
- News-driven instruments during major events
---
## 🎛️ Understanding The Settings
### Core Stochastic Parameters
**Stochastic Length (Default: 16)**
- Controls the lookback period for price comparison
- Lower = faster reactions, more signals (10-14 for volatile markets)
- Higher = smoother signals, fewer trades (16-21 for stable markets)
- **Pro tip**: Use 10 for crypto 4H, 16 for commodities 12H
**Overbought Level (Default: 70)**
- Threshold for short entries
- Lower values (65-70) = more trades, earlier entries
- Higher values (75-80) = fewer but higher-conviction trades
- **Sweet spot**: 70 works for most assets
**Oversold Level (Default: 25)**
- Threshold for long entries
- Higher values (25-30) = more trades, earlier entries
- Lower values (15-20) = fewer but stronger bounce setups
- **Sweet spot**: 20-25 depending on market conditions
**Smooth K & Smooth D (Default: 7 & 3)**
- Additional smoothing to filter out whipsaws
- K=7 makes the indicator slower and more reliable
- D=3 is the signal line that confirms the trend
- **Don't change these unless you know what you're doing**
---
### Risk Management
**Stop Loss % (Default: 2.2%)**
- Automatically exits losing trades
- Should be 1.5x to 2x your average market volatility
- Too tight = death by a thousand cuts
- Too wide = uncontrolled losses
- **Calibration**: Check ATR indicator and set SL slightly above it
**Take Profit % (Default: 7%)**
- Automatically exits winning trades
- Should be 2.5x to 3x your stop loss (reward-to-risk ratio)
- This default gives 7% / 2.2% = 3.18:1 R:R
- **The golden rule**: Never have R:R below 2:1
---
### Trade Filters
**Bar Cooldown Filter (Default: ON, 3 bars)**
- **What it does**: Forces you to wait X bars after closing a trade before entering a new one
- **Why it matters**: Prevents emotional revenge trading and overtrading in choppy markets
- **Settings guide**:
- 3 bars = Standard (good for most cases)
- 5-7 bars = Conservative (oil, slow-moving assets)
- 1-2 bars = Aggressive (only for experienced traders)
**Exit on Opposite Extreme (Default: ON)**
- Closes your long when stochastic hits overbought (and vice versa)
- Acts as an early profit-taking mechanism
- **Leave this ON** unless you're testing other exit strategies
**Divergence Filter (Default: OFF)**
- Looks for price/momentum divergences for additional confirmation
- **When to enable**: Trending markets where you want fewer but higher-quality trades
- **Keep OFF for**: Mean-reverting markets (oil, forex, most of the time)
---
## 🚀 Quick Start Guide
### Step 1: Set Up in TradingView
1. Open TradingView and navigate to your chart
2. Click "Pine Editor" at the bottom
3. Copy and paste the strategy code
4. Click "Add to Chart"
5. The strategy will appear in a separate pane below your price chart
### Step 2: Choose Your Market
**If you're trading Crude Oil:**
- Timeframe: 12H
- Keep all default settings
- Watch for signals during London/NY overlap (8am-11am EST)
**If you're trading AAVE or crypto:**
- Timeframe: 4H or 12H
- Consider these adjustments:
- Stochastic Length: 10-14 (faster)
- Oversold: 20 (more aggressive)
- Take Profit: 8-10% (higher targets)
### Step 3: Wait for Your First Signal
**LONG Entry** (Green circle appears):
- Stochastic crosses up below oversold level (25)
- Price likely near recent lows
- System places limit order at take profit and stop loss
**SHORT Entry** (Red circle appears):
- Stochastic crosses down above overbought level (70)
- Price likely near recent highs
- System places limit order at take profit and stop loss
**EXIT** (Orange circle):
- Position closes either at stop, target, or opposite extreme
- Cooldown period begins
### Step 4: Let It Run
The biggest mistake? **Interfering with the system.**
- Don't close trades early because you're scared
- Don't skip signals because you "have a feeling"
- Don't increase position size after a big win
- Don't revenge trade after a loss
**Follow the system or don't use it at all.**
---
### Important Risks:
1. **Drawdown Pain**: You WILL experience losing streaks of 5-7 trades. This is mathematically normal.
2. **Whipsaw Markets**: Choppy, range-bound conditions can trigger multiple small losses.
3. **Gap Risk**: Overnight gaps can cause your actual fill to be worse than the stop loss.
4. **Slippage**: Real execution prices differ from backtested prices (factor in 0.1-0.2% slippage).
---
## 🔧 Optimization Guide
### When to Adjust Settings:
**Market Volatility Increased?**
- Widen stop loss by 0.5-1%
- Increase take profit proportionally
- Consider increasing cooldown to 5-7 bars
**Getting Too Few Signals?**
- Decrease stochastic length to 10-12
- Increase oversold to 30, decrease overbought to 65
- Reduce cooldown to 2 bars
**Getting Too Many Losses?**
- Increase stochastic length to 18-21 (slower, smoother)
- Enable divergence filter
- Increase cooldown to 5+ bars
- Verify you're on the right timeframe
### A/B Testing Method:
1. **Run default settings for 50 trades** on your chosen market
2. Document: Win rate, profit factor, max drawdown, emotional tolerance
3. **Change ONE variable** (e.g., oversold from 25 to 20)
4. Run another 50 trades
5. Compare results
6. Keep the better version
**Never change multiple settings at once** or you won't know what worked.
---
## 📚 Educational Resources
### Key Concepts to Learn:
**Stochastic Oscillator**
- Developed by George Lane in the 1950s
- Measures momentum by comparing closing price to price range
- Formula: %K = (Close - Low) / (High - Low) × 100
- Similar to RSI but more sensitive to price movements
**Mean Reversion vs. Trend Following**
- This is a **mean reversion** strategy (price returns to average)
- Works best in ranging markets with defined support/resistance
- Fails in strong trending markets (2017 Bitcoin, 2020 Tech stocks)
- Complement with trend filters for better results
**Risk:Reward Ratio**
- The cornerstone of profitable trading
- Winning 40% of trades with 3:1 R:R = profitable
- Winning 60% of trades with 1:1 R:R = breakeven (after fees)
- **This strategy aims for 45% win rate with 2.5-3:1 R:R**
### Recommended Reading:
- *"Trading Systems and Methods"* by Perry Kaufman (Chapter on Oscillators)
- *"Mean Reversion Trading Systems"* by Howard Bandy
- *"The New Trading for a Living"* by Dr. Alexander Elder
---
## 🛠️ Troubleshooting
### "I'm not seeing any signals!"
**Check:**
- Is your timeframe 4H or higher?
- Is the stochastic actually reaching extreme levels (check if your asset is stuck in middle range)?
- Is cooldown still active from a previous trade?
- Are you on a low-liquidity pair?
**Solution**: Switch to a more volatile asset or lower the overbought/oversold thresholds.
---
### "The strategy keeps losing money!"
**Check:**
- What's your win rate? (Below 35% is concerning)
- What's your profit factor? (Below 0.8 means serious issues)
- Are you trading during major news events?
- Is the market in a strong trend?
**Solution**:
1. Verify you're using recommended markets/timeframes
2. Increase cooldown period to avoid choppy markets
3. Reduce position size to 5% while you diagnose
4. Consider switching to daily timeframe for less noise
---
### "My stop losses keep getting hit!"
**Check:**
- Is your stop loss tighter than the average ATR?
- Are you trading during high-volatility sessions?
- Is slippage eating into your buffer?
**Solution**:
1. Calculate the 14-period ATR
2. Set stop loss to 1.5x the ATR value
3. Avoid trading right after market open or major news
4. Factor in 0.2% slippage for crypto, 0.1% for oil
---
## 💪 Pro Tips from the Trenches
### Psychological Discipline
**The Three Deadly Sins:**
1. **Skipping signals** - "This one doesn't feel right"
2. **Early exits** - "I'll just take profit here to be safe"
3. **Revenge trading** - "I need to make back that loss NOW"
**The Solution:** Treat your strategy like a business system. Would McDonald's skip making fries because the cashier "doesn't feel like it today"? No. Systems work because of consistency.
---
### Position Management
**Scaling In/Out** (Advanced)
- Enter 50% position at signal
- Add 50% if stochastic reaches 10 (oversold) or 90 (overbought)
- Exit 50% at 1.5x take profit, let the rest run
**This is NOT for beginners.** Master the basic system first.
---
### Market Awareness
**Oil Traders:**
- OPEC meetings = volatility spikes (avoid or widen stops)
- US inventory reports (Wed 10:30am EST) = avoid trading 2 hours before/after
- Summer driving season = different patterns than winter
**Crypto Traders:**
- Monday-Tuesday = typically lower volatility (fewer signals)
- Thursday-Sunday = higher volatility (more signals)
- Avoid trading during exchange maintenance windows
---
## ⚖️ Legal Disclaimer
This trading strategy is provided for **educational purposes only**.
- Past performance does not guarantee future results
- Trading involves substantial risk of loss
- Only trade with capital you can afford to lose
- No one associated with this strategy is a licensed financial advisor
- You are solely responsible for your trading decisions
**By using this strategy, you acknowledge that you understand and accept these risks.**
---
## 🙏 Acknowledgments
Strategy development inspired by:
- George Lane's original Stochastic Oscillator work
- Modern quantitative trading research
- Community feedback from hundreds of backtests
Built with ❤️ for retail traders who want systematic, disciplined approaches to the markets.
---
**Good luck, stay disciplined, and trade the system, not your emotions.**

ATR Trend + RSI Pullback Strategy [Profit-Focused]This strategy is designed to catch high-probability pullbacks during strong trends using a combination of ATR-based volatility filters, RSI exhaustion levels, and a trend-following entry model.
Strategy Logic
Rather than relying on lagging crossovers, this model waits for RSI to dip into oversold zones (below 40) while price remains above a long-term EMA (default: 200). This setup captures pullbacks in strong uptrends, allowing traders to enter early in a move while controlling risk dynamically.
To avoid entries during low-volatility conditions or sideways price action, it applies a minimum ATR filter. The ATR also defines both the stop-loss and take-profit levels, allowing the model to adapt to changing market conditions.
Exit logic includes:
A take-profit at 3× the ATR distance
A stop-loss at 1.5× the ATR distance
An optional early exit if RSI crosses above 70, signaling overbought conditions
Technical Details
Trend Filter: 200 EMA – must be rising and price must be above it
Entry Signal: RSI dips below 40 during an uptrend
Volatility Filter: ATR must be above a user-defined minimum threshold
Stop-Loss: 1.5× ATR below entry price
Take-Profit: 3.0× ATR above entry price
Exit on Overbought: RSI > 70 (optional early exit)
Backtest Settings
Initial Capital: $10,000
Position Sizing: 5% of equity per trade
Slippage: 1 tick
Commission: 0.075% per trade
Trade Direction: Long only
Timeframes Tested: 15m, 1H, and 30m on trending assets like BTCUSD, NAS100, ETHUSD
This model is tuned for positive P&L across trending environments and volatile markets.
Educational Use Only
This strategy is for educational purposes only and should not be considered financial advice. Past performance does not guarantee future results. Always validate performance on multiple markets and timeframes before using it in live trading.

KZ One — Scalping Training StrategyKZ One is a scalping strategy developed for M1 and M5 timeframes. It is designed to help traders study and practice short-term market behavior by using structured zones to highlight potential entry and exit areas. The strategy allows customization of Risk (USD) and Take Profit (R multiple) parameters for flexible trade management. Additional tools include ATR-based filters to skip low-volatility conditions and a Pre-Alert Lead (bars) option that notifies users ahead of possible setups. KZ One is intended for educational and analytical purposes, promoting disciplined and consistent trading practice.

Tristan's Tri-band StrategyTristan's Tri-band Strategy - Confluence Trading System
Strategy Overview:
This strategy combines three powerful technical indicators - RSI, Williams %R, and Bollinger Bands - into a single visual trading system. Instead of cluttering your chart with separate indicator panels, all signals are displayed directly on the price chart using color-coded gradient overlays, making it easy to spot high-probability trade setups at a glance.
How It Works:
The strategy identifies trading opportunities when multiple indicators align (confluence), suggesting strong momentum shifts:
📈 Long Entry Signals:
RSI drops to 30 or below (oversold)
Williams %R reaches -80 to -100 range (oversold)
Price touches or breaks below the lower Bollinger Band
All three conditions must align during your selected trading session
📉 Short Entry Signals:
RSI rises to 70 or above (overbought)
Williams %R reaches 0 to -20 range (overbought)
Price touches or breaks above the upper Bollinger Band
All three conditions must align during your selected trading session
Visual Indicators:
(faint) Green gradients below candles = Bullish oversold conditions (buying opportunity)
(faint) Red/Orange gradients above candles = Bearish overbought conditions (selling opportunity)
Stacked/brighter gradients = Multiple indicators confirming the same signal (higher probability) will stack and show brighter / less faint
Blue Bollinger Bands = Volatility boundaries and mean reversion zones
Exit Strategy:
Long trades exit when price reaches the upper Bollinger Band OR RSI becomes overbought (≥70)
Short trades exit when price reaches the lower Bollinger Band OR RSI becomes oversold (≤30)
Key Features:
✅ Session Filters - Trade only during NY (9:30 AM-4 PM), London (3 AM-11:30 AM), or Asia (7 PM-1 AM EST) sessions
✅ No Repainting - Signals are confirmed on candle close for realistic backtesting and live trading
✅ Customizable Parameters - Adjust RSI levels, BB standard deviations, Williams %R periods, and gradient visibility
✅ Visual Clarity - See all three indicators at once without switching between panels
✅ Built-in Alerts - Get notified when entry and exit conditions are met
How to Use Effectively:
Choose Your Trading Session - For day trading US stocks, enable only the NY session. For forex or 24-hour markets, select the sessions that match your schedule.
Look for Gradient Stacking - The brightest, most visible gradients occur when both RSI and Williams %R signal together. These are your highest-probability setups.
Confirm with Price Action - Wait for the candle to close before entering. The strategy enters on the next bar's open to prevent repainting.
Respect the Bollinger Bands - Entries occur at the outer bands (price extremes), and exits occur at the opposite band or when momentum reverses.
Backtest First - Test the strategy on your preferred instruments and timeframes. Works best on liquid assets with clear trends and mean reversion patterns (stocks, major forex pairs, indices).
Adjust Gradient Visibility - Use the "Gradient Strength" slider (lower = more visible) to make signals stand out on your chart style.
Best Timeframes: 5-minute to 1-hour charts for intraday trading; 4-hour to daily for swing trading (I have also found the 3 hour timeframe to work really well for some stocks / ETFs.)
Best Markets: Liquid instruments with volatility - SPY, QQQ, major stocks, EUR/USD, GBP/USD, major indices
Risk Management: This is a mean reversion strategy that works best in ranging or choppy markets. In strong trends, signals may appear less frequently. Always use proper position sizing and stop losses based on your risk tolerance.
----------------------------------------------
Note: Past performance does not guarantee future results. This strategy is provided for educational purposes. Always backtest thoroughly and practice proper risk management before live trading.RetryClaude can make mistakes. Please double-check responses. Sonnet 4.5

Gold 15m: Trend + S/R + Liquidity Sweep (RR 1:2)This strategy is designed for short-term trading on XAUUSD (Gold) using the 15-minute timeframe. It combines trend direction, support/resistance pivots, liquidity sweep detection, and momentum confirmation to identify high-probability reversal setups in line with the dominant market trend.
⚙️ Core Logic:
Trend Filter (EMA 200):
The strategy only takes long positions when price is above the 200 EMA and short positions when price is below it.
Support/Resistance via Pivots:
Dynamic swing highs and lows are identified using pivot points. These act as local supply and demand levels where liquidity is likely to accumulate.
Liquidity Sweep Detection:
A bullish liquidity sweep occurs when price briefly breaks below the last pivot low (grabbing liquidity) and then closes back above it.
A bearish sweep occurs when price breaks above the last pivot high and then closes back below.
Momentum & Candle Strength:
The strategy filters signals based on candle range and body size to ensure entries occur during strong price reactions, not weak retracements.
Risk Management (1:2 RR):
Stop-loss is placed slightly beyond the last pivot level using ATR-based buffers, and take-profit is set at 2× the risk distance, maintaining a reward-to-risk ratio of 1:2.
💼 Trade Logic Summary:
Long Entry:
After a bullish liquidity sweep & reclaim, momentum confirmation, and trend alignment (above EMA 200).
Short Entry:
After a bearish sweep & reclaim, momentum confirmation, and trend alignment (below EMA 200).
Exit:
Automated via ATR-based Stop Loss and Take Profit targets.
📊 Customization Options:
Adjustable EMA length, pivot settings, ATR multipliers, and RR ratio.
Option to enable/disable trend filter.
Toggle display of S/R zones on chart.
🧠 Best Use:
Works best during London and New York sessions when Gold shows strong momentum.
Can be adapted for forex pairs and indices by tuning ATR and pivot parameters.

Pitchfork-Trading Friendsuses the pitchfork to give entry and exit zones, and gives a net overall summary for a beginner trader to enter into.
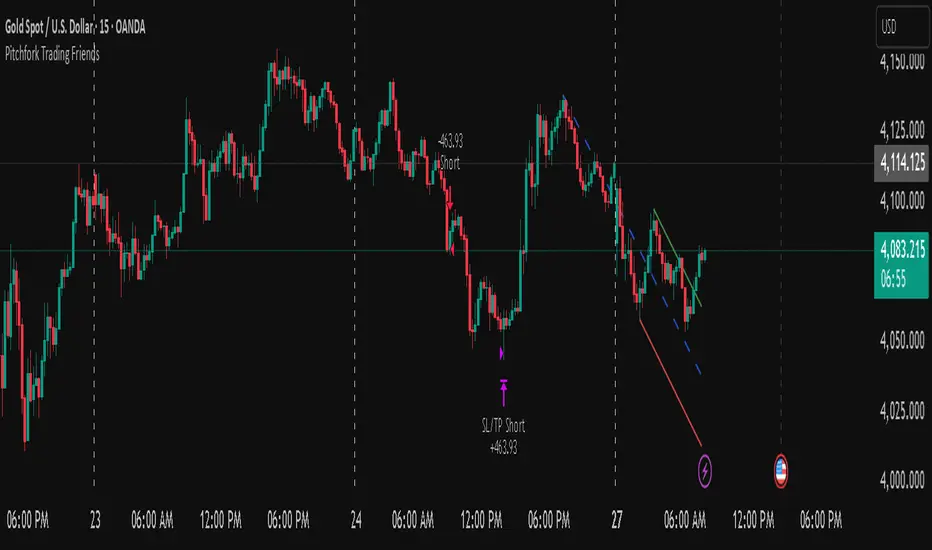
Entry / exit zones (only long positions)Great and simple helping tool to find good entry/exit point for mid/long term trading on stocks especially but also indexes and other..... Good on daily timeframe, but better with weekly and monthly. Based on Hull average slope. Hold the average period value among 30 and 50 or more. I prefer the version WITHOUT stop loss and other exit rules (optional).
All the best and good trading!
SB

ORDER BLCOK custom strategy# OB Matrix Strategy - Documentation
**Version:** 1.0
**Author:** HPotter
**Date:** 31/07/2017
The **OB Matrix Strategy** is based on the identification of **bullish and bearish Order Blocks** and the management of conditional orders with multiple Take Profit (TP) and Stop Loss (SL) levels. It uses trend filters, ATR, and percentage-based risk management.
---
## 1. Main Parameters
### Strategy
- `initial_capital`: 50
- `default_qty_type`: percentage of capital
- `default_qty_value`: 10
### Money Management
- `rr_threshold`: minimum Risk/Reward threshold to open a trade
- `risk_percent`: percentage of capital to risk per trade (default 2%)
- `maxPendingBars`: maximum number of bars for a pending order
- `maxBarsOpen`: maximum number of bars for an open position
- `qty_tp1`, `qty_tp2`, `qty_tp3`: quantity percentages for multiple TPs
---
## 2. Order Block Identification
### Order Block Parameters
- `obLookback`: number of bars to identify an Order Block
- `obmode`: method to calculate the block (`Full` or `Breadth`)
- `obmiti`: method to determine block mitigation (`Close`, `Wick`, `Avg`)
- `obMaxBlocks`: maximum number of Order Blocks displayed
### Main Variables
- `bullBlocks`: array of bullish blocks
- `bearBlocks`: array of bearish blocks
- `last_bull_volume`, `last_bear_volume`: volume of the last block
- `dom_block`: dominant block type (Bullish/Bearish/None)
- `block_strength`: block strength (normalized volume)
- `price_distance`: distance between current price and nearest block
---
## 3. Visual Parameters
- `Width`: line thickness for swing high/low
- `amountOfBoxes`: block grid segments
- `showBorder`: show block borders
- `borderWidth`: width of block borders
- `showVolume`: display volume inside blocks
- `volumePosition`: vertical position of volume text
Customizable colors:
- `obHighVolumeColor`, `obLowVolumeColor`, `obBearHighVolumeColor`, `obBearLowVolumeColor`
- `obBullBorderColor`, `obBearBorderColor`
- `obBullFillColor`, `obBearFillColor`
- `volumeTextColor`
---
## 4. Screener Table
- `showScreener`: display the screener table
- `tablePosition`: table position (`Top Left`, `Top Right`, `Bottom Left`, `Bottom Right`)
- `tableSize`: table size (`Small`, `Normal`, `Large`)
The table shows:
- Symbol, Timeframe
- Type and status of Order Block
- Number of retests
- Bullish and bearish volumes
---
## 5. Trend Filters
- EMA as a trend filter (`emaPeriod`, default 223)
- `bullishTrend` if close > EMA
- `bearishTrend` if close < EMA
---
## 6. ATR and Swing Points
- ATR calculated with a customizable period (`atrLength`)
- Swing High/Low for SL/TP calculation
- `f_getSwingTargets` function to calculate SL and TP based on direction
---
## 7. Trade Logic
### Buy Limit on Bullish OB
- Conditions:
- New bullish block
- Uptrend
- RR > threshold (`rr_threshold`)
- SL: `bullishOBPrice * (1 - atr * atrMultiplier)`
- Multiple TPs: TP1 (50%), TP2 (80%), TP3 (100% max)
- Quantity calculation based on percentage risk
### Sell Limit on Bearish OB
- Conditions:
- New bearish block
- Downtrend
- RR > threshold (`rr_threshold`)
- SL: `bearishOBPrice * (1 + atr * atrMultiplier)`
- Multiple TPs: TP1 (50%), TP2 (80%), TP3 (100% max)
- Quantity calculation based on percentage risk
---
## 8. Order Management and Timeout
- Close pending orders after `maxPendingBars` bars
- Close open positions after `maxBarsOpen` bars
- Label management for open orders
---
## 9. Alert Conditions
- `bull_touch`: price inside maximum bullish volume zone
- `bear_touch`: price inside maximum bearish volume zone
- `bull_reject`: confirmation of bullish zone rejection
- `bear_reject`: confirmation of bearish zone rejection
- `new_bull`: new bullish block
- `new_bear`: new bearish block
---
## 10. Level Calculation
- Swing levels based on selected timeframe (`SelectPeriod`)
- `xHigh` and `xLow` for S1 and R1 calculation
- Levels plotted on chart
---
## 11. Take Profit / Stop Loss
- Extended horizontal lines (`extendBars`) to visualize TP and SL
- Customizable colors (`tpColor`, `slColor`)
---
## 12. Notes
- Complete script based on Pine Script v5
- Advanced graphical management with boxes, lines, labels
- Dynamically displays volumes and Order Blocks
- Integrated internal screener
---
### End of Documentation

Camarilla Pivots + 20 EMA StrategyThis is an intraday volatility and trend-following system for commodities like Natural Gas, combining dynamic pivot levels (Camarilla) with a trend filter (20-period EMA) to improve risk-reward and reduce false breakouts.
Core Components
1. Camarilla Pivots:
These are special support and resistance levels (H3, H4, L3, L4) calculated each day based on the previous day's high, low, and close.
The pivots adapt to daily volatility, giving more relevant breakout and bounce zones than static lines.
H4: Aggressive resistance (used for breakout LONG entry)
H3: Moderate resistance/support (used for bounce or stoploss)
L4: Aggressive support (used for breakout SHORT entry)
L3: Moderate support/resistance (used for bounce or stoploss)
2. 20 EMA (Exponential Moving Average):
Plotted on the 30-minute chart, this acts as a trend filter.
If the price is above 20 EMA: Only look for long trades (bullish bias).
If below 20 EMA: Only look for short trades (bearish bias).
How the Strategy Works
Setup (30-Min Chart):
Camarilla pivots for the day are drawn on the chart.
20 EMA is also plotted.
Trade Filter:
Bullish: Trade ONLY if price is above 20 EMA.
Bearish: Trade ONLY if price is below 20 EMA.
Entry:
LONG: Enter when price breaks and closes above the H4 pivot AND is above 20 EMA.
SHORT: Enter when price breaks and closes below the L4 pivot AND is below 20 EMA.
Stop Loss:
LONG: Place stoploss at H3 (the next lower Camarilla resistance).
SHORT: Place stoploss at L3 (the next higher Camarilla support).
Target:
Always set a profit target at 2x the distance (risk) between entry and stoploss (strict R:R 2).
For example, if your entry is at H4 and stoploss at H3, your target is entry + 2*(entry - stoploss).
Alerts & Visuals:
The strategy plots entry arrows, stoploss and target lines for immediate visual reference.
Alerts trigger on breakout signals so you never miss a trade.
Why This Works Well for Natural Gas
Adapts to volatility: The pivots change daily, handling wide-ranging and choppy price moves better than fixed breakouts.
Trend filter: EMA prevents counter-trend whipsaws, only trades with market momentum.
Risk control: Every trade must meet strict risk-reward criteria, so losses are contained and winners can outweigh losers.

Consolidated 9-Indicator Buy/Sell Zones & TriggersALL important inductors combined for long term position holders and short term guys...use it to enter trade and exit ...backgroud colour will give you the indication of the market mood..

MTF FVG Confluence v6 — JSON Alerts via alert()This strategy combines multi-timeframe confluence with candlestick analysis and fair value gaps (FVGs) to generate structured long/short entries. It aligns Daily and 4H EMA trends with 1H MACD momentum, then confirms with engulfing candles and FVG zones for precision entries. Risk management is built-in, featuring stop-loss, 3R take-profit targets, and optional break-even logic, with dynamic JSON alerts for webhook automation.
Categories:
Candlestick analysis
Chart patterns
Cycles

Liquidity Sweep Breakout - LSBLiquidity Sweep Breakout - LSB
A professional session-based breakout system designed for OANDA:USDJPY and other JPY pairs.
Not guesswork, but precision - built on detailed observation of institutional moves to capture clear trade direction daily.
Master the Market’s Daily Bank Flow.
---
Strategy Detail:
I discovered this strategy after carefully studying how Japanese banks influence the forex market during their daily settlement period. Banks are some of the biggest players in the financial world, and when they adjust or settle their accounts in the morning, it often creates a push in the market. From years of observation, I noticed a consistent pattern, once banks finish their settlements, the market usually continues moving in the same direction that was formed right after those actions. This daily banking flow often sets the tone for the entire trading session, especially for JPY pairs like USDJPY.
To capture this move, I built the indicator so that it follows the bank-driven trend with clear rules for entries, stop-loss (SL), and take-profit (TP). The system is designed with professional risk management in mind. By default, it assumes a $10,000 account size, risks only 1% of that balance per trade, and targets a 1:1.5 reward-to-risk ratio. This means for every $100 risked, the potential profit is $150. Such controlled risk makes the system safer and more sustainable for long-term traders. At the same time, users are not limited to this setup, they can adjust the account balance in the settings, and the indicator will automatically recalculate the lot size and risk levels based on their own capital. This ensures the strategy works for small accounts and larger accounts alike.
🌍 Why It Works
Fundamentally driven: Based on **daily Japanese banking settlement flows**.
Session-specific precision: Targets the exact window when USDJPY liquidity reshapes.
Risk-managed: Always calculates lot size based on account and risk preferences.
Automatable: With webhook + MT5 EA, it can be fully hands-free.
---
✅ Recommended
Pair: USDJPY (best observed behavior).
Timeframe: 3-Minute chart.
Platform: TradingView Premium (for webhooks).
Execution: MT5 via EA.
---
🔎 Strategy Concept
The Tokyo Magic Breakout (TMB) is built on years of session observation and the unique daily rhythm of the Japanese banking system.
Every morning between 5:50 AM – 6:10 AM PKT (09:50 – 10:10 JST), Japanese banks perform daily reconciliation and settlement. This often sets the tone for the USDJPY direction of the day.
This strategy isolates that critical moment of liquidity adjustment and waits for a clean breakout confirmation. Instead of chasing noise, it executes only when price action is aligned with the Tokyo market’s hidden flows.
---
🕒 Timing Logic
Session Start: 5:00 AM PKT (Tokyo market open range).
Magic Candle: The 5:54 AM PKT candle is marked as the reference “breakout selector.”
Checkpoints: First confirmation at 6:30 AM PKT, then every 15 minutes until 8:30 AM PKT.
* If price stays inside the magic range → wait.
* If a breakout happens but the candle wick touches the range → wait for the next checkpoint.
* If by 8:30 AM PKT no clean breakout occurs → the day is marked as No Trade Day (NTD).
👉 Recommended timeframe: 3-Minute chart (3M) for precise signals.
---
📈 Trade Execution
Entry: Clean break above/below the magic candle’s range.
Stop-Loss: Opposite side of the Tokyo session high/low.
Take-Profit: Calculated by Reward\:Risk ratio (default 1.5:1).
Lot Size: Auto-calculated based on your risk model:
* Fixed Dollar
* % of Equity
* Conservative (minimum of both).
Visuals include:
✅ Entry/SL/TP lines
✅ Shaded risk (red) and reward (green) zones
✅ Trade labels (Buy/Sell with lot size & levels)
✅ TP/SL hit markers
---
🔔 Alerts & Automation (AutoTMB)
This strategy is fully automation-ready with EA + MT5:
1. Enable alerts in TMB settings.
2. Insert your PineConnector License Key.
3. Configure your risk management preferences.
4. Create a TradingView alert → in the message box simply type:
Pine Script®
{{alert_message}}
and set the EA webhook.
Now, every breakout trade (with exact entry, SL, TP, and lot size) is sent instantly.
👉 On your MT5:
* Install the EA.
* Use the same license key.
* Run it on a VPS or local MT5 terminal.
You now have a hands-free trading system: AutoTMB.

Imbalance RSI Divergence Strategy# Imbalance RSI Divergence Strategy - User Guide
## What is This Strategy?
This strategy identifies **imbalance** zones in the market and combines them with **RSI divergence** to generate trading signals. It aims to capitalize on price gaps left by institutional investors and large volume movements.
### Main Settings
- **RSI Period (14)**: Period used for RSI calculation. Lower values = more sensitive, higher values = more stable signals.
- **ATR Period (10)**: Period for volatility measurement using Average True Range.
- **ATR Stop Loss Multiplier (2.0)**: How many ATR units to use for stop loss calculation.
- **Risk:Reward Ratio (4.0)**: Risk-reward ratio. 2.0 = 2 units of reward for 1 unit of risk.
- **Use RSI Divergence Filter (true)**: Enables/disables the RSI divergence filter.
### Imbalance Filters
- **Minimum Imbalance Size (ATR) (0.3)**: Minimum imbalance size in ATR units to filter out small imbalances.
- **Enable Lookback Limit (false)**: Activates historical lookback limitations.
- **Maximum Lookback Bars (300)**: Maximum number of bars to look back.
### Visual Settings
- **Show Imbalance Size**: Displays imbalance size in ATR units.
- **Show RSI Divergence Lines**: Shows/hides divergence lines.
- **Divergence Line Colors**: Colors for bullish/bearish divergence lines.
### Volatility-Based Adjustments
- **Low volatility markets**:
- Minimum Imbalance Size: 0.2-0.4 ATR
- ATR Stop Loss Multiplier: 1.5-2.0
- **High volatility markets**:
- Minimum Imbalance Size: 0.5-1.0 ATR
- ATR Stop Loss Multiplier: 2.5-3.5
### Risk Tolerance
- **Conservative approach**:
- Risk:Reward Ratio: 2.0-3.0
- RSI Divergence Filter: Enabled
- Minimum Imbalance Size: Higher (0.5+ ATR)
- **Aggressive approach**:
- Risk:Reward Ratio: 4.0-6.0
- Minimum Imbalance Size: Lower (0.2-0.3 ATR)
###Market Conditions
- **Trending markets**: Higher RSI Period (21-28)
- **Sideways markets**: Lower RSI Period (10-14)
- **Volatile markets**: Higher ATR Multiplier
## Recommended Testing Procedure
1. **Start with default settings** and backtest on 3-6 months of historical data
2. **Adjust RSI Period** to see which value produces better results
3. **Optimize ATR Multiplier** for stop loss levels
4. **Test different Risk:Reward ratios** comparatively
5. **Fine-tune Minimum Imbalance Size** to improve signal quality
## Important Considerations
- **False positive signals**: Imbalances may be less reliable during low volatility periods
- **Market openings**: First hours often produce more imbalances but can be riskier
- **News events**: Consider disabling strategy during major news releases
- **Backtesting**: Test across different market conditions (trending, sideways, volatile)
## Recommended Settings for Beginners
**Safe settings for new users:**
- RSI Period: 14
- ATR Period: 14
- ATR Stop Loss Multiplier: 2.5
- Risk:Reward Ratio: 3.0
- Minimum Imbalance Size: 0.5 ATR
- RSI Divergence Filter: Enabled
## Advanced Tips
### Signal Quality Improvement
- **Combine with market structure**: Look for imbalances near key support/resistance levels
- **Volume confirmation**: Higher volume during imbalance formation increases reliability
- **Multiple timeframe analysis**: Confirm signals on higher timeframes
### Risk Management
- **Position sizing**: Never risk more than 1-2% of account per trade
- **Maximum drawdown**: Set overall stop loss for the strategy
- **Market hours**: Consider avoiding low liquidity periods
### Performance Monitoring
- **Win rate**: Track percentage of profitable trades
- **Average R:R**: Monitor actual risk-reward achieved vs. target
- **Maximum consecutive losses**: Set alerts for strategy review
This strategy works best when combined with proper risk management and market analysis. Always backtest thoroughly before using real money and adjust parameters based on your specific market and trading style.

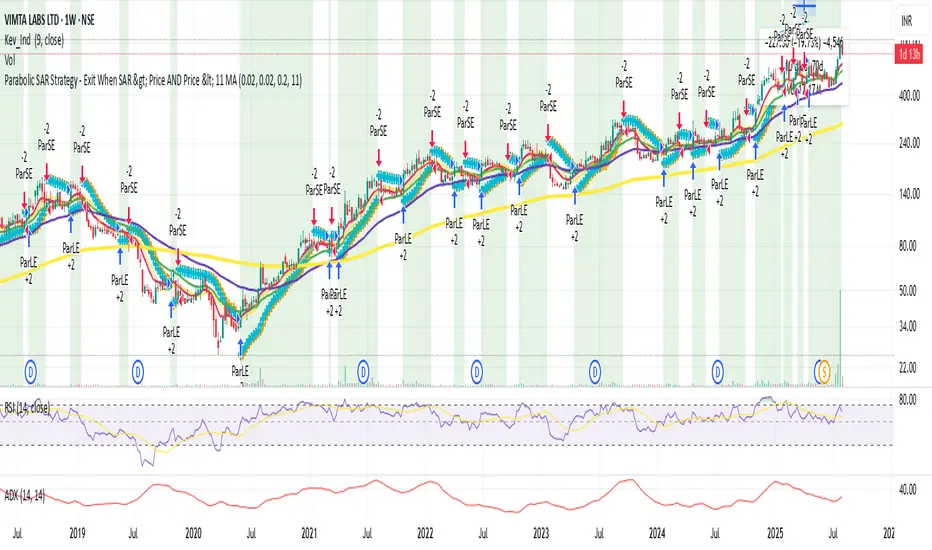
Parabolic SAR with Early Buy & MA-Based Exit Strategy📝 Strategy Description (Max SEO Impact)
This advanced Parabolic SAR-based trading strategy is designed to capture early trend reversals and exit intelligently using a dynamic moving average filter. It enters long trades when a PSAR reversal occurs, and exits only when the PSAR moves above price and the price falls below the 11-period SMA, helping avoid premature exits during volatile swings.
📌 Features:
• Custom Parabolic SAR calculation for refined trend tracking
• Background highlights during buy zones (SAR below price)
• Exit signals only when trend weakens (PSAR above + price under SMA)
• Red flag plotted on chart at exit bars for clear visual identification
• Works on all timeframes and instruments
Ideal for swing traders, trend followers, and strategy testers looking for smart PSAR-based entries with smoother exits.

Dubic EMA StrategyThe Dubic EMA Strategy is a trend-following and volatility-aware strategy that combines dual EMA filters with intelligent range and noise detection to provide clean, actionable entries. It's designed to avoid choppy markets, enhance trade precision, and adapt to different market conditions.
✅ Key Features:
Dual EMA Filter: Enters long when price is above both EMA High & EMA Low, and short when below both.
Range Filter: Avoids entries during tight consolidations or sideways markets.
Volatility Filter: Prevents trading in low-ATR conditions.
Dynamic Risk Management:
ATR-based or fixed % Stop Loss and Take Profit.
Optional Parabolic SAR trailing stop.
One Trade per Trend: Prevents re-entry until trend direction changes.
Unbroken Range Visualization: Detects and displays consolidation zones that can lead to breakouts.
Alerts & Labels: Clean BUY/SELL signals with alerts and chart labels.
🧩 Customization Options:
Adjustable EMA length
Toggle between ATR or % based SL/TP
Volatility threshold
Range detection sensitivity
Enable/disable SAR trailing stop
This strategy works best on trending assets and timeframes with volatility (e.g., crypto, forex, indices). Suitable for both manual trading and automation.
🛠️ Built for clarity, control, and precision.
📈 Backtest, optimize, and deploy with confidence.
