TrendLine ScythesTrendline Scythes is a script designed to automatically detect and draw special curved trendlines, resembling scythes or blades, based on pivotal points in price action. These trendlines adapt to the volatility of the market, providing a unique perspective on trend dynamics.
🔲 Methodology
Traditional trendlines connect consecutive pivot points on a price chart, providing a linear representation of trend direction. However, this script employs a distinctive methodology by automatically detecting price pivots and then calculating special curved trendlines based on the Average True Range (ATR) of the price. This introduces a curvature to the trendlines, resembling scythes, offering a unique way to interpret market trends.
🔲 Auto Breakout and Target Detection
Trendline Scythes includes features for automatic breakout detection, signaling potential trend changes. Additionally, the script assists in target detection, helping traders set realistic and data-driven profit-taking levels based on market volatility and user adjustment.
🔲 Utility
Trend Confirmation - Use Trendline Scythes to confirm existing trends by observing how price interacts with the curved trendlines.
Breakout Signals - Auto-detection of breakouts adds a proactive element to your trading strategy, helping you stay ahead of potential trend reversals.
Target Setting - Utilize the script to set profit-taking targets based on volatility, aligning with the current market conditions.
🔲 Settings
Pivot Length - Swing detection length
Scythe Length - Adjusts the length of the scythes blade
Sensitivity - Controls how restrained the target calculation is, higher values will result in tighter targets.
🔲 Alerts
Breakout
Breakdown
Target Reached
Target Invalidated
As well as the option to trigger 'any alert' call.
Trendline Scythes is a versatile tool combining the benefits of traditional trendlines with the dynamic adaptability of curved lines for a unique approach to trend analysis.
Wyszukaj w skryptach "trend"

Trendline Breakouts With Volume Strength [TradeDots]Trendline Breakouts With Volume Strength is an innovative indicator designed to identify potential market turning points using pivot-based trendline detection and volume confirmation. By merging dynamic trendline analysis with multi-tiered volume filters, this tool helps traders quickly spot breakouts or breakdowns that may signal significant shifts in price action.
📝 HOW IT WORKS
1. Pivot-Based Trendline Detection
The script automatically scans for recent pivot highs and lows over a user-defined lookback period.
When it finds higher pivot lows, it plots green uptrend lines; when it finds lower pivot highs, it plots red downtrend lines.
These dynamic lines update as new pivots form, providing continuously refreshed trend guidance.
2. Volume Ratio Analysis
A moving average of volume is compared against the current bar’s volume to calculate a ratio (e.g., 1.5×, 2×).
Higher ratios suggest above-average volume, often interpreted as stronger participation.
The script applies color-coded cues to highlight the intensity of volume surges.
3. Breakout & Breakdown Detection
Each trendline is monitored for a defined “break threshold,” which helps avoid minor penetrations that can trigger premature signals.
When price closes beyond a threshold below an uptrend line, the indicator labels it a “BREAKDOWN.” If it closes above a threshold on a downtrend line, it labels it a “BREAKOUT.”
Volume surges accompanying these breaks are highlighted with contextual emojis and distinct color gradients for quick visual reference.
4. Trend Direction Table
A small on-chart table provides a snapshot of the current market trend—Uptrend, Downtrend, or Sideways—based on a simple moving average slope and the number of active uptrend or downtrend lines.
This table also displays quick stats on how many lines are actively tracked, helping traders assess the broader market posture at a glance.
🛠️ HOW TO USE
1. Choose a Timeframe
This script works on multiple timeframes. Intraday traders can monitor minute or hourly charts for frequent pivot updates, while swing and position traders may prefer daily or weekly intervals to reduce noise.
2. Observe Trendlines & Labels
Watch for newly drawn green/red lines connecting pivots.
When you see a “BREAKOUT” or “BREAKDOWN” label, confirm whether volume was abnormally high based on the ratio or color-coded bars.
3. Consult the Trend Table
Use the table in the bottom-right corner to quickly check if the market is trending or range-bound.
Look at the count of active uptrend vs. downtrend lines to gauge broader sentiment.
4. Employ Additional Analysis
Combine these signals with other tools (e.g., candlestick patterns, oscillators, or fundamental analysis).
Validate potential breakouts using standard techniques like retests or support/resistance checks.
❗️LIMITATIONS
Delayed Pivots: Trendlines only adjust once new pivot highs or lows form, which can introduce a slight lag in highly volatile environments.
Choppy Markets: Rapid, back-and-forth price moves may produce conflicting trendline signals and frequent breakouts/breakdowns.
Volume Data Reliability: Gaps in volume data or unusual market conditions (holidays, low-liquidity sessions) can skew ratio readings.
RISK DISCLAIMER
Trading any financial instrument involves substantial risk, and this indicator does not guarantee profits or prevent losses. All signals and visual cues are for educational and informational purposes only; past performance does not assure future outcomes. You retain full responsibility for your trading decisions, including proper risk management, position sizing, and the use of additional confirmation methods. Always consider the possibility of losing some or all of your original investment.

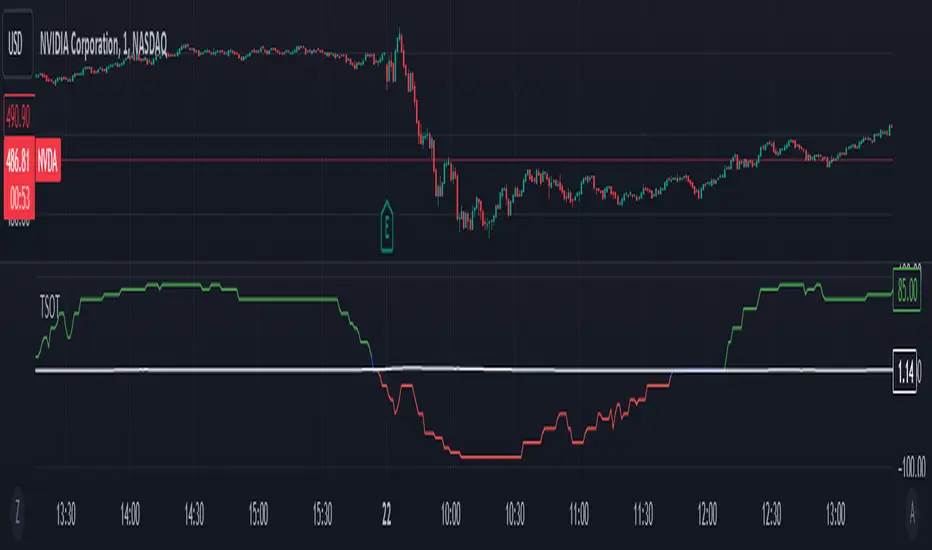
Trend Strength Over TimeThe script serves as an indicator designed to assess and visualize trend strength and Volume strength over time. It employs a variety of calculations and conditions to offer insights into both bullish and bearish market trends. Let's explore the key conceptual elements of the code.
Trend Strength Conditions:
The script defines conditions to assess trend strength based on a comparison between each calculated percentile value and the highest high (bullish) or lowest low (bearish). Separate conditions are established for each percentile length, allowing for a nuanced understanding of trend dynamics across different timeframes.
Counting Bull and Bear Trends:
To quantify the strength of bullish and bearish trends, the script maintains counts for the number of conditions that are true for each. This count-based approach provides a quantitative measure of trend strength.
Weak Bull and Bear Counts:
Recognizing that trends are not always clear-cut, the script introduces the concept of weak trends. It counts instances where the percentiles fall between the highest high and lowest low, indicating a potential weakening of the prevailing trend.
Bull and Bear Strength:
Bull and bear strengths are calculated based on the counts, with adjustments made for weak trends. This step provides a more nuanced and comprehensive assessment of trend strength by considering both strong and weak signals.
Current Trend Value:
The culmination of these calculations is the determination of the current trend value. This value represents the balance between bullish and bearish forces, offering a dynamic indicator of the market's prevailing sentiment.
Volume Strength Calculation:
In addition to price-based indicators, the script incorporates volume strength as a crucial element. This is calculated using the simple moving averages (SMAs) of volume over different lengths, normalized relative to the SMA over a length of 144. Volume strength adds a layer of confirmation or divergence to the price-based trend analysis.
Color Change:
To facilitate quick and intuitive interpretation, the script dynamically changes the color of the plotted line on the chart based on the current trend value. Green indicates a bullish trend, red indicates a bearish trend, and blue suggests a neutral or indecisive market.
Plotting:
The script uses the plot function to visually present the calculated trend strength and volume strength on the chart. This visual representation aids traders in making informed decisions based on the identified trends and their strengths.
Volume Strength: A Detailed Explanation
In the context of the provided script, volume strength is a critical component used to assess the strength of a market trend. It provides insights into the level of participation and commitment of market participants, offering a complementary perspective to traditional price-based indicators. Let's delve into the concept and practical applications of volume strength.
Calculation of Volume Strength:
The script calculates volume strength by considering the simple moving averages (SMAs) of volume over different time periods (13, 21, 34, 55, 89). These individual SMAs are then normalized relative to the SMA over a more extended period of 144. The weights assigned to each SMA in the calculation are defined in the variable VCF (Volume Correction Factor).
Calculation of Volume Strength with Weights: The weights assigned to each SMA in this calculation are crucial for emphasizing the significance of shorter-term volume movements relative to a longer-term baseline.
Interpretation of Weights:
The choice of weights reflects the relative importance of shorter-term volume movements compared to longer-term trends. In this script, shorter-term SMAs (13, 21, 34, 55, 89) are assigned decreasing weights, while the longer-term SMA (144) serves as the baseline.
Shorter-term SMAs with higher weights may have a more immediate impact on the volume strength calculation. This implies that recent changes in volume carry more weight in assessing the current market conditions.
The decreasing weights for shorter-term SMAs might indicate that, as the timeframe lengthens, the significance of recent volume movements diminishes in relation to the longer-term trend. This approach allows for a focus on both short-term volatility and longer-term stability in volume patterns.
The purpose of normalization is to emphasize the current volume's significance in comparison to its historical context. This can help identify abnormal volume spikes or sustained increases in trading activity, which may indicate the strength or weakness of a trend.
Interpretation and Practical Use:
Confirmation of Trend:
Rising volume during an uptrend can validate the strength of the upward movement, suggesting that a significant number of market participants are actively buying. Conversely, decreasing volume during an uptrend might indicate weakening interest and a potential reversal.
In a downtrend, increasing volume on downward price movements reinforces the strength of the trend. A decrease in volume during a downtrend may suggest a potential weakening or exhaustion of the downward momentum.
Divergence Analysis:
Divergence occurs when there is a disagreement between the price movement and the corresponding volume. For example, if prices are rising but volume is declining, it could signal a lack of conviction in the upward movement, and a reversal might be imminent.
Conversely, if prices are falling, but volume is decreasing as well, it might suggest that the downward momentum is losing steam, and a potential reversal or consolidation could be on the horizon.
In conclusion, volume strength analysis provides traders with a powerful tool to gauge the conviction behind price movements. By incorporating volume data into the technical analysis, one can make more informed decisions, enhance trend identification, and improve risk management strategies.
Trend Exhaustion IndicatorThe Trend Exhaustion Indicator is a custom indicator of mine that is loosely based on the Trend Exhaustion Index created by Clifford L. Creel Ph.D. (Stocks & Commodities V. 9:1 (9-11))
This indicator will let you know the trend reversal points and when it falls below the signal line then the trend is ending vice versa. Buy when the indicator crosses above the signal line and sell when it falls below the signal line.
Let me know if you would like to see me write any other scripts!

Trend FriendTrend Friend — What it is and how to use it
I built Trend Friend to stop redrawing the same trendlines all day. It automatically connects confirmed swing points (fractals) and keeps the most relevant lines in front of you. The goal: give you clean, actionable structure without the guesswork.
What it does (in plain English)
Finds swing highs/lows using a Fractal Period you choose.
Draws auto-trendlines between the two most recent confirmed highs and the two most recent confirmed lows.
Colours by intent:
Lines drawn from highs (potential resistance / bearish) = Red
Lines drawn from lows (potential support / bullish) = Green
Keeps the chart tidy: The newest lines are styled as “recent,” older lines are dimmed as “historical,” and it prunes anything beyond your chosen limit.
Optional crosses & alerts: You can highlight when price closes across the most recent line and set alerts for new lines formed and upper/lower line crosses.
Structure labels: It tags HH, LH, HL, LL at the swing points, so you can quickly read trend/rotation.
How it works (under the hood)
A “fractal” here is a confirmed pivot: the highest high (or lowest low) with n bars on each side. That means pivots only confirm after n bars, so signals are cleaner and less noisy.
When a new pivot prints, the script connects it to the prior pivot of the same type (high→high, low→low). That gives you one “bearish” line from highs and one “bullish” line from lows.
The newest line is marked as recent (brighter), and the previous recent line becomes historical (dimmed). You can keep as many pairs as you want, but I usually keep it tight.
Inputs you’ll actually use
Fractal Period (n): this is the big one. It controls how swingy/strict the pivots are.
Lower n → more swings, more lines (faster, noisier)
Higher n → fewer swings, cleaner lines (slower, swing-trade friendly)
Max pair of lines: how many pairs (up+down) to keep on the chart. 1–3 is a sweet spot.
Extend: extend lines Right (my default) or Both ways if you like the context.
Line widths & colours: recent vs. historical are separate so you can make the active lines pop.
Show crosses: toggle the X markers when price crosses a line. I turn this on when I’m actively hunting breakouts/retests.
Reading the chart
Red lines (from highs): I treat these as potential resistance. A clean break + hold above a red line often flips me from “fade” to “follow.”
Green lines (from lows): Potential support. Same idea in reverse: break + hold below and I stop buying dips until I see structure reclaim.
HH / LH / HL / LL dots: quick read on structure.
HH/HL bias = uptrend continuation potential
LH/LL bias = downtrend continuation potential
Mixed prints = rotation/chop—tighten risk or wait for clarity.
My H1 guidance (fine-tuning Fractal Period)
If you’re mainly on H1 (my use case), tune like this:
Fast / aggressive: n = 6–8 (lots of signals, good for momentum days; more chop risk)
Balanced (recommended): n = 9–12 (keeps lines meaningful but responsive)
Slow / swing focus: n = 13–21 (filters noise; better for trend days and higher-TF confluence)
Rule of thumb: if you’re getting too many touches and whipsaws, increase n. If you’re late to obvious breaks, decrease n.
How I trade it (example workflow)
Pick your n for the session (H1: start at 9–12).
Mark the recent red & green lines. That’s your immediate structure.
Look for interaction:
Rejections from a line = fade potential back into the range.
Break + close across a line = watch the retest for continuation.
Confirm with context: session bias, HTF structure, and your own tools (VWAP, RSI, volume, FVG/OB, etc.).
Plan the trade: enter on retest or reclaim, stop beyond the line/last swing, target the opposite side or next structure.
Alerts (set and forget)
“New trendline formed” — fires when a new high/low pivot confirms and a fresh line is drawn.
“Upper/lower trendline crossed” — fires when price crosses the most recent red/green line.
Use these to track structure shifts without staring at the screen.
Good to know (honest limitations)
Confirmation lag: pivots need n bars on both sides, so signals arrive after the swing confirms. That’s by design—less noise, fewer fake lines.
Lines update as structure evolves: when a new pivot forms, the previous “recent” line becomes “historical,” and older ones can be removed based on your max setting.
Not an auto trendline crystal ball: it won’t predict which line holds or breaks—it just keeps the most relevant structure clean and up to date.
Final notes
Works on any timeframe; I built it with H1 in mind and scale to H4/D1 by increasing n.
Pairs nicely with session tools and VWAP for intraday, or with supply/demand / FVGs for swing planning.
Risk first: lines are structure, not guarantees. Manage position size and stops as usual.
Not financial advice. Trade your plan. Stay nimble.

Trendlines Oscillator [LuxAlgo]The Trendlines Oscillator helps traders identify trends and momentum based on the normalized distances between the current price and the most recently detected bullish and bearish trend lines.
The indicator features bullish and bearish momentum, a signal line with crossings, and multiple smoothing options.
🔶 USAGE
The indicator displays three lines: two for momentum and one for the signal. When one of the momentum lines (bullish or bearish) crosses the signal line, the tool displays a dot to indicate which momentum is gaining strength.
As a general rule, when the green bullish momentum line is above the red bearish momentum line, it indicates buyer strength. This means that the actual prices are farther from the support trend lines than the resistance trend lines. The opposite is true for seller strength.
To calculate bullish momentum, the tool first identifies bullish trend lines acting as support below the price. Then, it measures the delta between the price and those trend lines and normalizes the reading into the displayed momentum values.
The same process is used for bearish momentum, but with bearish trendlines acting as resistance above the price.
🔹 Length & Memory
Modifying the Length and Memory values will cause the tool to display different momentum values.
Traders can adjust the length to detect larger trendlines and adjust the memory to indicate how many trendlines the tool should consider.
As the chart above shows, smaller values make the tool more responsive, while larger values are useful for detecting larger trends.
🔹 Smoothing
By default, the data is not smoothed, and the signal uses a triangular moving average with a length of 10. Traders can smooth both the data and the signal line.
Traders can choose from up to ten different methods, or none. Some examples are shown on the chart above.
🔶 DETAILS
The steps for the calculations are as follows:
1. Gather the pivots, highs, and lows.
ph = fixnan(ta.pivothigh(lengthInput, lengthInput))
pl = fixnan(ta.pivotlow(lengthInput, lengthInput))
2. Calculate the slope and y-intercept for each trendline between contiguous lower highs (resistance) or higher lows (support).
if ph < ph
slope = (ph - ph )/(n-lengthInput - phx1)
res.unshift(l.new(ph - slope * phx1, slope))
if pl > pl
slope = (pl - pl )/(n-lengthInput - plx1)
sup.unshift(l.new(pl - slope * plx1, slope))
3. Calculate the value of each trendline on the current bar, then calculate the difference with the current price (delta). To calculate the relative sum of deltas, only consider trendlines below the price for support or above the price for resistance.
method get_point(l id, x)=>
id.slope * x + id.intercept
for element in sup
point = element.get_point(n)
if sourceInput > point
sup_sum += sourceInput - point
sup_den += math.abs(sourceInput - point)
for element in res
point = element.get_point(n)
if sourceInput < point
res_sum += point - sourceInput
res_den += math.abs(point - sourceInput)
4. Normalize the value from 0 to 100 by taking the sum of the relative values of the deltas divided by the sum of the absolute values of the deltas.
float supportLine = sup_sum / sup_den * 100
float resistanceLine = res_sum / res_den * 100
5. Smooth both values, then calculate the signal line as the difference between them.
float smoothSupport = smooth(supportLine,dataSmoothingInput,dataSmoothingLengthInput)
float smoothResistance = smooth(resistanceLine,dataSmoothingInput,dataSmoothingLengthInput)
float signal = math.abs(smoothSupport - smoothResistance)
float signalLine = smooth(signal,smoothingInput,smoothingLengthInput)
6. Calculate the crossing signals against the signal line, using only the first signal from each series of bullish or bearish crossings.
bullSignal = smoothSupport > signalLine and smoothSupport < signalLine
bearSignal = smoothResistance > signalLine and smoothResistance < signalLine
lastSignal := bullSignal and lastSignal == BEAR ? BULL : bearSignal and lastSignal == BULL ? BEAR : lastSignal
firstBull = ta.change(lastSignal) > 0
firstBear = ta.change(lastSignal) < 0
🔶 SETTINGS
Length: The size of the market structure used for trendline detection.
Memory: The number of trendlines used in calculations.
Source: The source for the calculations is closing prices by default.
🔹 Smoothing
Data Smoothing: Choose the smoothing method and length
Signal Smoothing: Choose the smoothing method and length

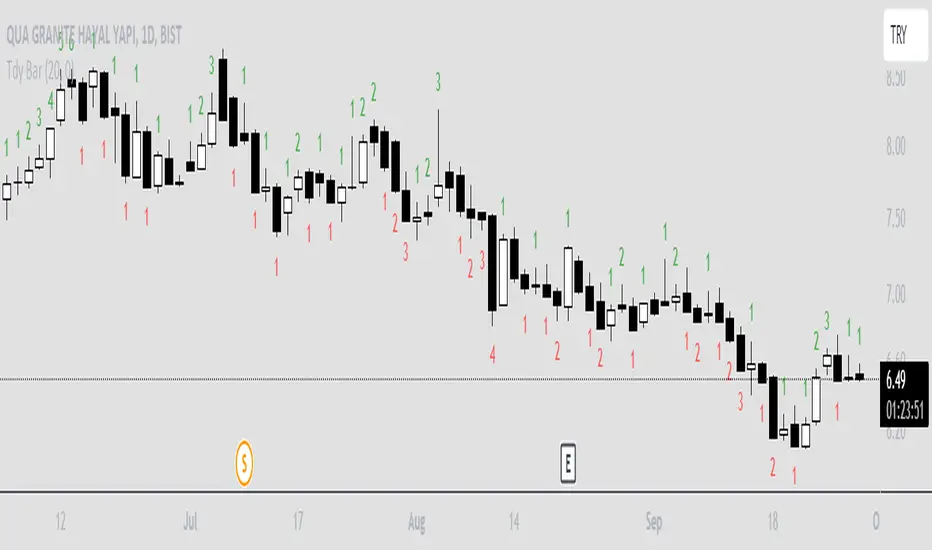
Trendy Bars CounterTrendy Bars Counter indicates the number of bars in trend.
Green: If trend is up
Red: If trend is down
Gray: If there is no trend
Minimum Number Of Trendy Bars: if trendy bars count is greater than this value trendy bars count will be plotted
Trend Line Trendlines are easily recognizable lines that traders draw on charts to connect a series of prices together or show some data's best fit. The resulting line is then used to give the trader a good idea of the direction in which an investment's value might move.
A trendline is a line drawn over pivot highs or under pivot lows to show the prevailing direction of price. Trendlines are a visual representation of support and resistance in any time frame. They show direction and speed of price, and also describe patterns during periods of price contraction.
Key Takeaways
Trendlines indicate the best fit of some data using a single line.
A single trendline can be applied to a chart to give a clearer picture of the trend.
The time period being analyzed and the exact points used to create a trendline vary from trader to trader.
The trendline is among the most important tools used by technical analysts. Instead of looking at past business performance or other fundamentals, technical analysts look for trends in price action. A trendline helps technical analysts determine the current direction in market prices. Technical analysts believe the trend is your friend, and identifying this trend is the first step in the process of making a good trade.
To create a trendline, an analyst must have at least two points on a price chart. Some analysts like to use different time frames such as one minute or five minutes. Others look at daily charts or weekly charts. Some analysts put aside time altogether, choosing to view trends based on tick intervals rather than intervals of time. What makes trendlines so universal in usage and appeal is they can be used to help identify trends regardless of the time period, time frame or interval used.

Trend Friendly RSITrend Friendly RSI
Unlike the standard RSI, "Trend Friendly RSI" adapts to the trend. RSI and other momentum-based oscillators cannot give a buy signal in uptrends and a sell signal in downtrends because they do not take into account the momentum of the trend and behave as if the price is in a constant sideways trend. "Trend Friendly RSI", on the other hand, takes into account the momentum of the trend of your chosen length and subtracts it from the current momentum, thus giving more realistic buy and sell signals.
use it to identify your long-term investments and trading entry points for hodl. It would be wise to use this indicator for assets that you have done fundamental analysis and are sure of the trend direction. it doesn't know what the price will do, it just shows the points that are suitable for you.
remember this indicator will fail in horizontal trends.

Trend Fib Zone Bounce (TFZB) [KedArc Quant]Description:
Trend Fib Zone Bounce (TFZB) trades with the latest confirmed Supply/Demand zone using a single, configurable Fib pullback (0.3/0.5/0.6). Trade only in the direction of the most recent zone and use a single, configurable fib level for pullback entries.
• Detects market structure via confirmed swing highs/lows using a rolling window.
• Draws Supply/Demand zones (bearish/bullish rectangles) from the latest MSS (CHOCH or BOS) event.
• Computes intra zone Fib guide rails and keeps them extended in real time.
• Triggers BUY only inside bullish zones and SELL only inside bearish zones when price touches the selected fib and closes back beyond it (bounce confirmation).
• Optional labels print BULL/BEAR + fib next to the triangle markers.
What it does
Finds structure using confirmed swing highs/lows (you choose the confirmation length).
Builds the latest zone (bullish = demand, bearish = supply) after a CHOCH/BOS event.
Draws intra-zone “guide rails” (Fib lines) and extends them live.
Signals only with the trend of that zone:
BUY inside a bullish zone when price tags the selected Fib and closes back above it.
SELL inside a bearish zone when price tags the selected Fib and closes back below it.
Optional labels print BULL/BEAR + Fib next to triangles for quick context
Why this is different
Most “zone + fib + signal” tools bolt together several indicators, or fire counter-trend signals because they don’t fully respect structure. TFZB is intentionally minimal:
Single bias source: the latest confirmed zone defines direction; nothing else overrides it.
Single entry rule: one Fib bounce (0.3/0.5/0.6 selectable) inside that zone—no counter-trend trades by design.
Clean visuals: you can show only the most recent zone, clamp overlap, and keep just the rails that matter.
Deterministic & transparent: every plot/label comes from the code you see—no external series or hidden smoothing
How it helps traders
Cuts decision noise: you always know the bias and the only entry that matters right now.
Forces discipline: if price isn’t inside the active zone, you don’t trade.
Adapts to volatility: pick 0.3 in strong trends, 0.5 as the default, 0.6 in chop.
Non-repainting zones: swings are confirmed after Structure Length bars, then used to build zones that extend forward (they don’t “teleport” later)
How it works (details)
*Structure confirmation
A swing high/low is only confirmed after Structure Length bars have elapsed; the dot is plotted back on the original bar using offset. Expect a confirmation delay of about Structure Length × timeframe.
*Zone creation
After a CHOCH/BOS (momentum shift / break of prior swing), TFZB draws the new Supply/Demand zone from the swing anchors and sets it active.
*Fib guide rails
Inside the active zone TFZB projects up to five Fib lines (defaults: 0.3 / 0.5 / 0.7) and extends them as time passes.
*Entry logic (with-trend only)
BUY: bar’s low ≤ fib and close > fib inside a bullish zone.
SELL: bar’s high ≥ fib and close < fib inside a bearish zone.
*Optionally restrict to one signal per zone to avoid over-trading.
(Optional) Aggressive confirm-bar entry
When do the swing dots print?
* The code confirms a swing only after `structureLen` bars have elapsed since that candidate high/low.
* On a 5-min chart with `structureLen = 10`, that’s about 50 minutes later.
* When the swing confirms, the script plots the dot back on the original bar (via `offset = -structureLen`). So you *see* the dot on the old bar, but it only appears on the chart once the confirming bar arrives.
> Practical takeaway: expect swing markers to appear roughly `structureLen × timeframe` later. Zones and signals are built from those confirmed swings.
Best timeframe for this Indicator
Use the timeframe that matches your holding period and the noise level of the instrument:
* Intraday :
* 5m or 15m are the sweet spots.
* Suggested `structureLen`:
* 5m: 10–14 (confirmation delay \~50–70 min)
* 15m: 8–10 (confirmation delay \~2–2.5 hours)
* Keep Entry Fib at 0.5 to start; try 0.3 in strong trends, 0.6 in chop.
* Tip: avoid the first 10–15 minutes after the open; let the initial volatility set the early structure.
* Swing/overnight:
* 1h or 4h.
* `structureLen`:
* 1h: 6–10 (6–10 hours confirmation)
* 4h: 5–8 (20–32 hours confirmation)
* 1m scalping: not recommended here—the confirmation lag relative to the noise makes zones less reliable.
Inputs (all groups)
Structure
• Show Swing Points (structureTog)
o Plots small dots on the bar where a swing point is confirmed (offset back by Structure Length).
• Structure Length (structureLen)
o Lookback used to confirm swing highs/lows and determine local structure. Higher = fewer, stronger swings; lower = more reactive.
Zones
• Show Last (zoneDispNum)
o Maximum number of zones kept on the chart when Display All Zones is off.
• Display All Zones (dispAll)
o If on, ignores Show Last and keeps all zones/levels.
• Zone Display (zoneFilter): Bullish Only / Bearish Only / Both
o Filters which zone types are drawn and eligible for signals.
• Clean Up Level Overlap (noOverlap)
o Prevents fib lines from overlapping when a new zone starts near the previous one (clamps line start/end times for readability).
Fib Levels
Each row controls whether a fib is drawn and how it looks:
• Toggle (f1Tog…f5Tog): Show/hide a given fib line.
• Level (f1Lvl…f5Lvl): Numeric ratio in . Defaults active: 0.3, 0.5, 0.7 (0 and 1 off by default).
• Line Style (f1Style…f5Style): Solid / Dashed / Dotted.
• Bull/Bear Colors (f#BullColor, f#BearColor): Per-fib color in bullish vs bearish zones.
Style
• Structure Color: Dot color for confirmed swing points.
• Bullish Zone Color / Bearish Zone Color: Rectangle fills (transparent by default).
Signals
• Entry Fib for Signals (entryFibSel): Choose 0.3, 0.5 (default), or 0.6 as the trigger line.
• Show Buy/Sell Signals (showSignals): Toggles triangle markers on/off.
• One Signal Per Zone (oneSignalPerZone): If on, suppresses additional entries within the same zone after the first trigger.
• Show Signal Text Labels (Bull/Bear + Fib) (showSignalLabels): Adds a small label next to each triangle showing zone bias and the fib used (e.g., BULL 0.5 or BEAR 0.3).
How TFZB decides signals
With trend only:
• BUY
1. Latest active zone is bullish.
2. Current bar’s close is inside the zone (between top and bottom).
3. The bar’s low ≤ selected fib and it closes > selected fib (bounce).
• SELL
1. Latest active zone is bearish.
2. Current bar’s close is inside the zone.
3. The bar’s high ≥ selected fib and it closes < selected fib.
Markers & labels
• BUY: triangle up below the bar; optional label “BULL 0.x” above it.
• SELL: triangle down above the bar; optional label “BEAR 0.x” below it.
Right-Panel Swing Log (Table)
What it is
A compact, auto-updating log of the most recent Swing High/Low events, printed in the top-right of the chart.
It helps you see when a pivot formed, when it was confirmed, and at what price—so you know the earliest bar a zone-based signal could have appeared.
Columns
Type – Swing High or Swing Low.
Date – Calendar date of the swing bar (follows the chart’s timezone).
Swing @ – Time of the original swing bar (where the dot is drawn).
Confirm @ – Time of the bar that confirmed that swing (≈ Structure Length × timeframe after the swing). This is also the earliest moment a new zone/entry can be considered.
Price – The swing price (high for SH, low for SL).
Why it’s useful
Clarity on repaint/confirmation: shows the natural delay between a swing forming and being usable—no guessing.
Planning & journaling: quick reference of today’s pivots and prices for notes/backtesting.
Scanning intraday: glance to see if you already have a confirmed zone (and therefore valid fib-bounce entries), or if you’re still waiting.
Context for signals: if a fib-bounce triangle appears before the time listed in Confirm @, it’s not a valid trade (you were too early).
Settings (Inputs → Logging)
Log swing times / Show table – turn the table on/off.
Rows to keep – how many recent entries to display.
Show labels on swing bar – optional tags on the chart (“Swing High 11:45”, “Confirm SH 14:15”) that match the table.
Recommended defaults
• Structure Length: 10–20 for intraday; 20–40 for swing.
• Entry Fib for Signals: 0.5 to start; try 0.3 in stronger trends and 0.6 in choppier markets.
• One Signal Per Zone: ON (prevents over trading).
• Zone Display: Both.
• Fib Lines: Keep 0.3/0.5/0.7 on; turn on 0 and 1 only if you need anchors.
Alerts
Two alert conditions are available:
• BUY signal – fires when a with trend bullish bounce at the selected fib occurs inside a bullish zone.
• SELL signal – fires when a with trend bearish bounce at the selected fib occurs inside a bearish zone.
Create alerts from the chart’s Alerts panel and select the desired condition. Use Once Per Bar Close to avoid intrabar flicker.
Notes & tips
• Swing dots are confirmed only after Structure Length bars, so they plot back in time; zones built from these confirmed swings do not repaint (though they extend as new bars form).
• If you don’t see a BUY where you expect one, check: (1) Is the active zone bullish? (2) Did the candle’s low actually pierce the selected fib and close above it? (3) Is One Signal Per Zone suppressing a second entry?
• You can hide visual clutter by reducing Show Last to 1–3 while keeping Display All Zones off.
Glossary
• CHOCH (Change of Character): A shift where price breaks beyond the last opposite swing while local momentum flips.
• BOS (Break of Structure): A cleaner break beyond the prior swing level in the current momentum direction.
• MSS: Either CHOCH or BOS – any event that spawns a new zone.
Extension ideas (optional)
• Add fib extensions (1.272 / 1.618) for target lines.
• Zone quality score using ATR normalization to filter weak impulses.
• HTF filter to only accept zones aligned with a higher timeframe trend.
⚠️ Disclaimer This script is provided for educational purposes only.
Past performance does not guarantee future results.
Trading involves risk, and users should exercise caution and use proper risk management when applying this strategy.

Trend CandlesTrend Candles
Overview
The Trend Candles indicator is a simple yet effective tool designed to help traders visually identify the prevailing market trend. By combining candle coloring with a trend-based Exponential Moving Average (EMA), it enhances chart readability and makes trend-following strategies easier to apply.
Concepts
Exponential Moving Average (EMA): The EMA is a moving average that places more weight on recent price data. It reacts faster to price changes compared to a Simple Moving Average (SMA), making it well-suited for trend detection.
Trend Determination:
- If the EMA is rising (current EMA > previous EMA), the market is considered bullish.
- If the EMA is falling (current EMA < previous EMA), the market is considered bearish.
- If the EMA is flat (no significant change), no trend color is applied.
Candle Coloring:
- Green candles = Uptrend
- Purple candles = Downtrend
- Default candles = Sideways/Flat EMA
Features
- Trend Visualization: Candles automatically change color based on EMA slope, making it easy to spot bullish and bearish phases.
- Customizable EMA Length: The trader can set the EMA period (default is 50), allowing flexibility for short-term or long-term trend analysis.
- Overlay EMA Line: An orange EMA line is plotted on the chart for additional confirmation of the trend.
- Clean & Minimalist: Focuses on trend clarity without cluttering the chart with unnecessary signals.
How to Use
1. Apply the indicator to your chart.
2. Adjust the EMA Length as per your trading style (shorter = faster signals, longer = smoother trend).
3. Follow the candle color:
- Green = Favor long entries.
- Purple = Favor short entries.
- No color = Stay cautious, as trend is unclear.
4. Use with other confirmation tools (support/resistance, volume, or oscillators).
5. Users are encouraged to experiment with different EMA lengths. The default length is 50, but you can explore other values based on your needs. In particular, try Fibonacci numbers such as 13, 21, 34, 55, 89, 144, and 233 to observe how trends behave differently.
Disclaimer
The information provided by the Trend Candles indicator is for educational purposes only. It should not be considered financial advice. Trading involves substantial risk, and past performance is not necessarily indicative of future results. Always do your own research and use risk management practices.

Trend Strength Index [Alpha Extract]The Trend Strength Index leverages Volume Weighted Moving Average (VWMA) and Average True Range (ATR) to quantify trend intensity in cryptocurrency markets, particularly Bitcoin. The combination of VWMA and ATR is particularly powerful because VWMA provides a more accurate representation of the market's true average price by weighting periods of higher trading volume more heavily—capturing genuine momentum driven by increased participation rather than treating all price action equally, which is crucial in volatile assets like Bitcoin where volume spikes often signal institutional interest or market shifts.
Meanwhile, ATR normalizes this measurement for volatility, ensuring that trend strength readings remain comparable across different market conditions; without ATR's adjustment, raw price deviations from the mean could appear artificially inflated during high-volatility periods (like during news events or liquidations) or understated in low-volatility sideways markets, leading to misleading signals. Together, they create a volatility-adjusted, volume-sensitive metric that reliably distinguishes between meaningful trend developments and noise.
This indicator measures the normalized distance between price and its volume-weighted mean, providing a clear visualization of trend strength while accounting for market volatility. It helps traders identify periods of strong directional movement versus consolidation, with color-coded gradients for intuitive interpretation.
🔶 CALCULATION
The indicator processes price data through these analytical stages:
Volume Weighted Moving Average: Computes a smoothed average weighted by trading volume
Volatility Normalization: Uses ATR to account for market volatility
Distance Measurement: Calculates absolute deviation between current price and VWMA
Strength Normalization: Divides price deviation by ATR for a volatility-adjusted metric
Formula:
VWMA = Volume-Weighted Moving Average of Close over specified length
ATR = Average True Range over specified length
Price Distance = |Close - VWMA|
Trend Strength = Price Distance / ATR
🔶 DETAILS Visual Features:
VWMA Line: Blue line overlay on the price chart representing the volume-weighted mean
Trend Strength Area: Histogram-style area plot with dynamic color gradient (red for weak trends, transitioning through orange and yellow to green for strong trends)
Threshold Line: Horizontal red line at the customizable Trend Enter level
Background Highlight: Subtle green background when trend strength exceeds the enter threshold for strong trend visualization
Alert System: Triggers notifications for strong trend detection
Interpretation:
0-Weak (Red): Minimal trend strength, potential consolidation or ranging market
Mid-Range (Orange/Yellow): Building momentum, watch for breakout potential
At/Above Enter Threshold (Green): Strong trend conditions, potential for continued directional moves
Threshold Crossing: Trend strength crossing above the enter level signals increasing conviction in the current direction
Color Transitions: Gradual shifts from warm (red/orange) to cool (green) tones indicate strengthening trends
🔶 EXAMPLES
Strong Trend Entry: When trend strength crosses above the enter threshold (e.g., 1.2), it identifies the onset of a powerful move where price deviates significantly from the mean.
Example: During a rally, trend strength rising from yellow (around 1.0) to green (1.2+) often precedes sustained upward momentum, providing entry opportunities for trend followers.
Consolidation Detection: Low trend strength values in red shades (below 0.5) highlight periods of low volatility and mean reversion potential.
Example: After a sharp sell-off, persistent red values signal a likely sideways phase, allowing traders to avoid whipsaws and wait for orange/yellow transitions as a precursor to recovery.
Volatility-Adjusted Pullbacks: In volatile markets, the ATR component ensures trend strength remains accurate; a dip back to yellow from green during minor corrections can indicate healthy pullbacks within a strong trend.
Example: Trend strength briefly falling to yellow levels (e.g., 0.8-1.1) after hitting green provides profit-taking signals without invalidating the overall bullish bias if the VWMA holds as support.
Threshold Alert Integration: The alert condition combines strength value with the enter threshold for timely notifications.
Example: Receiving a "Strong Trend Detected" alert when the area plot turns green helps confirm Bitcoin's breakout from consolidation, aligning with increased volume for higher-probability trades.
🔶 SETTINGS
Customization Options:
Lengths: VWMA length (default 14), ATR length (default 14)
Thresholds: Trend enter (default 1.2, step 0.1), trend exit (default 1.15, for potential future signal enhancements)
Visuals: Automatic color scaling with red at 0, transitioning to green at/above enter threshold
Alert Conditions: Strong trend detection (when strength > enter)
The Trend Strength Index equips traders with a robust, easy-to-interpret tool for gauging trend intensity in volatile markets like Bitcoin. By normalizing price deviations against volatility, it delivers reliable signals for identifying high-momentum opportunities while the gradient coloring and alerts facilitate quick assessments in both trending and choppy conditions.

Trend CounterTREND COUNTER is a Trend Exhaustion Indicator that tracks the persistence of price movements over a series of bars, helping traders identify potential trend exhaustion and reversals.
It compares each bar's value (typically the closing price) to a previous bar from a set lookback period (the lookback bar), counting consecutive bullish or bearish price movements.
The count resets when the trend reverses, signaling a potential shift in momentum.
• Price movement is considered bullish if the current price exceeds the lookback bar's price, incrementing the bullish count with each consecutive occurrence.
• Price movement is considered bearish if the current price is lower than the lookback bar's price, incrementing the bearish count with each consecutive occurrence.
• The count resets when the trend reverses.
• The user sets the threshold for sequence resets by defining the maximum number of consecutive occurrences.
• The count may reset before a trend reversal if it surpasses the user-defined threshold.
This type of indicator is useful for detecting trends, trend exhaustion, overbought or oversold conditions, and potential reversal points, helping traders anticipate market turns.
• Sequential occurrences gauge trend strength.
A long sequence of bullish bars suggests strong upward momentum, while consecutive bearish bars indicate sustained downward pressure.
This helps traders assess whether a trend is likely to continue or weaken.
• Identify thresholds for potential reversal points.
Counting consecutive bullish or bearish price movements can highlight overextended trends.
A trend reaching a predefined threshold may signal an upcoming reversal or momentum slowdown.
• Identify potential entry or exit points.
If trends are showing signs of exhaustion after a certain number of consecutive price movements, traders may use this for timing adjustments to their position.
• Assess risk.
Understanding trend strength helps traders better adjust stop-loss or take-profit levels.
Sequential counting provides a structured approach to trade management.
Visualization & Customization
The Sequential Momentum indicator visually represents consecutive bullish or bearish price movements to define trends and highlight key shifts.
• The bullish/bearish bar sequences are based on user-defined thresholds.
• Customizable bar coloring, labels, and plot shapes enhanced trend visualization.
• Dynamic color transitions make trend shifts easily identifiable.
Tracking consecutive bullish or bearish price movements can be effective when combined with other indicators or applied in specific market conditions (e.g., trending or volatile markets).
However, its reliability depends on market conditions and the trader’s interpretation.
This indicator is best used as a complementary tool rather than a standalone signal, helping traders visualize and quantify market momentum within a broader strategy.
Trending Market Toolkit [LuxAlgo]The Trending Market Toolkit focuses exclusively on trending market structures and high-confluence, high-risk-to-reward entry models. It is designed to complement discretionary trading by offering different entry strategies based on market structure.
🔶 USAGE
In the chart above we can see how the tool detects several reversals, draws the broken trendlines, the reversal areas from which the tool starts looking for a trigger, and when it finally happens, a potential trade with risk and reward areas and the risk/reward ratio.
🔹 Detection Mode
Traders can choose between three different modes: trend only, reversal only, or both.
If both are active, reversals have priority over trends, so the tool will not detect a trend if a reversal is active.
In the chart above we can see all three modes.
🔹 Detection on Higher Timeframes
Traders can choose to identify structures on the chart timeframe or on a higher timeframe.
In the chart above, we have the SP500 futures on the 5m timeframe with different settings: chart timeframe, 30m, and 1H.
🔹 Risk And Targets
Depending on whether the high-risk/reward parameter is enabled, traders can choose between three different targets and two different stops.
The chart above shows how different choices affect the risk/reward ratio for the same potential trade on the Gold Futures 2m chart.
🔶 SETTINGS
Show: Traders can choose between Trends, Reversals or Both.
🔹 Structures
Swing Length: Number of candles to confirm a swing high or swing low. A higher number detects larger swings.
Custom Timeframe: Traders can make use of the current chart timeframe, or choose a custom timeframe.
Reversal Area Threshold: A higher number increases the reversal area.
🔹 Trades
Trade Trigger Length: Number of candles to confirm an internal high or internal low. A lower number detects smaller swings. It must be the same size or smaller than the swing length.
Target: Traders can choose between the default target (0) or two extended targets (0.27 or 0.618).
Risk to Reward Threshold: Set the minimum risk-to-reward ratio to detect trades. Use the 0 value to detect all trades.
High Risk to Reward: Enable/Disable the high risk to reward mode.

Trend Battery [Phantom]Trend Battery
Visualize Trend Strength with a Dynamic EMA Power Gauge
OVERVIEW
The Trend Battery indicator offers a clear, visual representation of trend strength based on the alignment of multiple Exponential Moving Averages (EMAs). It assigns a color-coded score to each bar, helping traders quickly assess the prevailing trend's power and direction.
CONCEPT
• Trend Strength Using EMAs: The indicator analyzes the alignment of 20 EMAs (8 to 200 periods) to gauge trend strength. The more EMAs align, the stronger the trend.
• Gradient-Based Visualization: Scores are mapped to a color gradient, transitioning from green (bullish) to purple (bearish), providing an intuitive visual representation of trend momentum.
HOW IT WORKS
Trend Battery calculates 20 EMAs and evaluates their alignment. When EMAs align in a strong trend, the bar colors change (as displayed in battery color key on chart) displaying a spectrum of colors from bright green (strong uptrend) to deep purple (strong downtrend).
• Dynamic Bar Colors:
o Green hues: Strong bullish trends.
o Purple hues: Strong bearish trends.
o Red hues: Weaker trends or potential transitions.
FEATURES
• Dynamic Color Coding: Easy-to-read and instantly assess trend.
• Customizable Transparency: Adjust bar color opacity to your preference.
• Optional EMA Display: Toggle individual EMA lines on/off for additional context.
• Compact Battery View: Quick reference table displaying the gradient color mapping.
SETTINGS
• Transparency: Controls the opacity of bar colors.
• Show EMAs on Chart: Enables/disables plotting of EMA lines.
USAGE
• Identify trend strength and direction.
• Confirm trend reversals or continuations.
• Complement other indicators and strategies.
• Monitor multi-timeframe trends.
TRADE IDEAS:
• For larger timeframes purple hues can be used for accumulating and green hues for distribution.
• For smaller timeframes, color transitions could be a signal for trend reversal, or corrections.
• It is a good idea to use larger timeframes for overall trend directions, and smaller timeframes for entries.
LIMITATIONS
• Lagging Indicator: As the Trend Battery relies on Exponential Moving Averages (EMAs), it is inherently a lagging indicator. This means it reflects past price action and may not always provide timely signals for rapid market changes or sudden reversals.
• False Signals in Sideways Markets: In ranging or consolidating markets, the indicator may produce mixed signals (frequent color changes) as EMAs intertwine without a clear trend. This can lead to false interpretations if not considered alongside other market context indicators.
• Not a Standalone System: The Trend Battery is designed to be a visual aid and should not be used as the sole basis for trading decisions. It's most effective when combined with other technical analysis tools, such as oscillators, support/resistance levels, and fundamental analysis.
DISCLAIMER
Use the Trend Battery indicator in conjunction with other forms of analysis and risk management. Past performance is not indicative of future results.

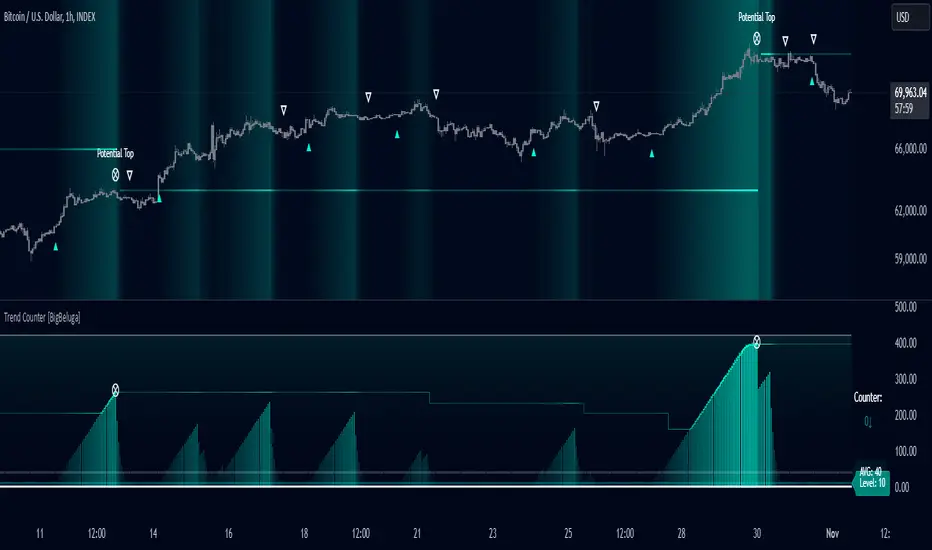
Trend Counter [BigBeluga]The Trend Counter indicator is designed to help traders identify trend conditions and potential reversals by counting the number of bars within a specified period that are above or below an average price level. By smoothing and averaging these counts, the indicator provides a clear visual representation of market trends and highlights key trend changes.
Key Features:
⦾ Trend Counting:
Counts bars above and below average price levels over a specified period.
Smooths and rounds the count for better visualization.
// Count bars over length period above highest and lowest avg with offset loop
float mid = math.avg(ta.highest(length), ta.lowest(length))
for offset = 0 to length -1
switch
hl2 > mid => counter += 1.0
=> counter := 0.0
// Smooth Count and Round
counter := math.round(ta.ema(counter > 400 ? 400 : counter, smooth))
// Count Avg
count.push(counter)
avg = math.round(count.avg())
⦿ Color Indication:
Uses gradient colors to indicate the strength of the trend.
Colors the background based on trend strength for easier interpretation.
⦿ Trend Signals:
Provides visual cues for trend changes based on the counter crossing predefined levels.
⦿ Potential Tops:
Identifies potential market tops using a specified length and highlights these levels.
⦿ Additional Features:
Displays Trend Counter value with arrows to indicate the direction of the trend movement.
Displays average trend count and level for reference.
⦿ User Inputs Description
Length: Defines the period over which the trend counting is performed.
Trend Counter Smooth: Specifies the smoothing period for the trend counter.
Level: Sets the threshold level for trend signals.
Main Color: Determines the primary color for trend indication.
The Trend Counter indicator is a powerful tool for traders seeking to identify and visualize market trends.
By counting and smoothing price bars above and below average levels, it provides clear and intuitive signals for trend strength and potential reversals.
With customizable parameters and visual cues, the Trend Counter enhances trend analysis and decision-making for traders of all levels.
Trend LinesThis script, titled "Trend Lines," is designed to detect and plot significant trend lines on a TradingView chart, based on pivot points. It highlights both uptrend and downtrend lines using different colors and allows customization of line styles, including color and thickness. Here's a breakdown of how the script works:
Inputs
Left Bars (lb) and Right Bars (rb): These inputs determine the number of bars to the left and right of a pivot point used to identify significant highs and lows.
Show Pivot Points: A boolean input to display markers at detected pivot points on the chart.
Show Old Line as Dashed: A boolean input to display older trend lines as dashed for visual distinction.
Uptrend Line Color (ucolor) and Downtrend Line Color (dcolor): Color inputs to customize the appearance of uptrend and downtrend lines.
Uptrend Line Thickness (uthickness) and Downtrend Line Thickness (dthickness): Inputs to adjust the thickness of the trend lines.
Calculations
Pivot Highs and Lows: The script calculates potential pivot highs and lows by looking at lb bars to the left and rb bars to the right. If a bar's high is the highest (or low is the lowest) within this window, it is considered a pivot point.
Trend Lines: The script connects the most recent and previous pivot highs to form downtrend lines, and the most recent and previous pivot lows to form uptrend lines. These lines are drawn with the specified color and thickness.
Angles: The angle of each trend line is calculated to determine whether the trend is strengthening or weakening. If the trend changes significantly, the line's extension is adjusted accordingly.
Plotting
Pivot Point Markers: If Show Pivot Points is enabled, markers labeled "H" for highs and "L" for lows are plotted at the pivot points.
Trend Lines: The script draws lines between pivot points, coloring them according to the trend direction (uptrend or downtrend). If Show Old Line as Dashed is enabled, the script sets older lines to a dashed style to indicate they are no longer the most recent trend lines.
This script is useful for traders who want to visually identify key support and resistance levels based on historical price action, helping them to make more informed trading decisions. The customization options allow traders to tailor the appearance of the trend lines to suit their personal preferences or charting style.
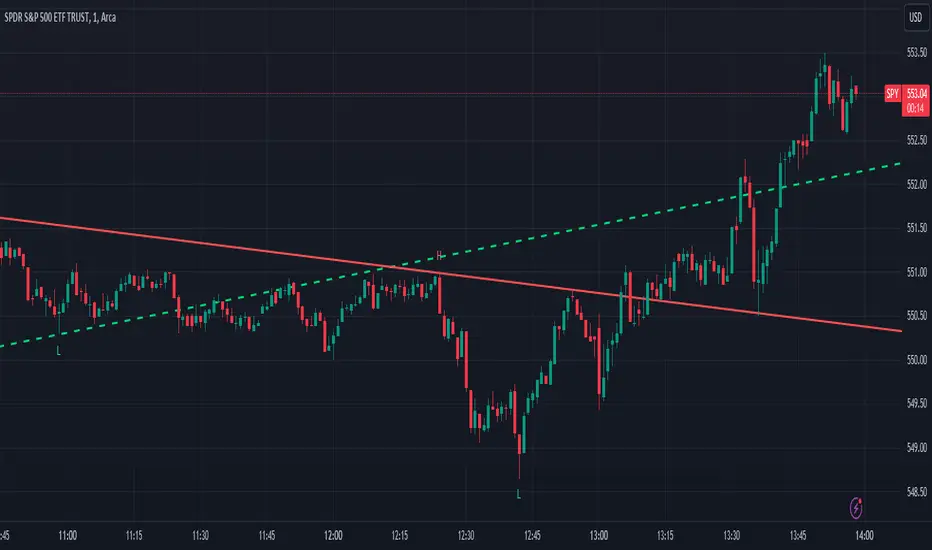
Trend Lines with Break Signals [UAlgo]🔶 Description:
The "Trend Lines with Breaks " indicator is designed to identify and visualize trend lines on a price chart, allowing traders to observe potential trend reversals or continuations. This script implements a method to draw trend lines based on pivot points (highs and lows) within a specified sensitivity range. It also provides an option to display breaks in these trend lines, aiding traders in recognizing significant market movements.
🔶 Key Features:
Trend Line Sensitivity Adjustment: Users can adjust the sensitivity of the trend lines using the "Trend Line Sensitivity" parameter, allowing customization based on market conditions and preferences.
Visualization of Trend Lines: The indicator visually represents trend lines on the chart, distinguishing between upward and downward trends. Users can customize the appearance of these trend lines, including color, style, and width.
Detection of Trend Line Breaks: Trend line breaks are identified by comparing the current price with the slope of the trend line. If the price breaks below (for bullish trend lines) or above (for bearish trend lines) the slope of the trend line, indicating a potential reversal, a "B" label is displayed on the chart. Trend line breaks are only displayed if the "showBreaks" parameter is enabled.
Before Bearish Trend Line Break :
If the price "Close" value closes above the trend line :
Before Bullish Trend Line Break :
If the price "Close" value closes below the trend line :
🔶 Disclaimer:
Not Financial Advice: This indicator is intended for educational and informational purposes only. It does not constitute financial advice or recommendations to buy, sell, or hold any financial instruments.
Use at Own Risk: Trading involves substantial risk of loss and is not suitable for all investors. Users of this indicator should exercise caution and conduct their own research and analysis before making any trading decisions.
Performance Not Guaranteed: Past performance is not indicative of future results. While the indicator aims to assist traders in analyzing market trends, there is no guarantee of accuracy or success in trading operations.

Trend Flow Profile [AlgoAlpha]Description:
The "Trend Flow Profile" indicator is a powerful tool designed to analyze and interpret the underlying trends and reversals in a financial market. It combines the concepts of Order Flow and Rate of Change (ROC) to provide valuable insights into market dynamics, momentum, and potential trade opportunities. By integrating these two components, the indicator offers a comprehensive view of market sentiment and price movements, facilitating informed trading decisions.
Rationale:
The combination of Order Flow and ROC in the "Trend Flow Profile" indicator stems from the recognition that both factors play critical roles in understanding market behavior. Order Flow represents the net buying or selling pressure in the market, while ROC measures the rate at which prices change. By merging these elements, the indicator captures the interplay between market participants' actions and the momentum of price movements, enabling traders to identify trends, spot reversals, and gauge the strength of price acceleration or deceleration.
Calculation:
The Order Flow component is computed by summing the volume when prices move up and subtracting the volume when prices move down. This cumulative measure reflects the overall order imbalance in the market, providing insights into the dominant buying or selling pressure.
The ROC component calculates the percentage change in price over a given period. It compares the current price to a previous price and expresses the change as a percentage. This measurement indicates the velocity and direction of price movement, allowing traders to assess the market's momentum.
How to Use It?
The "Trend Flow Profile" indicator offers valuable information to traders for making informed trading decisions. It enables the identification of underlying trends and potential reversals, providing a comprehensive view of market sentiment and momentum. Here are some key ways to utilize the indicator:
Spotting Trends: The indicator helps identify the prevailing market trend, whether bullish or bearish. A consistent positive (green) histogram indicates a strong uptrend, while a consistent negative (red) histogram suggests a robust downtrend.
Reversal Signals: Reversal patterns can be identified when the histogram changes color, transitioning from positive to negative (or vice versa). These reversals can signify potential turning points in the market, highlighting opportunities for counter-trend trades.
Momentum Assessment: By observing the width and intensity of the histogram, traders can assess the acceleration or deceleration of price momentum. A wider histogram suggests strong momentum, while a narrower histogram indicates a potential slowdown.
Utility:
The "Trend Flow Profile" indicator serves as a valuable tool for traders, providing several benefits. Traders can easily identify the prevailing market trend, enabling them to align their trading strategies with the dominant direction of the market. The indicator also helps spot potential reversals, allowing traders to anticipate market turning points and capture counter-trend opportunities. Additionally, the green and red histogram colors provide visual cues to determine the optimal duration of a long or short position. Following the green histogram signals when in a long position and the red histogram signals when in a short position can assist traders in managing their trades effectively. Moreover, the width and intensity of the histogram offer insights into the acceleration or deceleration of momentum. Traders can gauge the strength of price movements and adjust their trading strategies accordingly. By leveraging the "Trend Flow Profile" indicator, traders gain a comprehensive understanding of market dynamics, which enhances their decision-making and improves their overall trading outcomes.

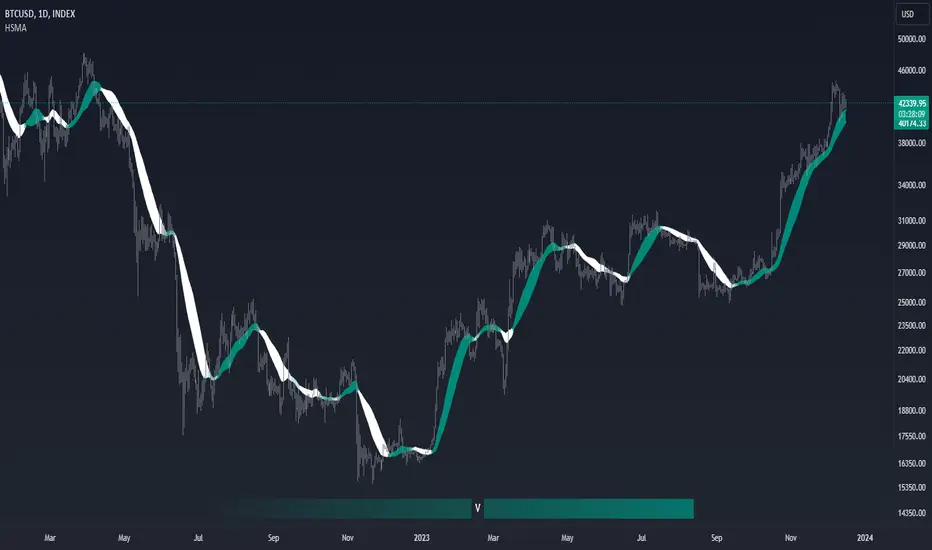
Trend Strength GaugeTrend Strength Gauge with Modified Hull Moving Average (HMA)
Overview:
The indicator combines a modified Hull Moving Average (HMA) with a visual gauge that represents the strength and direction of the current trend. This helps traders quickly assess the trend's vigor and direction.
Key Features:
Modified Hull Moving Average (HMA):
Purpose: The HMA is a smoothed moving average designed to reduce lag and provide more responsive trend signals.
The indicator displays two HMA line and SMA line on the chart and fill color between them
based on HMA is above SMA or not.
Trend Strength Gauge:
Visualization: Below the chart, there's a gauge represented by gradient line gauge with "V" symbol.
The gauge line change color based on the direction of the trend.
Additionally, symbol "V" moves from solid color to transparent, indicating the trend's strength gradient.
Up Trend:
Dn Trend:
Trend Assessment:
When "V" at the strong teal collor it represents a strong positive trend (uptrend).
When "V" at the strong white collor it Indicates a strong negative trend (downtrend).
Arrow Movement: The symbol 'V' transitions from a solid color (teal or white) to a more transparent shade based on the strength of the trend.
Usage:
Trend Confirmation: Traders can use this indicator to confirm trends and assess their strength before making trading decisions.
Entry/Exit Points: The changing colors and transparency levels of the 'V' symbols can assist in identifying potential entry or exit points.
Can be used as a simple Hull indicator
This combined indicator simplifies trend analysis by offering an easily understandable visual representation of trend strength and direction.
Remember, while indicators are valuable tools, successful trading requires a comprehensive approach that incorporates multiple sources of information and risk management strategies.
Always exercise caution, apply critical thinking, and consider the broader market context when using indicators to make informed trading decisions.
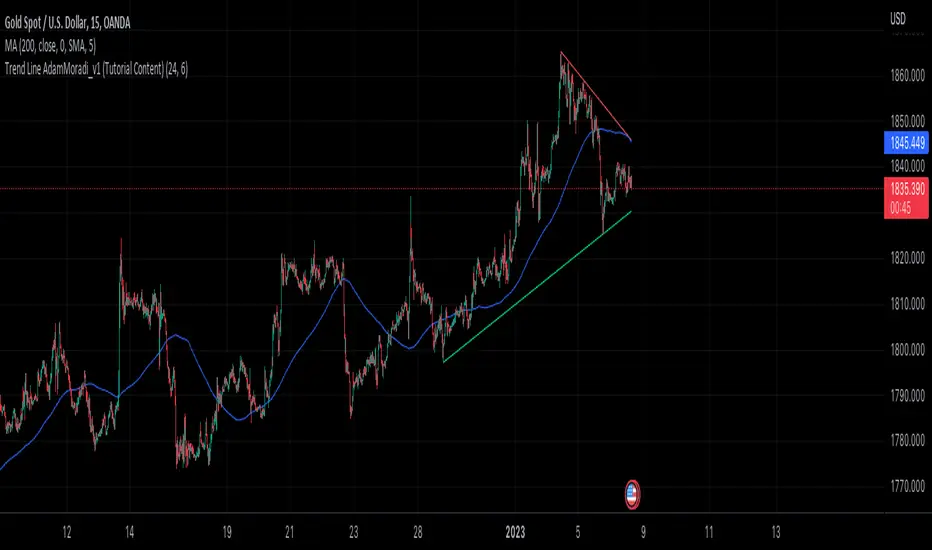
Trend Line Adam Moradi v1 (Tutorial Content)
The Pine Script strategy that plots pivot points and trend lines on a chart. The strategy allows the user to specify the period for calculating pivot points and the number of pivot points to be used for generating trend lines. The user can also specify different colors for the up and down trend lines.
The script starts by defining the input parameters for the strategy and then calculates the pivot high and pivot low values using the pivothigh() and pivotlow() functions. It then stores the pivot points in two arrays called trend_top_values and trend_bottom_values. The script also has two arrays called trend_top_position and trend_bottom_position which store the positions of the pivot points.
The script then defines a function called add_to_array() which takes in three arguments: apointer1, apointer2, and val. This function adds val to the beginning of the array pointed to by apointer1, and adds bar_index to the beginning of the array pointed to by apointer2. It then removes the last element from both arrays.
The script then checks if a pivot high or pivot low value has been calculated, and if so, it adds the value and its position to the appropriate arrays using the add_to_array() function.
Next, the script defines two arrays called bottom_lines and top_lines which will be used to store trend lines. It also defines a variable called starttime which is set to the current time.
The script then enters a loop to calculate and plot the trend lines. It first deletes any existing trend lines from the chart. It then enters two nested loops which iterate over the pivot points stored in the trend_bottom_values and trend_top_values arrays. For each pair of pivot points, the script calculates the slope of the line connecting them and checks if the line is a valid trend line by iterating over the price bars between the two pivot points and checking if the line is above or below the close price of each bar. If the line is found to be a valid trend line, it is plotted on the chart using the line.new() function.
Finally, the script colors the trend lines using the colors specified by the user.
Tutorial Content
'PivotPointNumber' is an input parameter for the script that specifies the number of pivot points to consider when calculating the trend lines. The value of 'PivotPointNumber' is set by the user when they configure the script. It is used to determine the size of the arrays that store the values and positions of the pivot points, as well as the number of pivot points to loop through when calculating the trend lines.
'up_trend_color' is an input parameter for the script that specifies the color to use for drawing the trend lines that are determined to be upward trends. The value of 'up_trend_color' is set by the user when they configure the script and is passed to the color parameter of the line.new() function when drawing the upward trend lines. It determines the visual appearance of the upward trend lines on the chart.
'down_trend_color' is an input parameter for the script that specifies the color to use for drawing the trend lines that are determined to be downward trends. The value of 'down_trend_color' is set by the user when they configure the script and is passed to the color parameter of the line.new() function when drawing the downward trend lines. It determines the visual appearance of the downward trend lines on the chart.
'pivothigh' is a variable in the script that stores the value of the pivot high point. It is calculated using the pivothigh() function, which returns the highest high over a specified number of bars. The value of 'pivothigh' is used in the calculation of the trend lines.
'pivotlow' is a variable in the script that stores the value of the pivot low point. It is calculated using the pivotlow() function, which returns the lowest low over a specified number of bars. The value of 'pivotlow' is used in the calculation of the trend lines.
'trend_top_values' is an array in the script that stores the values of the pivot points that are determined to be at the top of the trend. These are the pivot points that are used to calculate the upward trend lines.
'trend_top_position' is an array in the script that stores the positions (i.e., bar indices) of the pivot points that are stored in the 'trend_top_values' array. These positions correspond to the locations of the pivot points on the chart.
'trend_bottom_values' is an array in the script that stores the values of the pivot points that are determined to be at the bottom of the trend. These are the pivot points that are used to calculate the downward trend lines.
'trend_bottom_position' is an array in the script that stores the positions (i.e., bar indices) of the pivot points that are stored in the 'trend_bottom_values' array. These positions correspond to the locations of the pivot points on the chart.
apointer1 and apointer2 are variables used in the add_to_array() function, which is defined in the script. They are both pointers to arrays, meaning that they hold the memory addresses of the arrays rather than the arrays themselves. They are used to manipulate the arrays by adding new elements to the beginning of the arrays and removing elements from the end of the arrays.
apointer1 is a pointer to an array of floating-point values, while apointer2 is a pointer to an array of integers. The specific arrays that they point to depend on the arguments passed to the add_to_array() function when it is called. For example, if add_to_array(trend_top_values, trend_top_posisiton, pivothigh) is called, then apointer1 would point to the tval array and apointer2 would point to the tpos array.
'bottom_lines' (short for "Bottom Lines") is an array in the script that stores the line objects for the downward trend lines that are drawn on the chart. Each element of the array corresponds to a different trend line.
'top_lines' (short for "Top Lines") is an array in the script that stores the line objects for the upward trend lines that are drawn on the chart. Each element of the array corresponds to a different trend line.
Both 'bottom_lines' and 'top_lines' are arrays of type "line", which is a data type in PineScript that represents a line drawn on a chart. The line objects are created using the line.new() function and are used to draw the trend lines on the chart. The variables are used to store the line objects so that they can be manipulated and deleted later in the script.
Loops
maxline is a variable in the script that specifies the maximum number of trend lines that can be drawn on the chart. It is used to determine the size of the bottom_lines and top_lines arrays, which store the line objects for the trend lines.
The value of maxline is set to 3 at the beginning of the script, meaning that at most 3 trend lines can be drawn on the chart at a time. This value can be changed by the user if desired by modifying the assignment statement "maxline = 3".
'count_line_low' (short for "Count Line Low") is a variable in the script that keeps track of the number of downward trend lines that have been drawn on the chart. It is used to ensure that the maximum number of trend lines (as specified by the maxline variable) is not exceeded.
'count_line_high' (short for "Count Line High") is a variable in the script that keeps track of the number of upward trend lines that have been drawn on the chart. It is used to ensure that the maximum number of trend lines (as specified by the maxline variable) is not exceeded.
Both 'count_line_low' and 'count_line_high' are initialized to 0 at the beginning of the script and are incremented each time a new trend line is drawn. If either variable exceeds the value of maxline, then no more trend lines are drawn.
'pivot1', 'up_val1', 'up_val2', up1, and up2 are variables used in the loop that calculates the downward trend lines in the script. They are used to store intermediate values during the calculation process.
'pivot1' is a loop variable that is used to iterate through the pivot points (stored in the trend_bottom_values and trend_bottom_position arrays) that are being considered for use in the trend line calculation.
'up_val1' and 'up_val2' are variables that store the values of the pivot points that are used to calculate the downward trend line.
up1 and up2 are variables that store the positions (i.e., bar indices) of the pivot points that are stored in 'up_val1' and 'up_val2', respectively. These positions correspond to the locations of the pivot points on the chart.
'value1' and 'value2' are variables that are used to store the values of the pivot points that are being compared in the loop that calculates the trend lines in the script. They are used to determine whether a trend line can be drawn between the two pivot points.
For example, if 'value1' is the value of a pivot point at the top of the trend and 'value2' is the value of a pivot point at the bottom of the trend, then a trend line can be drawn between the two points if 'value1' is greater than 'value2'. The values of 'value1' and 'value2' are used in the calculation of the slope and intercept of the trend line.
'position1' and 'position2' are variables that are used to store the positions (i.e., bar indices) of the pivot points that are being compared in the loop that calculates the trend lines in the script. They are used to determine the distance between the pivot points, which is necessary for calculating the slope of the trend line.
For example, if 'position1' is the position of a pivot point at the top of the trend and 'position2' is the position of a pivot point at the bottom of the trend, then the distance between the two points is given by 'position1' - 'position2'. This distance is used in the calculation of the slope of the trend line.
'different', 'high_line', 'low_location', 'low_value', and 'valid' are variables that are used in the loop that calculates the downward trend lines in the script. They are used to store intermediate values during the calculation process.
'different' is a variable that stores the slope of the downward trend line being calculated. It is calculated as the difference in value between the two pivot points (stored in up_val1 and up_val2) divided by the distance between the pivot points (calculated using their positions, stored in up1 and up2).
'high_line' is a variable that stores the current value of the trend line being calculated at a given point in the loop. It is initialized to the value of the second pivot point (stored in up_val2) and is updated on each iteration of the loop using the value of different.
'low_location' is a variable that stores the position (i.e., bar_index) on the chart of the point where the trend line being calculated first touches the low price. It is initialized to the position of the second pivot point (stored in up2) and is updated on each iteration of the loop if the trend line touches a lower low.
'low_value' is a variable that stores the value of the trend line at the point where it first touches the low price. It is initialized to the value of the second pivot point (stored in up_val2) and is updated on each iteration of the loop if the trend line touches a lower low.
'valid' is a Boolean variable that is used to indicate whether the trend line being calculated is valid. It is initialized to true and is set to false if the trend line does not pass through all the lows between the pivot points. If valid is still true after the loop has completed, then the trend line is considered valid and is drawn on the chart.
d_value1, d_value2, d_position1, and d_position2 are variables that are used in the loop that calculates the upward trend lines in the script. They are used to store intermediate values during the calculation process.
d_value1 and d_value2 are variables that store the values of the pivot points that are used to calculate the upward trend line.
d_position1 and d_position2 are variables that store the positions (i.e., bar indices) of the pivot points that are stored in d_value1 and d_value2, respectively. These positions correspond to the locations of the pivot points on the chart.
The variables d_value1, d_value2, d_position1, and d_position2 have the same function as the variables uv1, uv2, up1, and up2, respectively, but for the calculation of the upward trend lines rather than the downward trend lines. They are used in a similar way to store intermediate values during the calculation process.
thank you.
Trend-Quality IndicatorBINANCE:BTCUSDT
Open source version of the Trend-Quality Indicator as described by David Sepiashvili in [ Stocks & Commodities V. 22:4 (14-20) ]
Q-Indicator and B-Indicator are available both separately or together
█ OVERVIEW
The Trend-Quality indicator is a trend detection and estimation tool that is based on a two-step filtering technique. It measures cumulative price changes over term-oriented semicycles and relates them to “noise”. The approach reveals congestion and trending periods of the price movement and focuses on the most important trends, evaluating their strength in the process. The indicator is presented in a centered oscillator (Q-Indicator) and banded oscillator format (B-Indicator).
Semicycles are determined by using a short term and a longer term EMAs. The starting points for the cycles are determined by the moving averages crossover.
Cumulative price change (CPC) indicator measures the amount that the price has changed from a fixed starting point within a given semicycle. The CPC indicator is calculated as a cumulative sum of differences between the current and previous prices over the period from the fixed starting point.
The trend within the given semicycle can be found by calculating the moving average of the cumulative price change.
The noise can be defined as the average deviation of the cumulative price change from the trend. To determine linear noise, we calculate the absolute value of the difference between CPC and trend, and then smooth it over the n-point period. The root mean square noise, similar to the conventional standard deviation, can be derived by summing the squares of the difference between CPC and trend over each of the preceding n-point periods, dividing the sum by n, and calculating the square root of the result.
█ Q-INDICATOR
The Q-Indicator is a centered oscillator that fluctuates around a zero line with no upper or lower limits, is calculated by dividing trend by noise.
The Q-Indicator is intended to measure trend activity. The further the Q is from 0, the less the risk of trading with a trend, and the more reliable the trading opportunity. Values exceeding +2 or -2 can be qualified as promising
Values:
in the -1 to +1 range (GRAY) indicate that the trend is buried beneath noise. It is preferable to stay out of this zone
in the +1 to +2 or -1 to -2 range (YELLOW) indicate weak trending
in the +2 to +5 range (BLUE) or -2 to -5 range (ORANGE) indicate moderate trending
above +5 range (GREEN) or below -5 (RED) indicate strong trending
Readings exceeding strong trending levels can indicate overbought or oversold conditions and signal that price action should be monitored closely.
█ B-INDICATOR
The B-Indicator is a banded oscillator that fluctuates between 0 and 100, is calculated by dividing the absolute value of trend by noise added to absolute value of trend, and scaling the result appropriately.
The B-indicator doesn’t show the direction of price movement, but only the existence of the trend and its strength. It requires additional tools for reversal manifestations.
The indicator’s interpretation is simple. The central line suggests that the trend and noise are in equilibrium (trend is equal to noise).
Values:
below 50 (GRAY) indicate ranging market
in the 50 to 65 range (YELLOW) indicate weak trending
in the 65 to 80 range (BLUE) indicate moderate trending
above 80 (GREEN) indicate strong trending
The 65 level can be thought of as the demarcation line of trending and ranging markets and can help determine which type of technical analysis indicator (lagging or leading) is better suited to current market conditions. Readings exceeding strong trending levels can indicate overbought or oversold conditions.

Trendlines with Breaks [LuxAlgo]The trendlines with breaks indicator return pivot point based trendlines with highlighted breakouts. Users can control the steepness of the trendlines as well as their slope calculation method.
Trendline breakouts occur in real-time and are not subject to backpainting. Trendlines can however be subject to repainting unless turned off from the user settings.
The indicator includes integrated alerts for trendline breakouts.
🔶 USAGE
Any valid trendlines methodology can be used with the indicator, users can identify breakouts in order to infer future price movements.
The calculation method of the slope greatly affects the trendline's behaviors. By default, an average true range is used, returning a more constant slope amongst trendlines. Other methods might return trendlines with significantly different slopes.
Stdev makes use of the standard deviation for the slope calculation, while Linreg makes use of the slope of a linear regression.
The above chart shows the indicator using "Stdev" as a slope calculation method. The chart below makes use of the "Linreg" method.
By default trendlines are subject to backpainting, and as such are offset by length bars in the past. Disabling backpainting will not offset the trendlines.
🔶 SETTINGS
Length: Pivot points period
Slope: Slope steepness, values greater than 1 return a steeper slope. Using a slope of 0 would be equivalent to obtaining levels.
Slope Calculation Method: Determines how the slope is calculated.
Backpaint: Determine whether trendlines are backpainted, that is offset to past.
