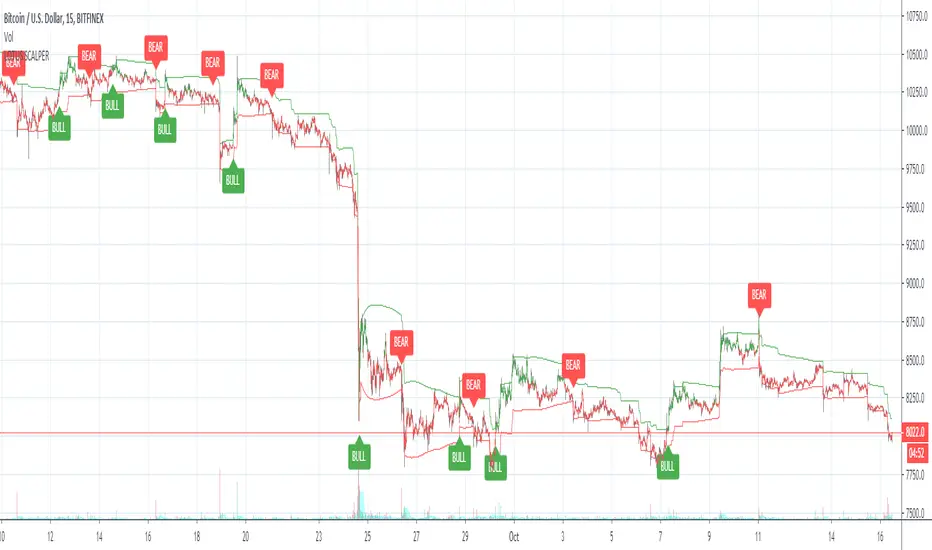
Lotus scalperWelcome to the Lotus scalper. This indicator is designed for scalping the 15m and 30m timeframes.
BULL = Buy
BEAR = Sell
Enjoy and let me know if you have questions!
You can also set alerts with this indicator!
Wyszukaj w skryptach "scalping"
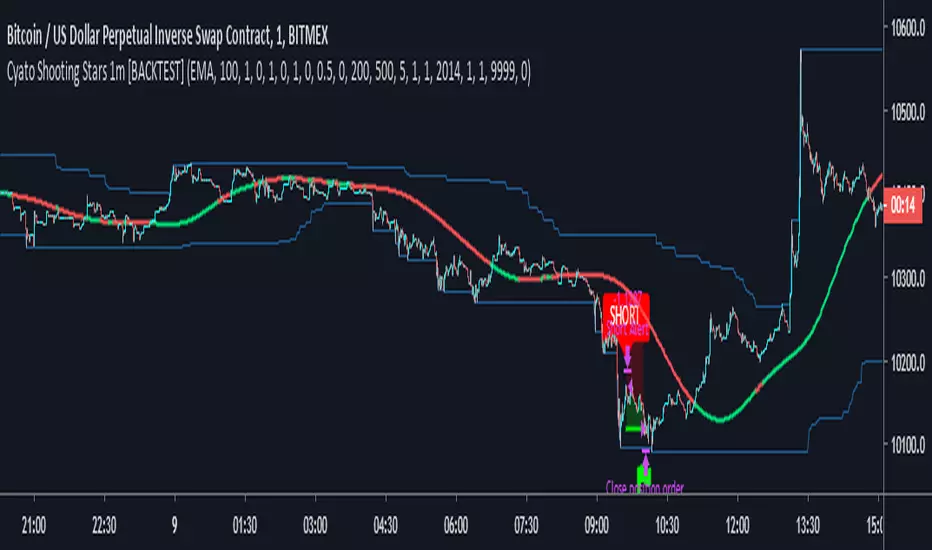
Cyatophilum Shooting Stars 1m [ALERTSETUP]A Scalping Script Setup for the 1m Timeframe, using the cheesy candle pattern "Shooting Stars" plus some Trend Detection, Stop Loss and Take Profit integrated system, allowing these nice backtest results.
Currently in continuous development / real time testing on BitMEX data.

Cyatophilum Shooting Stars 1m [BACKTEST]A Scalping Script for the 1m Timeframe, using the cheesy candle pattern "Shooting Stars" plus some Trend Detection, Stop Loss and Take Profit integrated system, allowing these nice backtest results.
Currently in continuous development / real time testing on BitMEX data.
EMA 21,13,8 - scalping3 EMAs will help identify and predict uptrends and downtrends
-If EMAs are all above the candles it a sign to sell & if the EMAs are below its a sign to buy
- If the Green-8 EMA crosses or touches red candle then flips under the other EMAs & candles then it's time to sell
-If the Green-8 EMA crosses or touches green candle then flips above the other EMAs & candles then it's time to buy
- how far is the EMAs from the candle it'll show how strong the trend. combine this strategy with the stochastic oscillator & RSI to get the maximum benefit


Market Cycle & Scalping entry / exitCycle indicator is an oscillator commonly used to identify market trends and provide buy and sell signals to traders. The Cyle indicator is based on the assumption that currency trends accelerate and decelerate in cyclical patterns that may reflect the dominant price cycle of any stock, during any time frame. It works best on a 1 min chart for quick scalp plays.


PA High Frequency TradingThis is PA High Frequency Trading Strategy
High Frequency Trading
5min Scalping Strategy

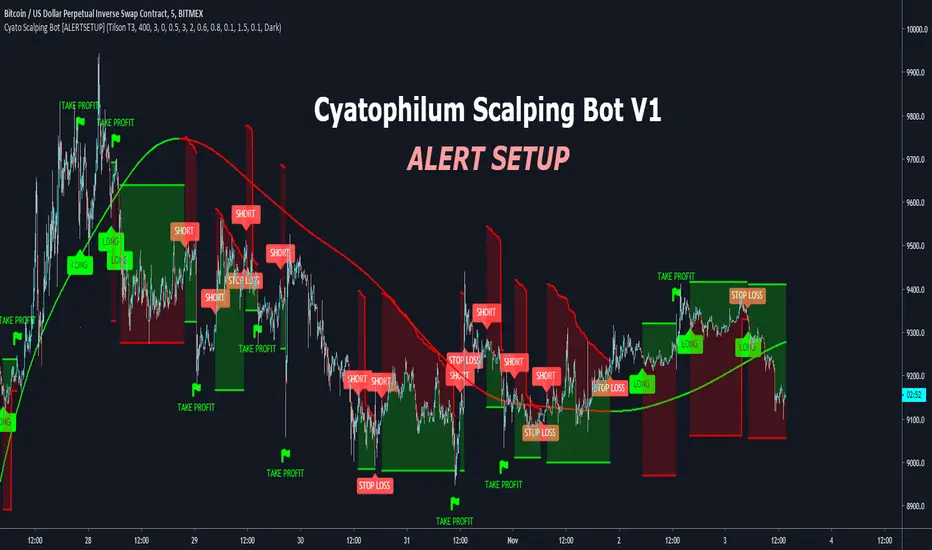
Cyatophilum Scalping Bot [ALERTSETUP]This indicator triggers Short or/and Long entries and exits.
Example with a Long trade:
The integrated stop loss will trigger an alert to exit the trade.
It is possible that a trend reverses during a trade.
In this case, the "LONG EXIT" alert will trigger at the same
time as the "SHORT ENTRY".
The Trend Detector feature, using EMA or Tilson T3 will filter trades that are against the main trend and thus increase profitability.
BONUS FEATURE
Trailing Take Profit with configurable % deviation.
SAMPLE USE CASES
ETH/BTC
ETH/USD
FOREX: GBP/USD
FOREX: XAU/USD
BTC/USDT
LTC/BTC
XRP/BTC
Read More
> Get access to the Cyatophilum Indicators <
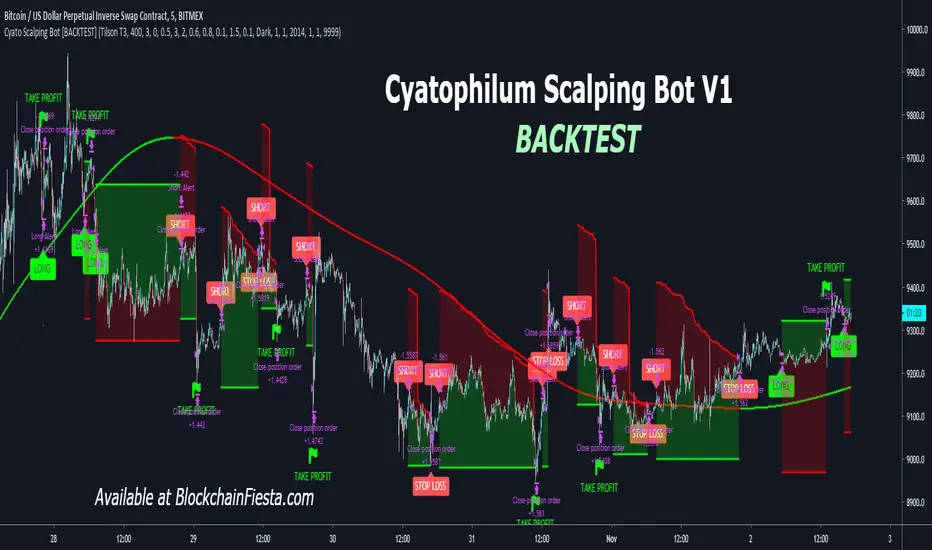
Cyatophilum Scalping Bot [BACKTEST]This indicator triggers Short or/and Long entries and exits.
Example with a Long trade:
The integrated stop loss will trigger an alert to exit the trade.
It is possible that a trend reverses during a trade.
In this case, the "LONG EXIT" alert will trigger at the same
time as the "SHORT ENTRY".
The Trend Detector feature, using EMA or Tilson T3 will filter trades that are against the main trend and thus increase profitability.
BONUS FEATURE
Trailing Take Profit with configurable % deviation.
SAMPLE USE CASES
ETH/BTC
ETH/USD
FOREX: GBP/USD
FOREX: XAU/USD
BTC/USDT
LTC/BTC
XRP/BTC
Read More
> Get access to the Cyatophilum Indicators <
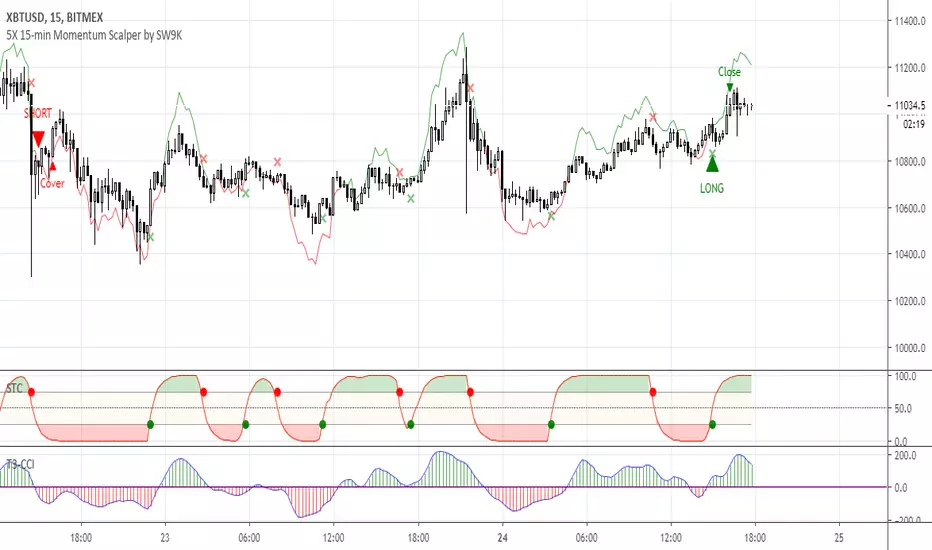
5X 15-min Momentum Scalper by SW9KThis is the alpha release-candidate study script with indicator alerts included. It is currently open for select individuals to test.
The core of this momentum scalper is primarily based on a modified Schaff Trend (which in itself is based on Stochastic elements and MACD) and a modified T3-CCI oscillator, specifically calibrated for 15-minute type movements -- do not apply to any other timeframes. Although it will take small scalps, it is designed to recognize when to ride out underwater positions so use maximum leverage or 5X or you may risk liquidation. Also, there is a stop loss setting feature, but it may reduce profits and win rate.
You can verify the highly accurate 75% win rate performance statistics with 100,000 XBTUSD contracts simulated at .
Features:
40% 3-month net profit, 74.48% win rate, 2.988 profit factor, 3.13% max drawdown, adjusted Sharpe ratio of ~3
Optimized for 15 minute timeframe scalping
Attempts to recognize when to keep position open and ride them out into profitable or breakeven
Profitable even with full Bitmex taker fees (0.075%)
Pyramiding Setting (default 3)
Aggressive Mode to increase entries and potential profits at higher risk
Easy-to-set binary Alerts
Follow SW9K at www.twitter.com
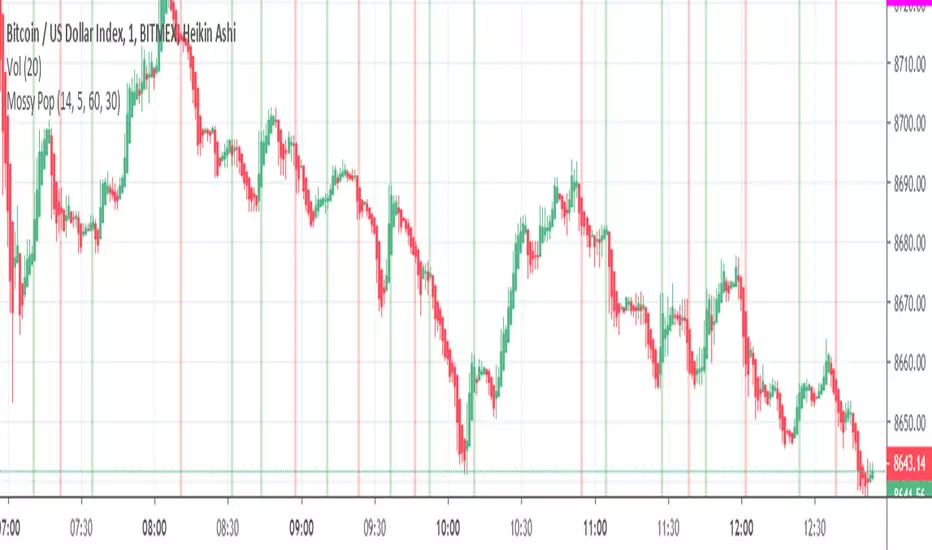
Mossy PopMossy Pop is a variation on the CM Chris Moody Pop 1 that is on the public library.
Bars are colored to show when the Pop is red crossing over the blue line turning bullish (Green Buy Bar)
or when it is overbought in green turning into blue going bearish (Red Sell Bar)
Use with other indicators but can work well on confirming a position on its own.
I find it worked best with Heikin Ashi but candles are fine.
Use with Mossy ADX DI for quick scalping profit and to confirm Buy/Sell signals!
Mossy ADX and DI with Buy/Sell SignalsBasic ADX DI with colored bars to show buy and sell signals , made for 1min but shows general signals of strong or weak buy and sell signals.
Dark Red = Heavy Signal
Light Red = weak signal
Green = buy signal
Dark Green = Heavy Signal
Colors are to confirm or warn, Buy/Sell points are where to enter and exit.
Mossy ADX DI colored bars for quick scalping, works best with Heikin Ashi, confirm with other indicators, Mossy Pop is one shown and works well to confirm.

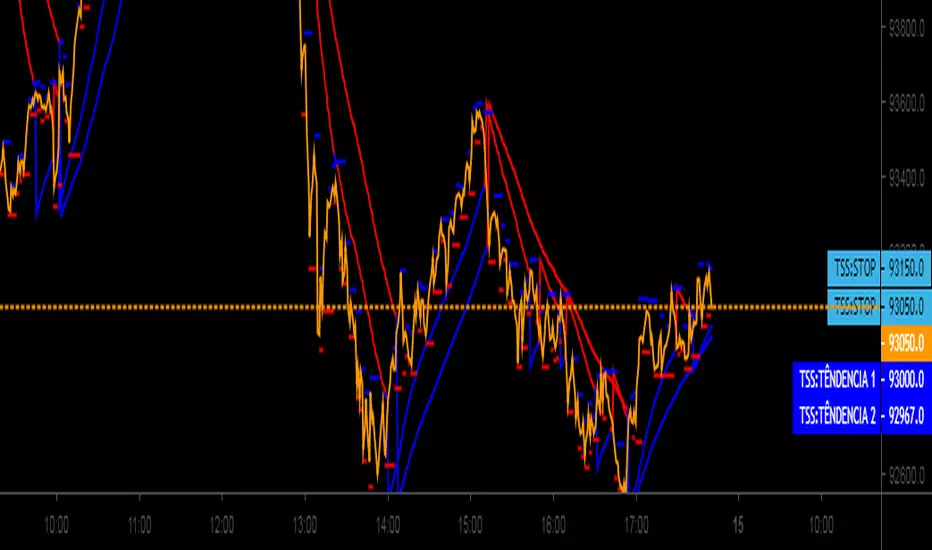
Trader Set - Averaging IndicatorThis is part of my SCALPING strategy, making the tool available for my students to use. In less than a month I will announce how you can get participated in the English version.
PA Researcher Scalping Band v2This is PA Researcher Scalping Band v2
ability to on/off buysell zone
ability to change color
Easy to check Short-Term Trend


SN30 IndicatorIndicator «SN30»
Class : oscillator
Trading type : scalping
Time frame : 5 min
Purpose : reversal trading
Level of aggressiveness : standard
Indicator « SN30 » is based on the linier regression and normal distribution. Regression is one of the most popular and effective methods of the time series analysis and data prediction. Indicator « SN30 » uses regression analysis as an alternative to the moving averages analysis. The main aim is data series smoothing to reduce the noise in data. It allows to see market as it is, without deformation.
Using unique author algorithm indicator « SN30 » searches for the optimal buy/sell zones. If they are sufficient indicator generates appropriate trading signals.
Structure of the indicator «SN30»
Indicator «SN30» consists of central channel line (green line based on linier regression) and price channels (2 blue and 2 red lines with colored zones between them). Colored zones are of two types: red (overbought zone) and blue (oversold zone). They are used to define deviations of the current prices from their fair values. When the price enters the red zone it should reverse soon (the prices will go down). The same is true for the blue zone (the prices will go up).
Also when the buy/sell signal is generated special signs are displayed on the chart (red and blue triangles)
Parameters of the «SN30» indicator
1. PeriodSN30 (indicator period, default value = 21) – is used to calculate fair value of the asset based on linier regression.
2. Width – defines the width of the stationary channel (indicated by bold lines). Default value = 20 pips.
3. Sigma – defines the width of the dynamic channel (indicated by usual lines). Default value = 2standard deviations. It allows fitting 95% of price values into channel. All the price values out of the channel are treated as abnormal.
Rules of trading
The indicator is designed to work on 5-minute time frames, but after additional adjustment of parameters it can be used on any other time periods.
The general principle of the “SN30” indicator is the same as that of any indicator of the oscillatory class: when the price is in the overbought zone it is interpreted as a signal of a future price reverse in the downward direction, and when the price is in the oversold zone it is a signal of a future price reverse in the upward direction.
The rules of trading are extremely simple: when the red triangle is appeared on the chart (sell signal) or a blue triangle (a buy signal), a corresponding transaction (sell or buy an asset) should be done. Stops can be placed above/below the red/blue zones.

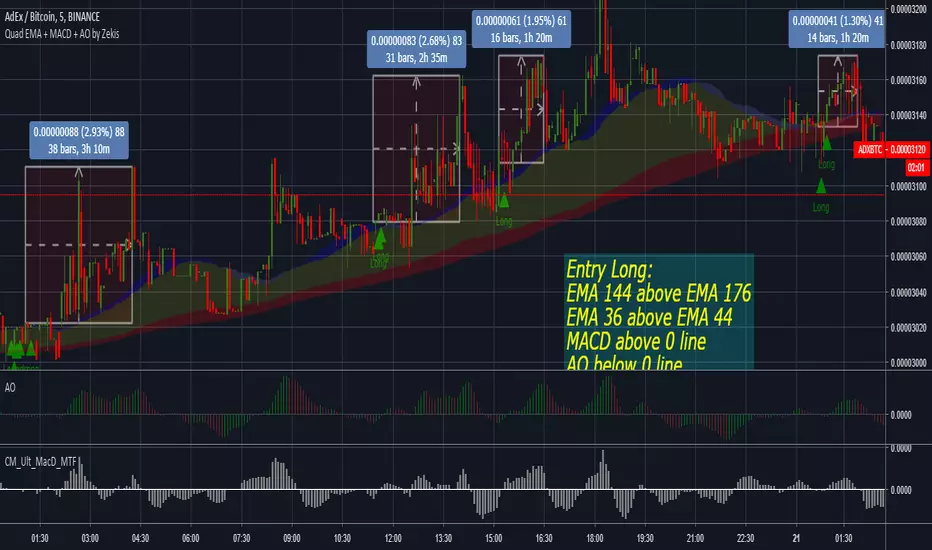
Quadruple EMA + MACD + Awesome Oscillator by ZekisThis strategy is based on quadruple EMAs, MACD and Awesome Oscillator, developed by Nenad Kerkez and simplified by me.
Scalping strategy (lower time frames)
Entry Position
Before we take a buy trade the two above criteria must be met. The 144 EMA must be above the 176 EMA and the 36 EMA must be above the 44 EMA. We then wait for AO to fall below the 0. The final „trigger‟ to the entry is when the MACD closes above the 0 line.
Sell trade is vice versa. 36 EMA must be below 44 EMA and 144 EMA must be below 176 EMA.
TAKE PROFIT and STOP LOSS
10-40 pips. Pivot Point targets.
STOP LOSS above/below last highest high
Enjoy!
@Zekis
Contrarian Scalping Entry Support v2.1This indicator is still making and testing now.
I don't recommend to use it without Pro / Prop TRADER.
// Copyright @ ALEX SHORT
// alpha tester : Norakichi Senpai (Santa Prop Norakichi Senpai)
// Special Thanks WBZ Trading Group
// This indicator support "Short term Fighting the tape Entry".
// Attension!!! I strongly reccomend to Verify effectiveness before "REAL TRADE".
// Note. Downtrend often continue compared to uptrend. So, you might have to change DFMA setting for it. Or you should change reasons/grounds for Scalping Long Entry in long DownTrend.
// Function1. Difference from moving average Arrow v 1.7 from SMA 200
// This indicator will plot chart Arrow above or below candle stick when DFMA marked over range.
// Function2. When price touch Quado_Bollinger band, background will change background and Circle Alert will plot above / below Candle stick.
