Average Daily Range ProjectionsCreates a trailing high and low projection based on the Average Daily Range.
Track the Session High and Low to determine the Daily Range.
Average the Daily Range by a fixed Period to create an Average Daily Range .
Track the Prior Daily Range .
Track the Current Daily Range .
Track the % of Range completion relative to the CDR & ADR(P).
From the Session Low, project an Average Daily Range High by adding the ADR.
From the Session High, project an Average Daily Range Low by subtracting the ADR.
When %R reaches 100% or greater, the ADR HI & LO will lock, showing the range break out or break down. As the Session High and Low create the Daily Range, observe the reaction of price as it reaches the limit of the expected daily range.
On strongly trending days, CDR is likely greater than PDR and ADR(P). Price can break away.
On ranging days, %R may fail to reach 100% and CDR may be lesser than PDR and ADR(P). Price can bounce around within the bounds of ADR HI & LO.
Wyszukaj w skryptach "range"

Morning RangeOverview
The Morning Range Indicator highlights the high and low of the market session from 6 AM to 10AM, providing key levels for potential breakout trades. The box dynamically updates in real-time, extending until 4 PM, and adjusts color based on price action.
This tool is ideal for traders looking to identify breakout opportunities and visualize key intraday price ranges.
How It Works
Session High & Low (6 AM - 10 AM)
The indicator tracks the highest high and lowest low within this time window.
Once 10 AM passes, the high and low are locked in and will not change.
Box Extends Until 4 PM
The session box remains visible throughout the trading day.
It provides a visual reference for potential breakout zones.
Dynamic Box Coloring
Gray (Neutral): Neither high nor low is broken.
Green: Only the high is broken before 4 PM.
Red: Only the low is broken before 4 PM.
Yellow: Both high and low are broken before 4 PM.
Live Updating Box
The box appears as soon as the session begins at 6 AM.
It dynamically updates the high and low until 10 AM.
Alerts for Breakouts
This indicator includes built-in alert conditions, so you can set up TradingView alerts without modifying the script.
Morning Range High Broken → Triggers when price breaks above the morning high.
Morning Range Low Broken → Triggers when price breaks below the morning low.
To set alerts:
Click the Alerts (⏰) icon in TradingView.
Select Condition → "Morning Range High Broken" or "Morning Range Low Broken".
Choose your preferred notification method (popup, email, webhook, etc.).
Click Create to activate the alert.
Who This Is For
✔ Intraday & Scalp Traders – Identify key breakout levels for short-term trades.
✔ Futures & Forex Traders – Works great for markets like NQ, ES, Gold, and FX pairs.
✔ Breakout & Reversal Traders – Use the high/low boundaries as support & resistance levels.
Customization
This indicator automatically updates every day and requires no manual input.
You can change alert settings via TradingView’s built-in alert system.
How to Use This Indicator
Watch for breakouts above/below the morning range as potential trade opportunities.
Combine with volume, momentum indicators, or footprint charts for confirmation.
Use the box color to visually assess whether price action is bullish (green), bearish (red), or ranging (gray).

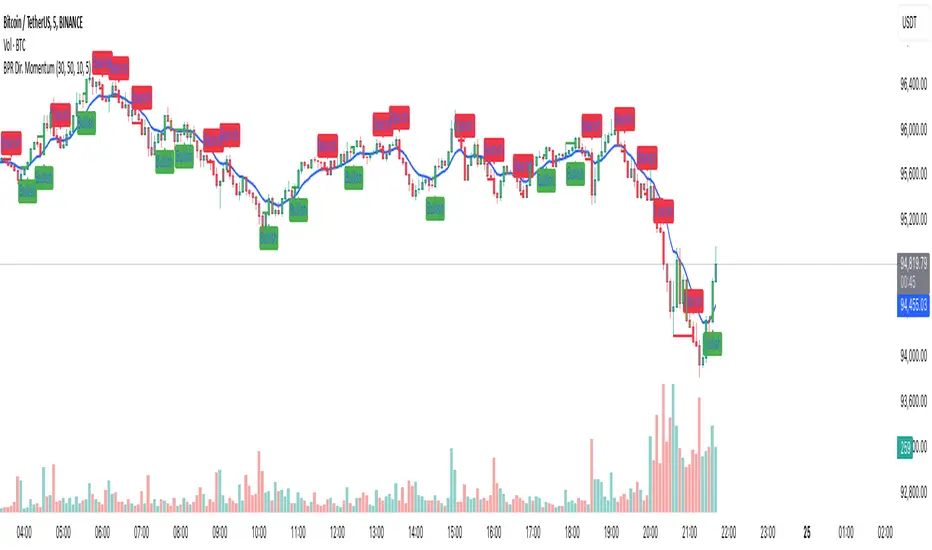
Balance Price Range (BPR) IndicatorOverview
The BPR with Directional Momentum-Filtered Breakouts indicator is designed to identify Balanced Price Ranges (BPR) and d etect high-probability breakouts and breakdowns with directional momentum confirmation . By leveraging historical BPR structures, EMA-based momentum filtering , and a trade cooldown mechanism , this script provides a structured approach to identifying potential trading opportunities while reducing false signals.
This invite-only indicator is ideal for traders who seek precise breakout confirmation, reduced noise, and trend-following logic while maintaining flexibility through adjustable parameters.
How It Works
The script follows a multi-step breakout detection process by integrating multiple key technical components:
1. Balanced Price Range (BPR) Detection:
• A Balanced Candle is identified when the price remains within a specific percentage of its range midpoint.
• These BPR zones represent areas of equilibrium , where a breakout or breakdown is likely to occur.
• The script historically tracks BPR levels across the entire chart to monitor price action around key areas.
2. Momentum-Filtered Breakout & Breakdown Logic:
• Bullish Breakout: Occurs when the price breaks above the historical BPR high with bullish momentum.
• Bearish Breakdown: Occurs when the price breaks below the historical BPR low with bearish momentum.
• Momentum Confirmation: Each breakout requires a strong directional move, measured against the Exponential Moving Average (EMA) .
• Only confirmed breakouts are marked, reducing the likelihood of false signals in choppy markets.
3. Candle-Based Background Visualization:
• Grey Background: Represents a Balanced Price Range (BPR), indicating potential breakout zones.
• Green Background: Indicates a Bullish Breakout when the price successfully breaks and holds above the BPR high.
• Red Background: Indicates a Bearish Breakdown when the price drops below the BPR low.
4. Trade Cooldown Mechanism:
• Prevents consecutive signals from triggering too frequently.
• Default cooldown period: 5 bars (adjustable).
• Ensures that trades are not clustered, improving signal quality.
5. EMA for Trend Direction & Confirmation:
• A 20-period EMA (default, adjustable) is used to confirm trade direction.
• Breakouts above the EMA align with uptrend continuation.
• Breakdowns below the EMA align with downtrend momentum.
Key Features
✔️ Historical BPR Detection – Tracks past BPR levels across the entire chart for structured breakout zones.
✔️ Momentum-Based Breakouts – Ensures breakouts are confirmed by directional price movement before generating signals.
✔️ Candle-Based Background Logic – Subtle candle highlights rather than full background fills, for better chart clarity.
✔️ Trade Cooldown Period – Prevents consecutive buy/sell signals within a defined period, improving signal efficiency.
✔️ Dynamic EMA Confirmation – Ensures trades align with the overall trend, reducing counter-trend trades.
✔️ Customizable Inputs – Adjust breakout thresholds, EMA length, and cooldown periods as per trading style.
✔️ Works Across Multiple Timeframes – Can be applied to intraday, swing, and positional trading strategies.
How to Use
1. Look for Balanced Price Ranges ( BPR )
• These zones highlight equilibrium areas where price is likely to break out.
• Grey-shaded candles indicate potential breakout zones.
2. Monitor for Bullish or Bearish Breakouts
• A green candle background signals a bullish breakout above BPR.
• A red candle background signals a bearish breakdown below BPR.
• The EMA filter helps confirm whether the breakout aligns with the prevailing trend.
3. Follow the Cooldown Logic
• After a breakout signal, wait for the cooldown period before another trade is allowed.
• This helps filter out noisy price action and prevents excessive trading.
4. Use Alongside Other Indicators
• Works well with volume analysis, support/resistance levels, and price action strategies.
• Can be combined with other momentum indicators for further trade confirmation.
Why This Combination?
Unlike generic breakout indicators, this script uniquely combines:
• BPR historical structures for defining potential breakout zones.
• Momentum-based breakout filtering using EMA confirmation.
• Trade cooldown logic to avoid excessive trading signals.
• Subtle candle-based highlights instead of cluttered full-background fills.
This structured approach makes the indicator more robust, adaptive, and reliable in different market conditions.
Why It’s Worth Using?
🔹 Avoid False Breakouts: Built-in momentum confirmation prevents weak or fake breakouts.
🔹 Clean Visualization: No excessive overlays—just precise, meaningful background coloring for breakouts.
🔹 Works in Any Market: Use on stocks, crypto, forex, indices, and commodities across different timeframes.
🔹 User-Friendly & Customizable: Fine-tune parameters to match individual trading styles.
⚠️ Note: This is an Invite-Only script. Access is granted to selected users.
✅ If you find it useful, consider incorporating it into your trend-following & breakout trading strategies.
🚀 Optimize your trading with structured breakout detection! 🚀
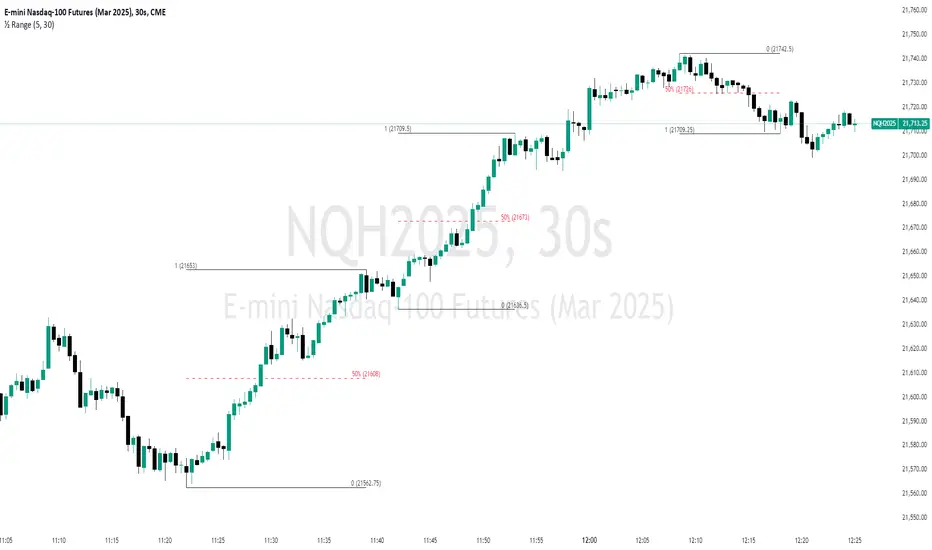
Unmitigated 50% of the RangeThis indicator is designed to display unmitigated 50% zones of price ranges within two swing (High and Low) points. The 50% level serves as a probable target for retracements before the price resumes its movement in the direction of the most recent swing. The underlying theory is that Price Action tends to correct unbalanced price zones by returning to 50% of the range.
The indicator identifies highs and lows utilizing the “Left Swing Sensitivity” setting, which detects the high/low points within the specified number of bars. It then ensures that the zone meets a minimum size requirement, configured via the “Minimum Leg Size” setting, to filter out smaller legs/zones that would not provide sufficient profit and loss opportunities for entries at 50% and take profit at the most recent swing point.
To prevent duplication of zones when the price is gradually moving up, an "Auto Adjust Levels" setting is available. Enabled by default, this feature automatically cleans up smaller zones, retaining only the primary zone between the most recent swing point and the outer swing.
Additionally, the indicator automatically removes mitigated zones where the price has returned to the 50% level, thus maintaining clean charts.
There are several visualization settings available, offering comprehensive control over what is displayed on the charts:
Control the color and style of the lines representing the 1, 0, and 50% levels.
Choose whether to display labels and if they should show the price at the rendered levels.
Optionally extend the lines/labels to the right for each level.
Market Open Range Breakaway v1.2Script Name: Market Open Range Breakaway 1.2
This TradingView script, "Market Open Range Breakaway," highlights the market's opening range for a user-selected day of the week. It calculates the high and low prices during a specified period after the market opens, plots these levels, and tracks the opening price. The script dynamically adjusts for time zones and only displays data during market hours on the chosen day, with optional background shading for the defined range period.
Purpose: Identifies and highlights the market's opening range for a selected day of the week.
Features: Calculates and plots the high, low, and open price during the market's opening range.
Configurable range duration (e.g., 15, 30, or 60 minutes).
Automatically adjusts for different time zones.
Displays levels only during market hours on the target day.
Optional background shading for the opening range.
Inputs: Target day of the week.
Opening range duration.
Use Case: Ideal for traders looking to analyze breakout levels or price movements around the opening range.

Multi-Timeframe RangeThe Multi-Timeframe Range Indicator is designed for traders looking to monitor key price levels across various timeframes (Daily, Weekly, Monthly, Quarterly, and Yearly) directly on their charts. This indicator draws boxes and mid-lines for each timeframe’s high, low, and midpoint, enabling users to visualize price ranges and assess potential areas of support and resistance more effectively.
Features:
Dynamic Range Boxes: Displays the high, low, and midpoint levels for each specified timeframe, with customizable colors for easy differentiation.
Visual Cues for Monday’s Levels: Highlights Monday’s high, low, and midpoint levels each week to support intraday trading setups and weekly trend analysis.
Multi-Timeframe Flexibility: Easily toggle between timeframes to view ranges from daily to yearly, making this indicator suitable for both short-term and long-term traders.
Ideal Use Cases:
Identify key support and resistance zones based on multiple timeframes.
Assess weekly and monthly trends using the Monday range levels.
Gain insights into market structure across various timeframes.

Swing Data - Optimized SK60
v. 1.83
indicator adjust to time frame.
This Pine Script code generates a trading indicator that calculates and displays various data points on a stock, including Average Daily Range (ADR%), Market Cap, Current Volume, Free Cash Flow (FCF) Yield %, Float %, whether moving averages (MA) are inline, and the moving averages of certain indexes like the Russell 2000, Nasdaq 100, and S&P 500. Here’s a breakdown of the script and how to use it.
Key Concepts and Functionality
Indicator Definition: The script begins by defining the indicator with a title (Swing Data - Optimized ADR%...) and short title (Optimized Swing Data), which will appear on the chart. The overlay=true command ensures that the indicator is drawn on the main price chart rather than in a separate pane.
Sector and Ticker:
s = syminfo.tickerid: This stores the ticker ID of the stock being analyzed.
sector = syminfo.sector: This retrieves the sector to which the stock belongs. If the sector information is unavailable, it assigns the value "N/A".
Dynamic Inputs: Several input parameters allow you to customize the indicator:
adrp_len: Defines the length for ADR% calculation.
len: Defines the moving average length for volume.
tbl_size, bg_col, and txt_col: Control the table's appearance, including the size of the text, background color, and text color.
posTable: Allows positioning of the table on the chart. Options include top-left, top-right, bottom-left, and bottom-right.
show_empty_row: Adds an empty row above the displayed values if set to true.
Volume Unit Handling (f_vol_unit): This function converts volume into appropriate units, like thousands (K), millions (M), or billions (B), to make volume easier to read. It’s applied to both the current volume and the average daily volume.
Moving Averages for Indexes (f_ma_indexes): This function calculates the 10-day, 20-day, 50-day, and 200-day simple moving averages (SMAs) for an index (such as Russell 2000 or Nasdaq 100). It also checks whether the MAs are inline, meaning if shorter MAs are above longer MAs, which is usually a bullish sign. It returns the result as "YES" or "NO" and assigns a color (green for yes, red for no).
Volume and Price Data: The script fetches several important data points:
vol_display: Current volume in human-readable units.
avgDaVol: Average daily volume.
adrp: Average Daily Range (ADR%) over a specified length.
fcf_yield_percent: Free Cash Flow Yield percentage.
ADR Calculation: The ADR% is calculated using the formula 100 * (ta.sma(high / low, adrp_len) - 1) and is fetched for the daily timeframe.
FCF Yield Color Logic: The Free Cash Flow yield is classified into three categories:
Green: Undervalued if FCF yield is over 5%.
Yellow: Neutral between 2-5%.
Red: Overvalued if below 2%.
MA's Inline Check for the Stock: The script checks if the stock's 10-day, 20-day, 50-day, and 200-day moving averages are inline (i.e., in a bullish alignment where shorter MAs are higher than longer MAs).
Float % Calculation: The float percentage is calculated as the ratio of float shares outstanding (FSO) to total shares outstanding (TSO). The color is set based on its breakout potential:
Red: Below 20% (manipulation risk).
Green: 20-50% (ideal breakout range).
Yellow: Above 50%.
Price Change %: The script calculates the percentage change in price between the current and previous close.
Volume Color Logic: The color of the "Current Volume" is based on whether it indicates buying or selling pressure:
Green: Volume is higher than average, and the price increased more than ADR%.
Red: Volume is higher than average, and the price decreased more than ADR%.
Yellow: Default color if neither condition is met.
Market Cap: The market cap is calculated by multiplying the total shares outstanding (TSO) by the current close price, and it’s displayed in a human-readable unit (K, M, or B).
Display Table:
A table is created to display all the calculated data in an organized manner. It includes fields for Market Cap, Avg Volume, ADR%, Current Volume, FCF Yield %, Float %, MA's Inline status, and Sector. Additionally, it shows the inline status for the Russell 2000, Nasdaq 100, and S&P 500.
How to Use:
Customization: Users can customize the inputs, including the length of ADR% and volume moving averages, and adjust the table size, text color, and position.
Visualization: The indicator provides a comprehensive table on the chart showing key data points for technical analysis, including whether moving averages are inline for both the stock and major indexes.
This indicator is particularly useful for swing traders or technical analysts who want a clear overview of a stock’s volume, volatility (via ADR%), and the alignment of moving averages, combined with fundamental metrics like market cap and free cash flow yield.

ICT Balance Price Range [UAlgo]The "ICT Balance Price Range " indicator identifies and visualizes potential balance price ranges (BPRs) on a price chart. These ranges are indicative of periods where the market exhibits balance between bullish and bearish forces, often preceding significant price movements.
🔶 What is Balanced Price Range (BPR) ?
Balanced Price Range is a concept based on Fair Value Gap. Balanced price range (BPR) is the area on price chart where two opposite fair value gaps overlap.
When price approaches the Balanced Price Range (BPR), we assume that the price will react quickly and strongly here. This is because its the combination of two fair value gaps and being a good point of interest for smart money traders.
🔶 Key Features:
Bars to Consider: Determines the number of bars to evaluate for BPR conditions.
Threshold for BPR: Sets the minimum range required for a valid BPR to be identified.
Remove Old BPR: Option to automatically remove invalidated BPRs from the chart.
Bearish/Bullish Box Color: Customizable colors for visual representation of bearish and bullish BPRs.
🔶 Disclaimer
This indicator is provided for educational and informational purposes only.
It should not be considered as financial advice or a recommendation to buy or sell any financial instrument.
The use of this indicator involves inherent risks, and users should employ their own judgment and conduct their own research before making any trading decisions. Past performance is not indicative of future results.
🔷 Related Scripts
Fair Value Gaps (FVG)

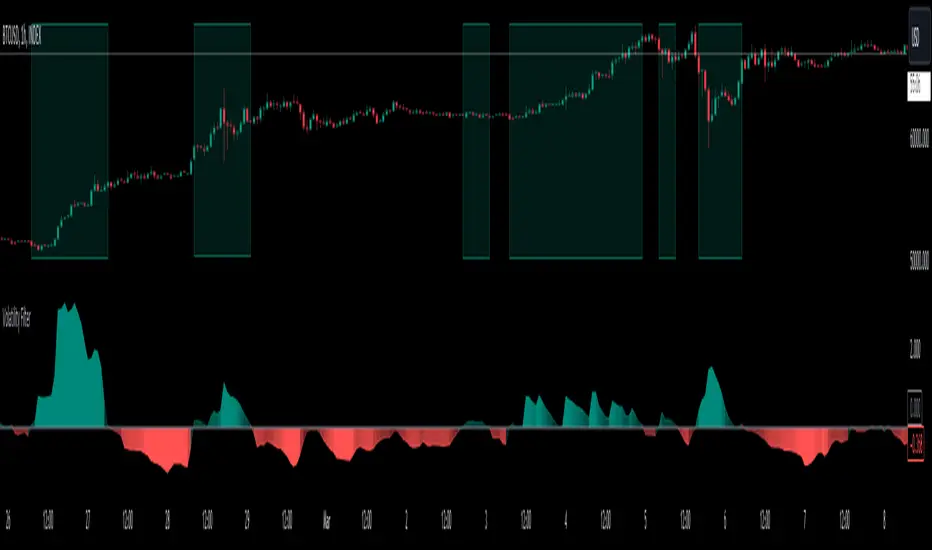
Volatility Filter v2VF v2 is a new iteration of my tool designed for traders who wish to gain a deeper understanding of market dynamics, specifically to distinguish periods of high volatility, which often correspond to strong market trends. By identifying these periods, traders can make more informed decisions, potentially leading to better trading outcomes.
Understanding Market Volatility:
At the heart of this script lies the concept of market volatility, a statistical measure reflecting the degree of variation in trading prices. Volatility is pivotal for traders; it provides insights into the market's emotional state, indicating periods of uncertainty or confidence. High volatility often correlates with strong trends, making it a critical indicator for trend-followers. By identifying when volatility crosses a certain threshold, traders can discern whether the market is likely to be in a trending phase or a more subdued, range-bound state.
How the Script Works:
The core functionality of the script revolves around a signal line that oscillates around a zero threshold. When the signal line is above zero, it indicates increased market volatility, suggesting the presence of a trend. The farther the oscillator deviates from zero, the stronger the implied trend. This mechanism enables traders to visually gauge market conditions and adjust their strategies accordingly.
Controlling the Indicator:
To cater to diverse trading styles and preferences, the script is equipped with several customizable settings:
Filter Threshold: This 'zero line' acts as the baseline for distinguishing between different volatility regimes. Crossing this threshold is a primary signal for changes in market volatility.
Moving Average Type: With over 30 types of moving averages to choose from, traders can select the one that best fits their analysis style. Each type offers a different perspective on price data, allowing for a tailored approach to trend identification.
Colorize Indicator: This feature enhances the visual representation of the indicator, making it easier to interpret. When enabled, the oscillator's color intensity varies with its proximity to the extremes, providing a quick visual cue about trend strength.
Advanced Settings – Length and Multiplier:
The script introduces an innovative approach to time frame analysis through its length and multiplier settings:
Length: This parameter sets the base period for all metrics within the script, similar to traditional indicators.
Multiplier: This unique feature differentiates the script by incorporating three distinct timeframes into the analysis: a lower timeframe, the main (current) timeframe, and a higher timeframe. The multiplier adjusts these timeframes relative to the main one. For instance, with a daily main timeframe and a multiplier of 2, the lower timeframe would be 12 hours, and the higher timeframe would be 2 days. This tri-timeframe approach aims to provide a more comprehensive volatility assessment.
Volatility Filter Indicators Section:
The script utilizes nine different, undisclosed metrics within its volatility filter. Traders have the flexibility to enable or disable these metrics based on their preferences, allowing for a customizable trading experience. Additionally, the script offers alert functionality for when the indicator crosses the threshold, either upwards or downwards, facilitating timely decision-making.
P.S
With better understanding of markets over time, I designed a new iteration of my volatility filter indicator. The second version provides faster, more precise way to analyze markets, but I also wanted to keep my first version untouched in case if some people find it better for their purposes. As I mentioned above, this version is calculated in a very different way from a previous one, so if you never tried it you can do it here
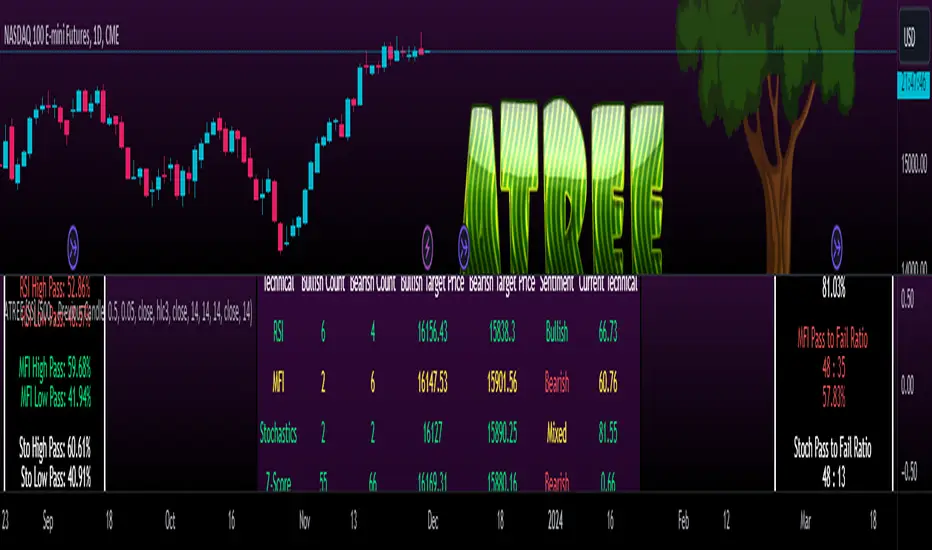
Advanced Technical Range and Expectancy Estimator [SS]Hello everyone,
This indicator is a from of momentum based probability modelling. It is derived from my own approaches to probability modelling but just simplified a bit.
How it works:
The indicator looks at various technical, including stochastics, RSI, MFI and Z-Score, to determine the likely sentiment. All of these, with the exception of Z-Score, are momentum based indicators and can alert us to likely sentiment. However, instead of us making the subjective determination ourselves as to whether the RSI or MFI or Stochastics are bullish, the indicator will look at previous instances of these occurrences, and tally the bullish and bearish follow throughs that happened. It will also calculate the average target price that was hit, under similar conditions, on the same timeframe.
The Z-Score is your "tie breaker". It is not a momentum based indicator and measures something a little different (the standard deviation and over-extension of the stock). For this reason, it provides an alternative assessment and tends to be a bit more reliable in times of low momentum.
Back-test Results:
The indicator back-tests itself over the previous 100 candles. I have limited it to 100 candles for pragmatic considerations (it has to back-test each technical individually and increasing the BT length will slow and potentially error out the indicator) as well as accuracy considerations.
One thing I have noticed in my years of trying to crack the code and develop probability models for tickers, is historical accuracy doesn't always matter because sentiment is always changing. You need to see what it has done over the most recent 100 to 200 candles.
There are two back-test windows, one for the price targets and the other for the sentiment accuracy. The most effective/most accurate will highlight green, the least effective/least accurate will highlight red:
In the image above, you can see that the most accurate predictor of sentiment is Z-Score, with a 90.32% accuracy rate over the past 100 candles.
The most accurate predictor of price is MFI, with a 60% (for bull targets) and 42% (for bear targets)accuracy rate.
Anchoring Points:
The indicator permits you to anchor by two points. The default setting is anchoring by previous candle. If you plan to use this as an oscillator, to see the current prediction for the current candle you are viewing, then you will need to leave this default setting. It will pull the data from the previous candle and give you the data for the current candle you are on.
If you are assess the likely sentiment for the next day after the day has closed off, you will want to anchor by current candle. This will take the current technicals that the day has closed off with and run the assessment for you.
Customizability
You can customize the technicals by source and length of assessment.
They are all defaulted to the traditional settings of these indicators, but if you want to customize your model to try and improve or enhance accuracy in one way or another, you are free and able to do so!
I do suggest leaving the defaults as they seem to work particular well :-).
Thresholds
Thresholds are the tolerance levels that we permit for our technical search range. If you want them to be exactly identical, then you can set it to 0. If you want it to be extremely similar, you can set it to 0.01. This will hone in on the ranges you are interest in and you can see how it affects your accuracy by reviewing the results in the back-test tables.
Keep Static Colour Option
I want to make a quick note on the "Keep Static Colour" option that is in your settings menu.
The primary table that shows you the probability and price targets change colours based on the accuracy of the assessment. This is so, if you are using a mobile device or smaller screen and can't have the back-test results open at the same time, you can see still which are the most reliable results. However, if you have the back-test tables open and you find these colour changes too distracted, you can toggle on the "Keep Static Colour" and it will resort the colour of the table to a solid white:
Show Technicals
The indicator can show you the current technical values if you are using it in place of an oscillator. Its less pivotal as its making the assessment for you, but just for your reference if you want to see what the current MFI, Z-Score or Stochastics etc. are, you have that option as well.
All Timeframes Permitted
You can view Weekly, Monthly, Hourly, 5 minute, 1 minute, its all supported!
That's the indicator in a nutshell.
Hope you enjoy and leave your questions below.
Safe trades everyone!
ADR % RangesThis indicator is designed to visually represent percentage lines from the open of the day. The % amount is determined by X amount of the last days to create an average...or Average Daily Range (ADR).
1. ADR Percentage Lines: The core function of the script is to apply lines to the chart that represent specific percentage changes from the daily open. It first calculates the average over X amount of days and then displays two lines that are 1/3rd of that average. One line goes above the other line goes below. The other two lines are the full "range" of the average. These lines can act as boundaries or targets to know how an asset has moved recently. *Past performance is not indicative of current or future results.
The calculation for ADR is:
Step 1. Calculate Today's Range = DailyHigh - DailyLow
Step 2. Store this average after the day has completed
Step 3. Sum all day's ranges
Step 4. Divide by total number of days
Step 5. Draw on chart
2. Customizable Inputs: Users have the flexibility to customize the script through various inputs. This includes the option to display lines only for the current trading day (`todayonly`), and to select which lines are displayed. The user can also opt to show a table the displays the total range of previous days and the average range of those previous days.
3. No Secondary Timeframe: The ADR is computed based on whatever timeframe the chart is and does not reference secondary periods. Therefore the script cannot be used on charts greater than daily.
This script is can be used by all traders for any market. The trader might have to adjust the "X" number of days back to compute a historical average. Maybe they only want to know the average over the past week (5 days) or maybe the past month (20 days).

Narrow Range StrategyNarrow Range Strategy :
INTRODUCTION :
This strategy is based on the Narrow Range Day concept, implying that low volatility will generate higher volatility in the days ahead. The strategy sends us buy and sell signals with well-defined profit targets. It's a medium/long-term strategy. There's also a money management method that allows us to reinvest part of the profits or reduce the size of orders in the event of substantial losses.
NARROW RANGE (NR) DAY :
A Narrow Range Day is a day in which price variations are included in those of a specific day some time before. The high and low of this specific day form the "reference range". In general, we compare these variations with those of 4 or 7 days ago. The mathematical formula for finding an NR4 is :
If low > low(4) and high < high(4) :
nr = true
This implies that the current low is greater than the low of 4 days ago, and the current high is smaller than the high of 4 days ago. So today's volatility is lower than that of 4 days ago, and may be a sign of high volatility to come.
PARAMETERS :
Narrow Range Length : Corresponds to the number of candles back to compare current volatility. The default is 4, allowing comparison of current volatility with that of 4 candles ago.
Stop Loss : Percentage of the reference range on which to set an exit order to limit losses. The minimum value is 0.001, while the maximum is 1. The default value is 0.35.
Fixed Ratio : This is the amount of gain or loss at which the order quantity is changed. The default is 400, which means that for each $400 gain or loss, the order size is increased or decreased by an amount chosen by the user.
Increasing Order Amount : This is the amount to be added to or subtracted from orders when the fixed ratio is reached. The default is $200, which means that for every $400 gain, $200 is reinvested in the strategy. On the other hand, for every $400 loss, the order size is reduced by $200.
Initial capital : $1000
Fees : Interactive Broker fees apply to this strategy. They are set at 0.18% of the trade value.
Slippage : 3 ticks or $0.03 per trade. Corresponds to the latency time between the moment the signal is received and the moment the order is executed by the broker.
Important : A bot was used to test NR4 and NR7 with all possible Stop Losses in order to find out which combination generates the highest return on BITSTAMP:ETHUSD while limiting the drawdown. This strategy is the most optimal with an NR4 and a SL of 35% of the reference range size in 5D timeframe.
BUY AND SHORT SIGNALS :
When an NR is spotted, we create two stop orders on the high and low of the reference range. As soon as there's a breakout from this reference range (shown in blue on the chart), we open a position. We're LONG if there's a breakout on the high and SHORT if there's a breakout on the low. Executing a stop order cancels the second stop order.
RISK MANAGEMENT :
This strategy is subject to losses. We manage our risk with Stop Losses. The user is free to enter a SL as a percentage of the reference range. The maximum amount risked per trade therefore depends on the size of the range. The larger the range, the greater the risk. That's why we have set a maximum Stop Loss to 10% to limiting risks per trade.
The special feature of this strategy is that it targets a precise profit objective. This corresponds to the size of the reference range at the top of the high if you're LONG, or at the bottom of the low if you're short. In the same way, the larger the reference range, the greater the potential profits.
The risk reward remains the same for all trades and amounts to : 100/35 = 2.86. If the reference range is too high, we have set a SL to 10% of the trade value to limit losses. In that case, the risk reward is less than 2.86.
MONEY MANAGEMENT :
The fixed ratio method was used to manage our gains and losses. For each gain of an amount equal to the value of the fixed ratio, we increase the order size by a value defined by the user in the "Increasing order amount" parameter. Similarly, each time we lose an amount equal to the value of the fixed ratio, we decrease the order size by the same user-defined value. This strategy increases both performance and drawdown.
NOTE :
Please note that the strategy is backtested from 2017-01-01. As the timeframe is 5D, this strategy is a medium/long-term strategy. That's why only 37 trades were closed. Be careful, as the test sample is small and performance may not necessarily reflect what may happen in the future.
Enjoy the strategy and don't forget to take the trade :)

20/200MAs+LTF+4HTF and HighLowBox+3HTF20/200MAs
Shows 20 and 200 MAs in each TFs(tfChart,1 Lower and 4 Higher).
TFs:
current TF
Lower TF (default: lower1)
Higher TF1 (default: higher1)
Higher TF2 (default: higher1)
Higher TF3 (default: higher1)
Higher TF4 (default: higher1)
MAs:
20MA (default: sma)
1st 200MA (default: sma)
2nd 200MA (default: ema)
VWAP (optional)
HighLowBox+3HTF
Enclose in a square high and low range in each timeframe.
Shows price range and duration of each box.
In current timeframe, shows Fibonacci Scale inside(23.6%, 38.2%, 50.0%, 61.8%, 76.4%)/outside of each box.
Outside(161.8%,261.8,361.8%) would be shown as next target, if break top/bottom of each box.
1st box for current timeframe.
2nd box for higher timeframe.(default: higher1)
3rd box for higher timeframe.(default: higher2)
4th box for higher timeframe.(default: higher3)
static timeframes can also be used.

HighLowBox 1+3TF Enclose in a square high and low range in each timeframe.
Shows price range and duration of each box.
In current timeframe, shows Fibonacci Scale inside(23.6%, 38.2%, 50.0%, 61.8%, 76.4%)/outside of each box.
Outside(161.8%,261.8,361.8%) would be shown as next target, if break top/bottom of each box.
1st box for current timeframe.(default: Chart)
2nd-4th box for higher timeframes.(default: higher1,higher2,higher3)
static timeframes can also be used.
Volatility Range Breakout Strategy [wbburgin]The "Volatility Range Breakout Strategy" uses deviations of high-low volatility to determine bullish and bearish breakouts.
HOW IT WORKS
The volatility function uses the high-low range of a lookback period, divided by the average of that range, to determine the likelihood that price will break in a specific direction.
High and low ranges are determined by the relative volatility compared to the current closing price. The high range, for example, is the (volatility * close) added to the close, the low range is this value subtracted by the close.
A volatility-weighted moving average is taken of these high and low ranges to form high and low bands.
Finally, breakouts are identified once the price closes above or below these bands. An upwards breakout (bullish) occurs when the price breaks above the upper band, while a downwards breakout (bearish) occurs when the price breaks below the lower band. Positions can be closed either by when the price falls out of its current band ("Range Crossover" in settings under 'Exit Type') or when the price falls below or above the volatility MA (default because this allows us to catch trends for longer).
INPUTS/SETTINGS
The AVERAGE LENGTH is the period for the volatility MA and the weighted volatility bands.
The VOLATILITY LENGTH is how far the lookback should be for highs/lows for the volatility calculation.
Enjoy! Let me know if you have any questions.

Stockbee Momentum BurstThis is a script to color code bars based on the bullish- and bearish combination.
Bullish Combination
Percent: Price >= 4% from yesterday and Volume today > Yesterday
Dollar: Price >= 0.9 dollar from open
Base Requirements
- Price > Yesterday's close
- Price > Open
- Price is within 30% of high
- Todays price range >= Yesterdays price range
- Yesterday's move <= 2%
- Volume >= 100 000
Bearish Combination
Percent: Price <= 4% from yesterday and Volume today > Yesterday
Dollar: Price <= 0.9 dollar from open
Base Requirements
- Price < Yesterday's close
- Price < Open
- Price is within 30% of low
- Todays price range >= Yesterdays price range
- Yesterday's move >= -2%
- Minimum volume for each of last 3 days >= 100 000
Momentum Filter
These are based on the 10 and 20 EMA crossover, where the former above would indicate upward momentum and below downward momentum. This can help to narrow down the color code to continuation phases. The linked option will override all other momentum filters, bullish candles will be displayed when EMA 10 > 20 and bearish candles when EMA 10 < 20.

ATR+ Advanced Sessions ATR for DaterangeATR+ Advanced Sessions ATR for Daterange
The ATR+ adds the following additional filters to the stock ATR indicator by Tradingview:
- Calculates the overall average ATR for a user defined daterange, optionally filtered by trading session and selected weekdays, presented as a secondary line over the standard ATR line.
- Basic ATR line, with colour highlight to indicate the selected sessions, days and timeframe being calculated by the average ATR+ line.
- Average ATR+ line indicating the average of all ATRs within the defined timeframe, optionally filtered by instances of a selected trading session and selected weekdays.
- Customisable appearance.
- The ATR+ also includes the basic ATR configuration options typically found in the standard ATR by Tradingview, including period length and smoothing type. Defaults are set to the factory standards: 14 length, RMA smoothing type.
What Is the Average True Range (ATR)?
The ATR is a technical analysis tool that measures market volatility by decomposing the entire range asset price for that period. Investopedia describes the ATR as follows:
"The average true range (ATR) is a technical analysis indicator, introduced by market technician J. Welles Wilder Jr. in his book New Concepts in Technical Trading Systems, that measures market volatility by decomposing the entire range of an asset price for that period.
The true range indicator is taken as the greatest of the following: current high less the current low; the absolute value of the current high less the previous close; and the absolute value of the current low less the previous close. The ATR is then a moving average, generally using 14 days, of the true ranges."
For more information on the ATR and its calculations and use cases, see here:
Investopedia link here.
Tradingview link here.
Note
The indicator may time out if the number of bars being calculated is too long. If this happens, you will need to reduce the datetime range, or increase the chart timeframe in order to reduce the number of bars being calculated and the indicator will attempt to recalculate.

3C Reversal Filter v1In essence, this strategy is a heavily smoothed range filter.
This strategy includes a backtester and ability to connect it with your 3 commas bot(See adviced settings below)
The calculation steps below gives an example on how signals are made:
1. Calculating the price movement using ATR, % change, standard deviation etc..
2. Obtaining the smoothed price using SMA.
3. Obtaining the absolute value of the bar-to-bar change.
4. Applying EMA, twice, to the values in step 3.
5. Obtaining the slow trailing line by multiplying the result of step 4 by 1.618.
Think of it as a heavily smoothed price range
If the 1.618 value looks familiar, that’s because it’s used in Fibonacci sequences. You can of course experiment with other values. I’ve seen good results with both 2.618 and 4.236
What does the strategy do?
1. Determine Trend Detection
2. Detect Short-Term Momentum
3commas settings:
-For now you can only use simple bots.
-Create LONG and SHORT bots for the coins you like to trade and set up alerts(You can send long and short signal from the same alert)
-Set TP to 50% the strategy will handle buys and exits based on your inputs.
-Set safety orders to 0. I might add DCA to the strategy if testing proves that to be a good solution.
-When you have made the bots input the bot ID and token adress in the settings of the strategy.
-When creating the alert use this webhook :https://3commas.io/trade_signal/trading_view
-In the message field you use {{strategy.order.alert_message}} as the placeholder.

Dual Fibonacci Zone & Ranged Vol DCA Strategy - R3c0nTraderWhat does this do?
This is for educational purposes and allows one to backtest two Fibonacci Zones simultaneously. This also includes an option for Ranged Volume as a parameter.
Pre-requisites:
First off, this is a Long only strategy as I wrote it with DCA in mind. It cannot be used for shorting. Shorting defeats the purpose of a DCA bot which has a goal that is Long a position not Short a position. If you want to short, there are plenty of free scripts out there that do this.
You must have some base knowledge or experience with Fibonacci trading, understanding what is ADX, +DI (and -DI), etc.
You can use this script without a 3Commas account and see how 3Commas DCA Bot would perform. However, I highly recommend inexperienced uses get a free account and going through the tutorials, FAQ's and knowledgebase. This would give you a base understanding of the settings you will see in this strategy and why you will need to know them. Only then should you try testing this strategy with a paper bot.
Background
After I had created and released "Fibonacci Zone DCA Strategy", I began expanding and testing other ideas.
The first idea was to add Ranged Volume to the Fibonacci Zone DCA strategy which I wanted for providing further confirmation before entering a trade. The second idea was to add a second Fibonacci Zone that was just as configurable as the first Fibonacci Zone. I managed to add both and they can be easily enabled or disabled via the strategy settings menu.
Things Got Real Interesting
Things got real interesting when I started testing strategies with two Fibonacci zones. Here's a quick list of what I found I was able to do:
Mix and match exit strategies. I could set the Fib-1 zone strategy to exit with a take profit % and separately set the Fib-2 zone strategy to exit when the price crosses the top-high fib border
Trade the trend. A common phrase amongst traders is "the Trend is your friend" and with the help of an additional Fib Zone, I was able to trade the trend more often by using two different Fib Zone strategies which if configured properly can shorten time to re-deploy capital, increase number of closed trades, and in some cases increase net profit.
Trade both bull market uptrends and bear market downtrends in the same strategy. I found I could configure one Fib Zone strategy to be really good in uptrends and another Fib Zone strategy to be really good in downtrends. In some cases, with both Fib Zone strategies enabled together in a single strategy I got better results than if the strategies were backtested separately.
There are many other trade strategies I am finding with this. One could be to trade a convergence or divergence of the two different Fib Zones. This could possibly be achieved by setting one strategy to have different Fibonacci length.
Credits:
Thank you "EvoCrypto" for granting me permission to use "Ranged Volume" to create this strategy
Thank you "eykpunter" for granting me permission to use "Fibonacci Zones" to create this strategy
Thank you "junyou0424" for granting me permission to use "DCA Bot with SuperTrend Emulator" which I used for adding bot inputs, calculations, and strategy

Asteroid Belt SpaceManBTCAsteroid Belt SpaceManBTC
Asteroid Belt is a trend analysis tool that provides 3 areas of importance, upper, lower, and main belt. The belts provide areas
of key interest that will likely cause a reaction on any asset that is being charted.
Within The Belt
There are 2 ways to play the belt, when trending in either direction, entering the belt can be seen as an area to buy a pullback, providing a strong entry in the trend. The Upper Belt will suffice in the strongest of trends, the middle of the belt indicates a trend that is still strong. A tap of the lowest belt is a weaker trend but often the bottom of any uptrend.
The other way to play the belt from within is play the range from one belt to the other usually the lower belt to the upper belt for a full range play is successful and the mid belt should be used to take partial profits/determine the strength of the move to the other side of the belt.
Responsiveness
3 Types of responsiveness, Fast, Slow and Normal. Slow being the default as its my preffered. The Slow belt will highlight entries with higher probability of causing reaction.
Normal is the best for reliable entries with less patience, it can be recommended for those who are faster to react to directional changes.
Fast belt should only really be used on the Higher timeframe trends as their pull backs can take significantly longer and therefore provides a reliable entry for a quicker than usual high time frame execution.
Dynamic Colors
This is a simple calculation which will be advanced in the future, it can be used to determine the strength of a trend in the belt, highlighting uptrend and downtrends when enabled. Can be disabled in settings.
Auto Aggregator is the primary difference by providing its own calculations very different to how previous auto calculations have worked in spacemanbtc indicators, this aggregator is a work in progress but should produce results that can be replicated accross all coins. Doing so allows for chart by chart switching and is useful for anyone who is in need of quick trend analysis. This can be disabled for manual fine tuning. On by default for new users to learn with.
To Do:
Add outer reversion belts for a full trading system.
Improve dynamic coloring logic.
Improve Auto Aggregator logic.

Rescaled RangeRescaled Range is an implementation of the fractal rescaled ranges developed by Harold Edwin Hurst and Benoit Mandlebrot.
Settings include:
“Window Size” - the number of time periods in a window over which price changes are analyzed. This will generally correspond to your trading horizon and defaults to 15.
“Number of Windows” - the number of “Window Size” intervals to average the rescaled range value over. By looking at a number of such periods, the study captures potential volatility that may have occurred in the recent past. This should be set long enough to capture the current trend (defaults to 63), but not so long to include volatility regimes no longer in play.
Each window in the average is offset by 1 time period from the the others - like a moving average.
This study plots two lines - “Rescaled Range High” which indicates overbought conditions when the price moves above it and “Rescaled Range Low” which indicates oversold conditions when the price moves below it.
This study builds upon the bridge range work of Joe Catanzaro (joecat808) and Caleb Sandfort (calebsandfort). Bridge ranges are used to position the rescaled range with respect to the closing price.
Note: Your time series must have (Window Size + Number of Windows) or more periods of data to complete this study. For example, using the defaults, your time series should have (15+63) = 78 periods or more of data.

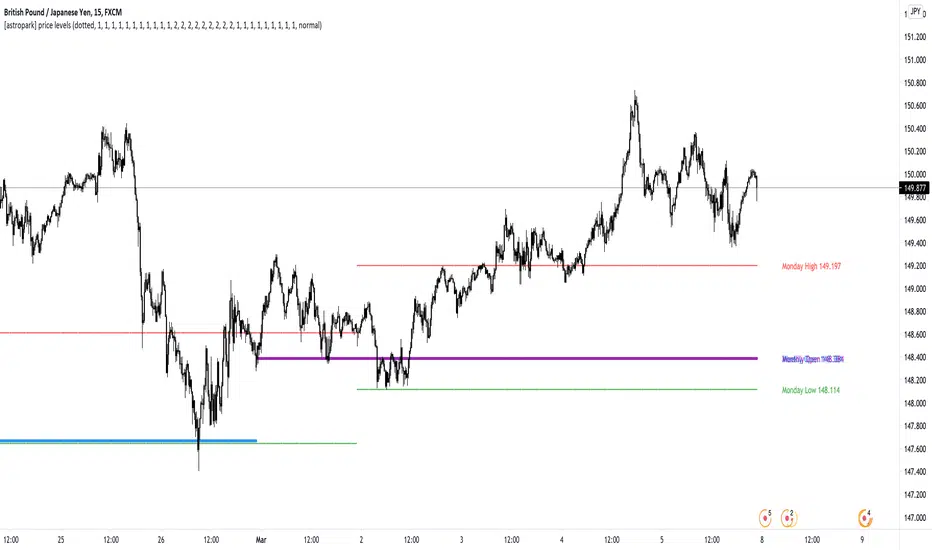
[astropark] price levelsDear Followers,
today another awesome Analysis Tool, that you can use in your trading journey: Price Levels !
Are you a range trading player? a scalper? or maybe a day-trader or a swing-trader? This is for you then. Indeed it's for everyone.
This indicator works on every timeframe, market and pair.
It keeps track of recent important levels generated by price action:
Monday high, low and middle range level
Tuesday high and low
Wednesday high and low
Thursday high and low
Friday high and low
Weekly open, high and low
Monthly open, high and low
Yearly open, high and low
Previous weekly open, high and low
Previous monthly open, high and low
Previous yearly open, high and low
You can:
choose price levels to hide and show
change each level color / thickness / display style (solid or dotted)
choose to show or hide price labels and change their size
Why such indicator should be helpful? How can I use it to do profit?
In multiple ways! Let's talk about Monday Range :
when Monday range is formed, price acceptance below Monday low is a bearish signal, so will more likely want to short / sell
equally price acceptance above Monday high is a bullish signal, so will more likely want to long / buy
it can happen that Monday high is simply retested, with price not being able to stay above it: this is called a retest (in case of a simple wick) or a deviation (in case of price staying above the level just for some candles) and what usually happens is price falling back to Monday middle range level and even back to Monday low.
the opposite can happen of course: you will become bullish if Monday low is tested or a deviation appears below Monday low: price tends to bounce on such occasions back to Monday middle range or even Monday high
Tuesday is usually a marker day within a trading week:
if Monday was pretty bullish, Tuesday high may mark the weekly top, following some red days
if Monday was pretty bearish, Tuesday low may mark the weekly bottom, following some green days
Thursday is the day when big players start to take profits, as the trading week is going to end the next day, so in an all-green week Thursday may be a red one, while in an all-red week it may be a bullish day
Thursday is the day when big players start to take profits, as the trading week is going to end the next day:
in an all-green week, Thursday may be a red one and it's low tends to mark the weekly low
while in an all-red week, it tends to be a bullish day, so here you will refill your shorts for the next blooding day
Let's talk now about the Weekly, Monthly and Yearly price levels : here it is the interesting part for Swing Traders
Weekly open is usually a defining level: on retest, if price keeps staying below then more downside is expected, if price keeps staying above then more upside is expected (similarly to what we said about Monday high and low)
Monthly and Yearly open price levels are usually a "no-brainer" buy level in a bullish trend or equally a sell level in a bearish trend: in this scenarios, a deviation structure is even more powerful in term of price reaction and efficiency
We trade Weekly, Monthly and Yearly high and low price levels as explained for the Monday high and low, but with a swing traders perspective (so a medium-long term trade)
Previous Weekly/Monthly/Yearly price levels are usually very useful as targets in your trades
Here below some screenshots that resumes what said above.
Weekly Open as support (bullish) and Monday High deviation (bearish)
Tuesday High, Weekly Open failing as support: bearish
Monday Low deviation (bullish)
Price Acceptance above Monday High and Weekly Open (bullish)
Yearly Open retests as buy opportunities
Deviation below Monthly Open (bullish), Price Acceptance below Monthly and Yearly Open (bearish)
This is a premium indicator , so send me a private message in order to get access to this script.
Consolidation Ranges [kingthies] Consolidation Range Analysis
Published by Eric Thies, January 2021
█ Indicator Summary
This tool calculates, analyzes and plots the visualization of a relative range over a given period of time
By adding to charts, users are enabled to see the impulsive nature of market cycles, along with their efforts to consolidate thereafter
The default period is 30, and should be adjusted to users preference
The default input is the current close price, on the chosen timeframe of the chart
█ Script Source
//
//@version=4
//© kingthies || This source code is subject to the terms of the Mozilla Public License 2.0 at mozilla.org
study("Consolidation Ranges ", shorttitle="CR ", overlay=true)
// !<------ User Inputs ----->
src = input(close, title='Range Input (Default set to Close'), lengthEMA=input(30,title='Length'),zoneToggle = input(true, title="Toggle Zone Highlights"), iCol = color.new(#FFFFFF, 100),
// !<---- Declarations & Calculations ---- >
trndUp = float(na),trndDwn = float(na), mid = float(na), e = ema(src, lengthEMA)
trndUp := src < nz(trndUp ) and src > trndDwn ? nz(trndUp ) : high, trndDwn := src < nz(trndUp ) and src > trndDwn ? nz(trndDwn ) : low, mid := avg(trndUp, trndDwn)
// !< ---- Plotting ----->
highRange = plot(trndUp == nz(trndUp ) ? trndUp : na, color=color.white, linewidth=2, style=plot.style_linebr, title="Top of Period Range")
lowRange = plot(trndDwn == nz(trndDwn ) ? trndDwn : na, color=color.white, linewidth=2, style=plot.style_linebr, title="Bottom of Period Range")
xzone = plot(zoneToggle ? src > e ? trndDwn : trndUp : na, color=iCol, style=plot.style_circles, linewidth=0, editable=false)
fill(highRange, xzone, color=color.lime,transp=70), fill(xzone, lowRange, color=color.red,transp=70)
//
