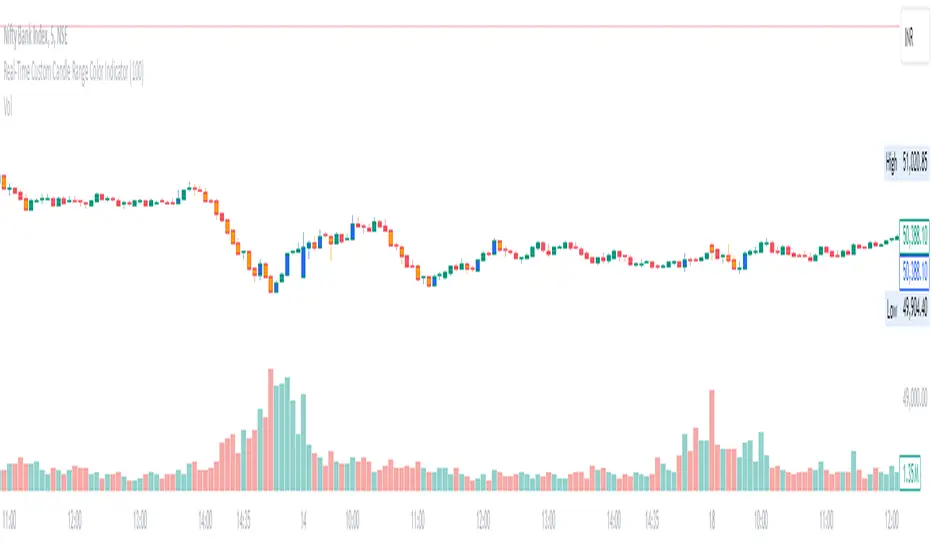
Real-Time Custom Candle Range Color Indicator
The script allows the user to input a custom range value (default set to 100 points) through the userDefinedRange variable. This value determines the minimum range required for a candle to change color.
Calculating Candle Range:
The script calculates the range of each candle by subtracting the low from the high price.
Determining Bullish or Bearish Candles:
It checks whether the close price is higher than the open price to determine if a candle is bullish (isBullish variable).
Coloring Candles:
Based on the custom range input, the script changes the color of the candles:
If the candle's range is greater than or equal to the custom range and it is bullish, the candle color is set to blue (bullishColor).
If the range condition is met and the candle is bearish, the color is set to orange (bearishColor).
If the range condition is not met, the color is set to na (not applicable).
Plotting Colored Candles:
The plotcandle function is used to plot candles with colors based on the custom range and bullish/bearish conditions. The candles will have a higher z-order to be displayed in front of default candles.
Displaying High and Low Price Points:
Triangular shapes are plotted at the high and low price levels using the plotshape function, with colors representing bullish (blue) and bearish (orange) conditions.
In trading, this indicator can help traders visually identify candles that meet a specific range criteria, potentially signaling strength or weakness in price movements. By customizing the range parameter, traders can adapt the indicator to different market conditions and trading strategies. It can be used in conjunction with other technical analysis tools to make informed trading decisions based on candlestick patterns and price movements.
Wyszukaj w skryptach "range"
Custom Time Range HighlighterCustom Time Range Highlighter
This versatile indicator allows traders to highlight specific time ranges on their charts, accommodating users worldwide by supporting customizable UTC offsets. Traders can define two distinct time ranges, setting start and end hours in their local time zone.
A toggle option enables the display of highlights for today only , ensuring focus on current trading conditions.
Ideal for day traders and those following specific market sessions, this tool enhances visibility of active trading periods and aids in effective trade management.

Average True Range with Price MAATR with Price Moving Average Indicator
This custom indicator combines the Average True Range (ATR) with a Price Moving Average (MA) to help traders analyze market volatility in percent to the price.
Key Components:
Average True Range (ATR)
Price Moving Average (MA)
ATR/Price in Percent
ATR/Price in Percent
Purpose: This ratio helps traders understand the relative size of the ATR compared to the current price, providing a clearer sense of how significant the volatility is in proportion to the price level.
Calculation: ATR is divided by the current closing price and multiplied by 100 to express it as a percentage. This makes it easier to compare volatility across assets with different price ranges.
Plot: This is plotted as a percentage, making it easier to gauge whether the volatility is proportionally high or low compared to the asset's price.
Usage:
This indicator is designed to help identify the most volatile tokens, making it ideal for configuring a Grid Bot to maximize profit. By focusing on high-volatility assets, traders can capitalize on larger price swings within the grid, increasing the potential for more profitable trades.
Features:
Customizable Smoothing Method: Choose from RMA (Relative Moving Average), SMA (Simple Moving Average), EMA (Exponential Moving Average), or WMA (Weighted Moving Average) for both ATR and the Price Moving Average.
Dual Perspective: The indicator provides both volatility analysis (ATR) and trend analysis (Price MA) in a single view.
Proportional Volatility: The ATR/Price (%) ratio adds a layer of context by showing how volatile the asset is relative to its current price.

Austin's Range Filter with Trade SignalsAustin’s Range Filter with Trade Signals
Description:
Austin’s Range Filter with Trade Signals is a versatile indicator that combines a custom range filter with dynamic buy and sell signals based on EMA crossovers. This indicator is designed to help traders easily identify trend reversals and optimal trade entry/exit points.
Key Features:
• Range Filter Calculation: The indicator calculates the highest and lowest price over a user-defined period, then multiplies the difference by a customizable multiplier to establish a dynamic range. A combined middle band (average of the upper and lower bounds) is plotted for a clearer visual representation of the price trend.
• Exponential Moving Average (EMA): A user-configurable EMA is added, which acts as the primary signal line. You can adjust the length of the EMA to suit your trading style.
• Buy and Sell Signals:
• Buy Signal: Triggered when the price crosses above the EMA, indicating a potential upward trend.
• Sell Signal: Triggered when the price crosses below the EMA, indicating a potential downward trend.
• Alerts: Custom alert conditions for buy and sell signals allow you to set up real-time notifications when the signal changes, so you never miss an opportunity.
• Customizable Display: You can toggle the visibility of the combined band (purple) and the EMA (blue) for a cleaner chart.
How It Works:
• Buy when the price crosses above the EMA.
• Sell when the price crosses below the EMA.
• Background colors indicate whether the current price is above or below the calculated range, helping you visually identify bullish and bearish conditions.
Customization Options:
• Range Filter Length: The lookback period for the highest/lowest price calculation.
• Range Multiplier: Adjusts the size of the range.
• EMA Length: Set the length of the EMA to fine-tune the signal sensitivity.
• Toggle Lines: Show or hide the combined band and EMA for more flexibility.
This indicator is suitable for a variety of markets including stocks, forex, and crypto, and can be applied to any timeframe. Use it as part of your technical analysis to spot market trends and improve your decision-making process.
How to Use:
1. Apply the indicator to your chart and adjust the settings to suit your strategy.
2. Set up alerts for buy and sell signals to receive real-time notifications.
3. Monitor the price relative to the range and EMA to better time your trades.
This indicator is perfect for traders looking for an intuitive yet powerful tool to enhance their trading strategies with automatic signals and alerts.

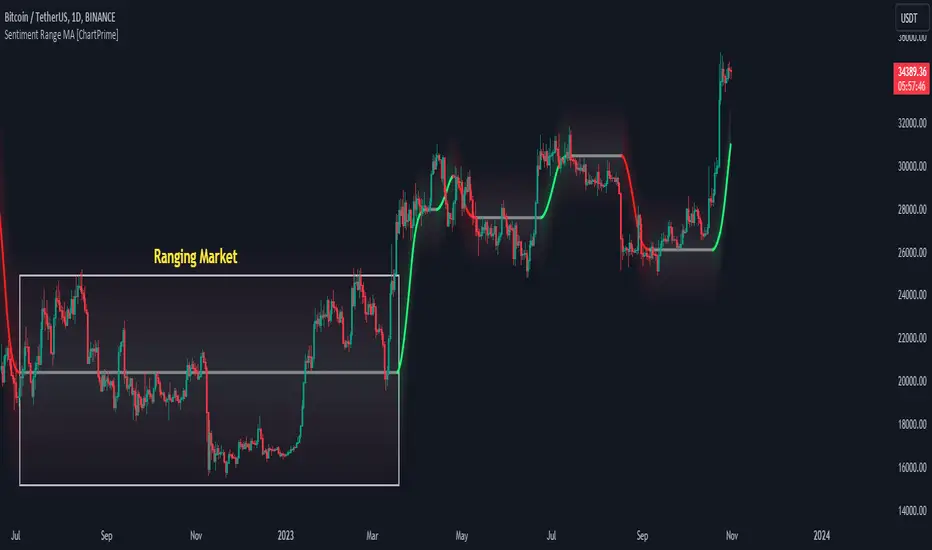
Sentiment Range MA [ChartPrime]The "Sentiment Range MA" provides traders with a dynamic perspective on market activity, emphasizing both stability in chop zones and quick adaptability outside of them.
Key Features:
Chop Zone Stability: In choppy markets, this indicator remains consistent, filtering out the noise to provide a clear view.
Quick Adaptability: Should the price break out of these zones, the indicator recalibrates promptly.
Dynamic Support and Resistance: Adapts based on the latest price action, serving as an evolving reference point.
Emphasis on Recent Levels: The tool factors in the latest notable market levels to stay relevant and timely.
Configurations:
Data Source: Choose your desired metric, though many default to the closing price.
Output Smoothing: Adjust the SR MA's response to market movements.
Trigger Smoothing: Refine boundary definitions based on your market insights.
ATR Period: Set the period for the ATR, influencing the surrounding boundary's width.
Range Multiplier: Control the ATR's effect on the range.
Range Switch: Flip between high-low and open-close values for range determination.
Visuals
Sentiment Range MA Line:
- This is the flowing line that transitions between green and red.
- When it's green, it indicates bullish momentum in the market. This suggests a prevailing upward trend and can be an entry cue for traders who trade with the trend.
- When it turns red, bearish sentiments dominate. It indicates the potential beginning of a downtrend or a continued downtrend. Traders might interpret this as a signal to be cautious, to short the market, or to exit long positions.
The Chop Zone:
- This is the space between the price candles and the Sentiment Range MA line. It represents a region where the price is considered to be moving sideways or without a clear direction. Price movements within the chop zone might not be substantial enough to warrant a trading decision. Only when the price breaks out of this zone do we see the Sentiment Range MA line change color, signaling a potential trading opportunity.
By interpreting these visuals, traders can make more informed decisions based on the prevailing market sentiment and trend. The chart becomes a tool, providing both an overview of the market condition and potential entry or exit points based on the Sentiment Range MA indicator's readings.
Detailed Settings Overview
Understanding the settings of the Sentiment Range MA Indicator can greatly enhance its utility in your trading strategy. Let's dive deeper into each:
Output Smoothing:
Purpose: It refines the SR MA to provide a clearer trend perspective.
Functionality:
- At `0`, it ensures the indicator responds immediately to price deviations from the chop zone.
- At higher values, it transforms the indicator into a volatility-adjusted moving average.
Filtering Modes:
- Single Filtering: Prioritizes speed.
- Double Filtering: Emphasizes stability.
Trigger Smoothing:
Purpose: Used for the range break detection.
Functionality: It dampens the indicator's sensitivity to sudden market volatility, preventing unnecessary triggers.
ATR Length:
Purpose: Governs the retrospective period for the chop zone.
Functionality:
- Higher values offer a more consistent and broad range size, capturing more historical data.
- Lower values allow for a more adaptive and responsive range.
Range Multiplier:
Purpose: Modifies the breadth of the range around the SR MA.
Functionality: Increasing the multiplier will extend the range, giving more leeway before triggering, while decreasing it will narrow the range, making the indicator more responsive to price changes.
Range Style:
Purpose: Decides which candlestick data is factored into the true range calculations.
Options:
- Body: Uses the open and close values.
- Wick: Accounts for the high and low values.
Functionality: Switching between styles lets you prioritize either the overall volatility (Wick) or just the concluded price action for a period (Body).
By fine-tuning these settings, traders can tailor the Sentiment Range MA Indicator to various market conditions and personal trading styles, ensuring optimal decision-making.
Quick Start
Based on the provided chart, here's a brief explanation of the default settings for the Sentiment Range MA Indicator:
Length: Set at ` 20 `.
- This determines the base moving average period. A standard setting, it calculates the average price over the last 20 periods, providing traders with a clear perspective of short-term trends.
ATR Length: Set at ` 200 `.
- This adjusts the lookback period for the Average True Range (ATR), which in turn influences the chop zone calculation. At a setting of 200, it offers a comprehensive view, considering a longer stretch of historical data.
Range Multiplier: Set at ` 6 `.
- This multiplies the ATR value, widening or narrowing the band around the SR MA. A setting of 6 means the range around the SR MA is determined by multiplying the ATR by 6, offering a broader fluctuation zone.
On the chart, the green line represents the bullish sentiment and the red represents the bearish sentiment. Price movements above and below these lines can be used as potential buy or sell signals respectively. Fine-tuning these settings can cater the Sentiment Range MA Indicator to your specific trading strategy and market condition preferences.
Alternative Settings
For traders looking to adapt to faster market conditions or prefer a more agile analysis, here's a brief description of the alternative settings for the Sentiment Range MA Indicator:
Length: Set at ` 3 `.
- This highly responsive setting calculates the average price over the last 3 periods. Ideal for quick market movements, it offers traders insights into very short-term price trends and potentially swift trade opportunities.
ATR Length: Set at ` 50 `.
- This shorter lookback period for the Average True Range (ATR) focuses on more recent market volatility, providing a tighter and more current chop zone calculation. It's suitable for those wanting to respond to recent market shifts.
Range Multiplier: Set at ` 4 `.
- Multiplying the ATR by 4 narrows down the buffer around the SR MA. This creates a tighter sentiment range, possibly resulting in more frequent crossovers and trading signals.
In the provided chart, the green line still denotes bullish momentum while the red symbolizes bearish sentiment. These alternative settings might generate more frequent signals, so traders should ensure their strategy is aligned with this heightened sensitivity.
Wrapping Up
The Sentiment Range MA melds stability and agility, making it a valuable tool in your trading toolkit. As always, before integrating new indicators, take the time to understand its nuances and potential impacts on your strategy.
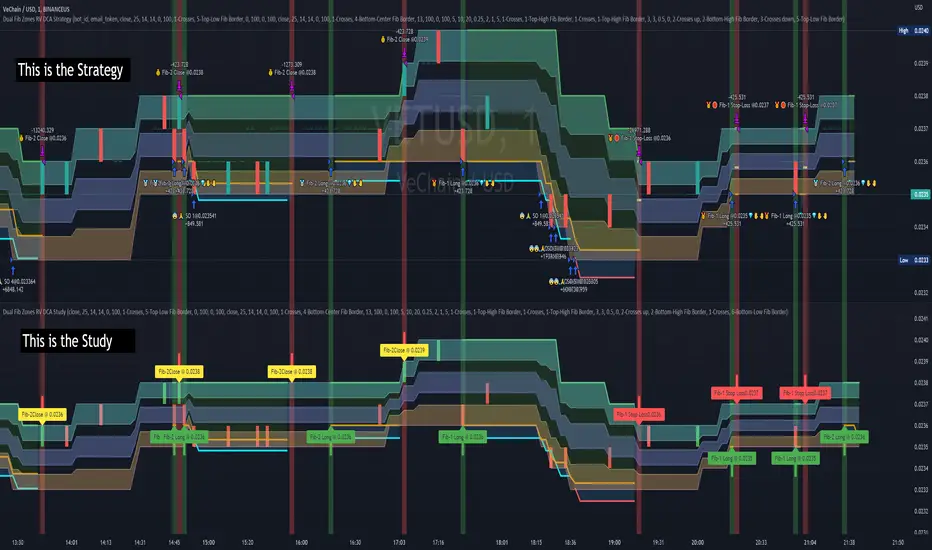
Dual Fibonacci Zones & Ranged Vol DCA Study - R3c0nTraderWhat does this do?
This signal script (aka Study) was created so it could be used with the corresponding strategy "Dual Fibonacci Zone & Ranged Vol DCA Strategy - R3c0nTrader" to create the buy and sell signals for 3Commas bots.
How to Use
Configure the study to match your settings you have set in the strategy. This script comes with an buy and sell alert conditions built-in. Just click to add alert and select Buy or Sell and paste in your bot messages.
Credits:
Thank you "EvoCrypto" for granting me permission to use "Ranged Volume" to create this study
Thank you "eykpunter" for granting me permission to use "Fibonacci Zones" to create this study
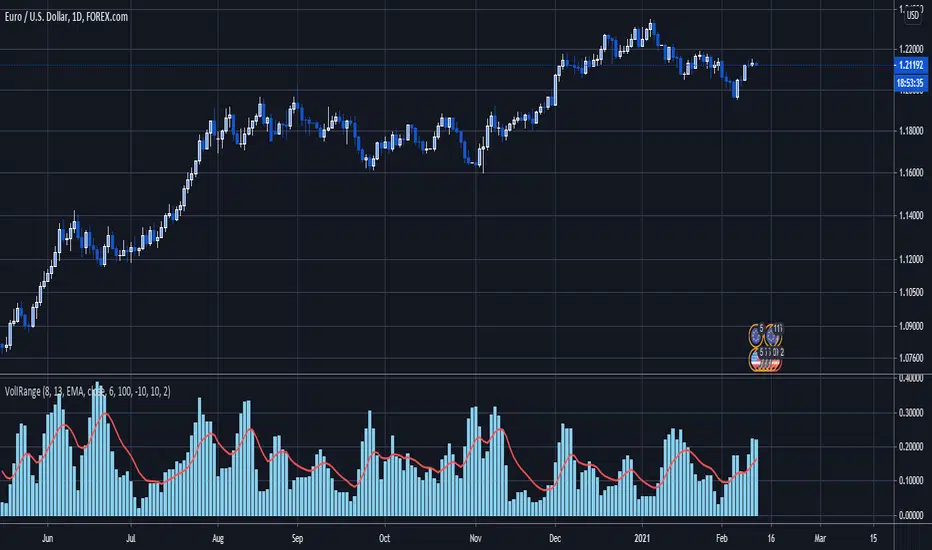
SVDThis indicator aims to compare between two charts if trader isn't sure which one is more active and powerful, it does NOT show entries or help your chart analysis directly.
The main features of this indicator is to show vitality and range of any given chart.
Volatility: it calculates the average profit of every swing in the range and the final result will be the chart volatility, which indicate how profitable this chart is.
Range: it calculates the profit of the whole range compared to the total price. (E.g. range bottom is 0.1 and range top is 0.2 the range will be 100%)
Extra: indicator shows the total direction of the chart in term of (STRONG UPTREND, UPTREND, SIDEWAYS, DOWNTREND, STRONG DOWNTREND), if you got (Somthing_wrong) please contact me.
How to use: apply the indicator on different charts that you have chosen and the higher (volatility & range) the more profitable the chart is.
inputs:
Lookback length: how long the range is (how many candles are included).
How intense should the Swing be: how many candles should be counted as a confirmation complete swing.
Show counted Swings: if checked as true, will show the swings counted in the volatility calculation.
For any notes on the indicator to be edited, or for another indicator ideas please comment.

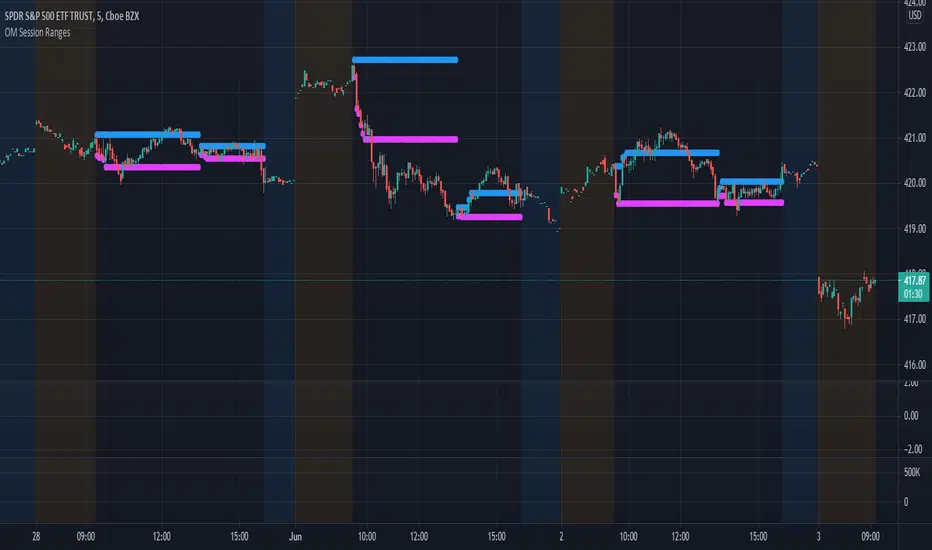
OM Session RangesThis indicator was created to assist in generating the morning and afternoon ranges as defined by Options Millionaire's strategy.
Morning range is determined by identifying the high and low from open to 10:05.
Afternoon range is determined by identifying the high and low from 13:30 to 14:05.
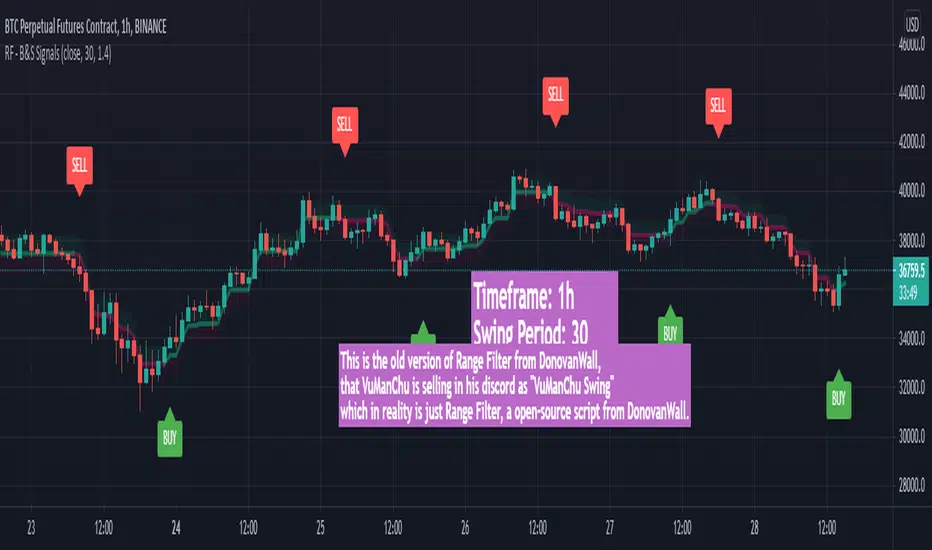
VuManChu Swing FreeThis is the old version of Range Filter from DonovanWall, that VuManChu is selling in his discord as "VuManChu Swing" which in reality is just Range Filter, a open-source script from DonovanWall.
Safe Scalpy Stop Loss. Percentage from price visualizer.This is my first script I have published so bear with me.
I have thrown this together so you can easily see on the chart where -0.5%, -1% and -2% would be from the last candle close. I also replicated these to show positive values in case you are shorting.
I have also added a custom value setting so you can set the line at whatever percentage value you like and included an adjustable recent higher high and higher low finder to help create a recent range as it seems to work well in tandem for scalping range based price movement.
You can turn all these things on and off in the settings on the style checkboxes.
I felt the need to make this because I like to scalp trade with leverage like a total degen from time to time. Often the setups happen very quickly. It is difficult to calculate where to set a stop loss in a hurry so I keep a fixed account size/lev and just vary the position percentage size based on the percentage of the stop loss from the current price.
Sometimes when switching from a lower volatility chart to high volatility one it is easy to get caught out by quickly entering a scalp trade only to find you made your position way too big or you shouldn't have entered at all. You thought it was only moving 0.2% per candle instead of 3%. Whoops. Rekt.
This indicator is all about trying to help me avoid that with a visual clue to back up the bad maths I do quickly in my head.
I often hide it and only show it when I'm ready to enter a position to double check my SL and entry are set in a sensible area.
I thought I would publish it in case someone else finds such a simple tool handy.
Apologies if there is already something out there that does this job. I couldn't find it.
See you all on the moon.

Trend Type Indicator by BobRivera990Usage:
The purpose of this indicator is to programmatically determine the type of price trend using technical analysis tools.
You can do a quick check on the asset’s higher and lower time frames. For example, if you are trading on an H1 chart, you can check the m5 chart to ensure that the trend is in the same direction and similarly check the H4 chart to ensure that the higher time frame price is also moving in the same direction.
If multiple time frame charts confirm a similar trend, then it is considered a very strong trend and ideal for Trend trading.
Remarks:
By default, the last status is related to 8 periods before the latest closing price.
Related definitions:
The three basic types of trends are up, down, and sideways.
1. Uptrend
An uptrend describes the price movement of a financial asset when the overall direction is upward. The uptrend is composed of higher swing lows and higher swing highs.
Some market participants ("long" trend traders) only choose to trade during uptrends.
2. Downtrend
A downtrend refers to the price action of a security that moves lower in price as it fluctuates over time.
The downtrend is composed of lower swing lows and lower swing highs.
3. Sideways
A sideways trend is the horizontal price movement that occurs when the forces of supply and demand are nearly equal. This typically occurs during a period of consolidation before the price continues a prior trend or reverses into a new trend.
How it works:
Step 1: Sideways Trend Detection
In this step we want to distinguish the sideways trend from uptrend and downtrend. For this purpose, we use two common technical analysis tools: ATR and ADX
1. Average True Range (ATR)
The average true range (ATR) is a technical analysis indicator that measures market volatility.
We also use a 20-period moving average of the ATR.
When the ATR is below the average of its last 20-periods, it means that the rate of price volatility has decreased and we conclude that the current trend is sideways
2. Average Directional Index (ADX)
The average directional index (ADX) is a technical analysis indicator used by some traders to determine the strength of a trend.
The trend has strength when ADX is above 25.
So when the ADX is less than or equal to 25, there is no strong trend, and we conclude that the current type of trend is sideways.
Step 2: Detect uptrend from downtrend
If it turns out that the current price trend is not sideways, then it is either uptrend or downtrend.
For this purpose, we use plus and minus directional Indicators (+ DI & -DI).
A general interpretation would be that during a strong trend, when +DI is higher than -DI, it is an uptrend. When -DI is higher than +DI, it is a downtrend.
Parameters:
"Use ATR …" ________________________// Use Average True Range (ATR) to detect Sideways Movements
"ATR Length"_______________________ // length of the Average True Range (ATR) used to detect Sideways Movements
"ATR Moving Average Type" ___________// Type of the moving average of the ATR used to detect Sideways Movements
"ATR MA Length" ____________________// length of the moving average of the ATR used to detect Sideways Movements
"Use ADX ..."_______________________ // Use Average Directional Index (ADX) to detect Sideways Movements
"ADX Smoothing”____________________// length of the Average Directional Index (ADX) used to detect Sideways Movements
"DI Length"_________________________// length of the Plus and Minus Directional Indicators (+DI & -DI) used to determine the direction of the trend
"ADX Limit" ________________________// A level of ADX used as the boundary between Trend Market and Sideways Market
"Smoothing Factor"__________________// Factor used for smoothing the oscillator
"Lag"______________________________// lag used to match indicator and chart
Resources:
www.investopedia.com

Volatility Index of Range Verification█ OVERVIEW
This is a volatility indicator created by extending concepts from Tushar Chande's Range Action Verification Index (RAVI).
█ CONCEPTS
This indicator constructs range of the RAVI indicator. It uses this range to build a histogram that represents how fast the range is changing, or a measure of volatility. A line is then constructed, either from a moving average or standard deviation depending on the settings that can serve as an action trigger.
█ INPUTS
• Fast MA Period: the period of the quickest moving average that is used to build the RAVI indicator line
• Slow MA Period: the period of the slowest moving average that is used to build the RAVI indicator line
• MA Type: the type of moving average to use, either Simple or Exponential
• Price Source: the type of price source to use; close, high, low, hlc3, etc.
• Lookback Period: how far back to construct the minimum and maximum of the range
• Standard Range: the standard range of the indicator. a smaller range will exaggerate differences in the columns, and vice-versa
• Volatility Period: the period used for the trigger line moving average
• Std. Deviation Mode?: Whether the trigger line will plot using a moving average or a multiple of Standard Deviation.
• Deviation Multiplier: How many deviations to use if the trigger line is in Std. Deviation Mode
Triple Average True Range Channel Definition: By ADAM HAYES from Investopedia -- Updated Jul 8, 2019
The average true range (ATR) is a technical analysis indicator that measures market volatility by decomposing the entire range of an asset price for that period. Specifically, ATR is a measure of volatility introduced by market technician J. Welles Wilder Jr. in his book, "New Concepts in Technical Trading Systems."
The true range indicator is taken as the greatest of the following: current high less the current low; the absolute value of the current high less the previous close; and the absolute value of the current low less the previous close. The average true range is then a moving average, generally using 14 days, of the true ranges.
I've added a channel perspective from a certain % from the Slow Average Length that user will have to configure depending of resolution and the markets instruments they chose...
Also a fill is used to easily point out when a high distance between a fast and a slow volatility analysis is occurring.
Which is also denotated with a shaped label...
Share and comment my work :)

Session RangesThis is session range indicator with CLEAN code and CLEAR data presentation. There are other range indicators available but when I looked I found them unreliable or making too much screen clutter. WIth mine you can have 3 ranges on screen, measure to bodies or wickes, customise the period, (set your timezone), colours, labels and all that good stuff...
I'm very happy to share it with everyone (and publishing is a great way to archive my code) but ultimately this indicator is by me, for me. Whilst i added a few bells and whistles for everyone this indicator is precisely designed to:
Show me EASILY see what happened in the Asia session and whether we are breaking out with MINIMAL screen clutter. I only use the 3, 15 and 60 - it won't work on the 1, 5, 120 etc because I dont need it to. How I use it is below.
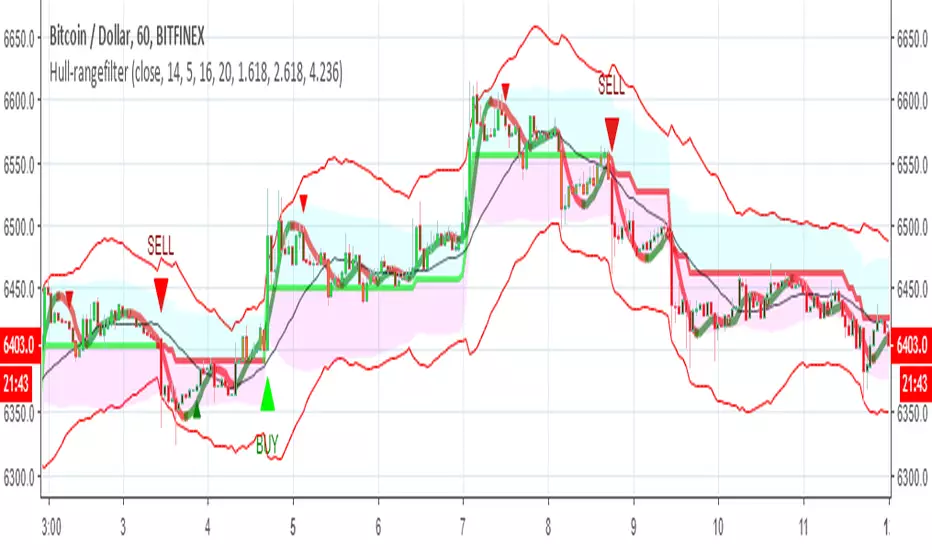
Hull-rangefilterMix of XAvi range filter and Hull fib , seems to be nice hybrid
alerts inside for both systems
for each coin isuugets to optimise the Hull length or the range (now set to 5) and then to test it
Donchian Channel with Range AdditionA Donchian Channel with additional zones at places where its range is smaller than a set amount of atr. Thus it kind of combines with Keltner Channel qualities. Purpose is to set a stop loss wide enough to avoid shaking out of a position. The example chart shows a Philips day chart, where I opened position on 16 juli at 37,50 and set the stop loss at low border level 35,60, on 23 juli was an earnings rapport, the wick of the candle shows that quotes went very low, obviously smart traders had to fill a huge order and hunted for stops, triggering my stop closing the position. next days quotes went a lot better, so I missed the fun. The Donchian Channel was too narrow because quotes had ranged in the previous weeks. If I had placed my stop on the additional low, setting it 5 atr below the high border, my stop would have been safe.

Renko Price Bars Overlay// Shows the price renko bars (or range bars) instead of the PERIOD renko
// bars that are integrated into Trading View. The normal renko bars that
// Trading View offers only consider the drawing of a new brick when the
// price closes above or below the required brick size. This can produce
// misleading charts since depending on the time interval of a chart, new
// bricks may or may not be drawn. True price renko bars will draw a new
// brick immediately upon the price exceeding the next target brick size.
// When running this script in "Traditional" mode, the painting of the
// brick overlay band is INDEPENDENT of the chart interval. If price
// exceeds the required target price for the next brick, the band is
// updated immediately, instead of waiting for the price bar on the chart
// interval to close first. The brick starting anchor point will attempt
// to be a "nice number" at a round interval for the chart ticker. For
// example, if viewing EURUSD with the box size equal to 50 ticks/pips,
// the open and close prices will take the form of 1.2100, 1.2150, 1.2200,
// 1.2250, and so on. This is the same behavior as the normal traditional
// Renko bars in Trading View and other major trading platforms such as
// Meta Trader.
// Use the tick size in traditional mode to specify the block size, in
// ticks. This may give interesting results in FOREX pairs... as the tick
// size in Trading View may be 0.00001 instead of the normal pip size of
// 0.0001, so a 10 pip block size may be '100', and not the expected '10'.
// FOREX futures should work in the manner expected, a 10 pip block size
// will indeed equal 0.0010.
// The "ATR" mode functions differently than the Trading View built in
// version. The block size is updated each time the range is exceeded.
// In Trading View, when using the ATR mode, the ATR is the last ATR
// value calculated on the ENTIRE data interval, and is applied to all
// past data. You can see this when you press the '+' sign of the ticker
// in the top left of the chart window and you will see the brick size
// as a constant, the brick size is not a function of the ever changing
// ATR value of the price action. The block size of this script is not
// updated for each price candle (i.e. each 1HR on a 1HR chart), instead
// it is updated only when the price thresholds are exceeded requiring a
// the band to be updated. At that point the current ATR is considered
// and the brick size is updated.
// Options exist to show the current high and low of the brick, and to
// show the required levels that the price must exceed to draw a new
// brick and update the band.
Please leave comments if you notice any bugs or would like any new features added. I don't find much use for plotting the H/L of the current renko candle, but I have seen some request it in the past.
Cheers.

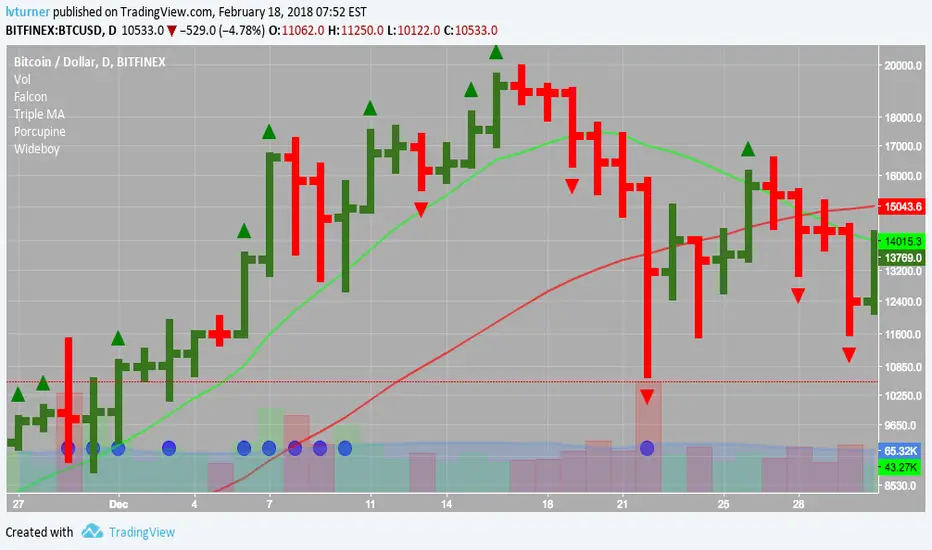
Wideboy - Wide Ranging DaysHighlights wide ranging days with a circle underneath them.
A wide ranging day is defined as where it's true range is greater than twice (configurable by changing input K) the average true range of the preceding 15 days. (Configured by changing the ATR lookback input)
Enjoy!
Forex session - Opening Range- Jayy fixed updatedOpening Range (OR) for Forex 24 hour regular session. This is not for regular market day sessions addressed in a separate script.
This script fixes four issues:
syntax error when code compiles
messed up opening range the day after a holiday Monday
flaky plotting of the opening range and targets that required page reloading
TradingView problems with starting forex session at 1700 hours EST/EDT when using certain securities eg FX_IDC currently (Jan 2017)
Additions in his code are more options for trading range
Time compensation option for some securities that incorrectly start sessions at 1200 hrs instead of 1700 hrs NY time
- this glitch is likely temporary but present when this script update was created
More opening range time period choices
Opening Range Targets:
Opening Range Targets as per Leaf_West
Targets are set at 127% , 162%, 200 %, 262 %, 362%, 423%, 685%, 1109% and 1794% and this can be traded intraday using methods described here charts-by-leaf.com I also have some Leaf West PDFs that describe how the targets are set and how they are traded. There are others that use opening range.
The Time Session Glitch and the Fix:
The script will correctly default to 1700 hrs to 1700hrs EDT/EST session for FXCM.
Strangely some securities appear to erroneously start their session at 1200 hrs ie. My guess is that they are somehow tied to GMT+0 instead of New York time (GMT+5). See this for yourself by selecting EURUSD using the FXCM exchange (FX:EURUSD) and then EURUSD from the IDC exchange (FX_IDC:EURUSD). The FX-IDC session opening range starts 5 hours
before it actually should at 1700 hrs EDT/EST. To correct for this I have implemented an automatic fix (default) and a user selected "5 hour time shift adjust. ment needed on some securities".
There is also a 4 hour time shift button which might be necessary when New York reverts from Eastern Standard Time
to Eastern Daylight Time (1 hour difference) in March (and then back again in November). In the default auto adjust mode you will need to select the 1 hour time shift. That is if this glitch still exists at that time.
I have looked at other scripts, other than my own and where the script is available, that need to use information about the opening bar and all have the same time shift issue
What are the choices for Opening Range?
The dialogue box offers the standard TradingView options.
Also where you see Pick Opening Range 1 to 12 hours , SET TO 0 To USE LINE ABOVE TO DETERMINE OR LENGTH
As the note says a number other than 0 will override the standard options from the line above
The dialogue box below in offers choices by hours 1 to 12. A number greater than 12 will still only give
720 minutes (12 hours) for the length of Opening Range.
What sessions within the FOREX time-frame are available?
The default is 1700 hours to 1700 hours EST/EDT
Check any one (only one) of the time periods to change the opening range period to suit.
New York opens at 8:00 am to 5:00 pm EST (EDT)
Tokyo opens at 7:00 pm to 4:00 am EST (EDT)
Sydney opens at 5:00 pm to 2:00 am EST (EDT)
London opens at 3:00 am to 12:00 noon EST (EDT)
There is a build your own session (click the button to select)
The two lines for inputting session times are almost identical except that the second line starts the be the same as each other.
The default for the build your own session is 2200 hours to 2200 hours. As of the time of publishing this plots EURUSD FX-IDC just right. The GMT+5 and GMT+4 do not apply to this selection.
See my comments above on this strange aberration.
The script originated from work done by Chris Moody. It has changed significantly but there are remnants of that script lurking within.
Script is free to all - that way you can see what is inside
Cheers Jayy

Market Meanness Index-Price ChangesThis is the Market Mean index. It is used to identify if the market is really trending or if it is range bound(random). In theory, a random sample will be mean reverting 75% of the time. This indicator checks to see what how much the market is mean reverting and converts it to a percentage. If the index is around 75 or higher than the price curve of the market is range bound and there is no trend from a statistical standpoint. If the index is below 75 this means the price curve of the market is in fact trending in a direction as the market is not reverting as much as it should if it were truly following a random/range bound price curve.

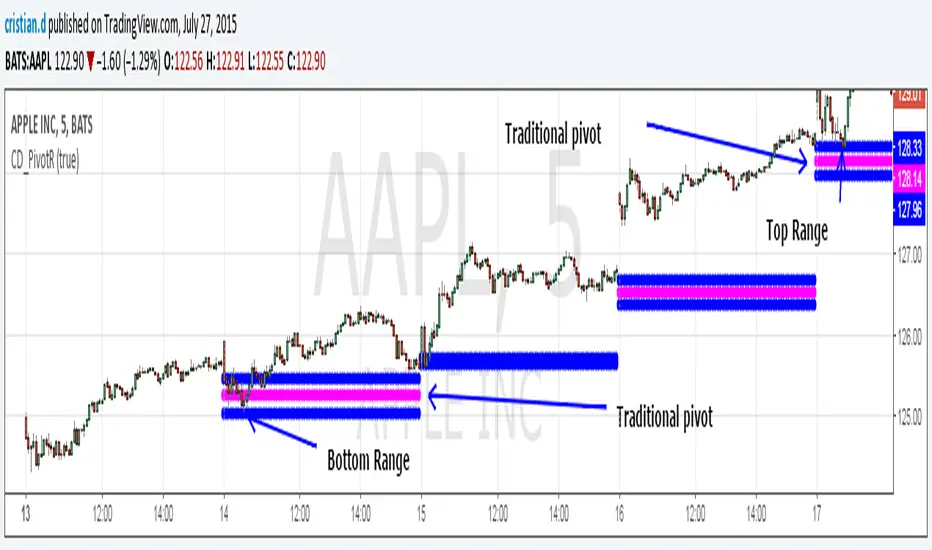
Pivot Range Pivot BossMy first attempt to code something. It's Mark Fischer concept of Pivot Range from his book Logical Trader.
The strategy for using it is actually from Frank Ochoa's book Secrets of a Pivot Boss. Pivot Range is the "meat of the matket" and "the heart beat of the market" according to him.
Besides using the actual pivots the strategy is based on the relationships between 2 day pivot ranges.
Higher Value - Bulish
Overlapping Higher - Moderate Bulish
Lower Value- Bearish
Overlapping Lower - Moderate Bearish
Unchanged - Sideways/Breakout
Outside - Sideways
Inside - Breakout
New Indicator!!! Opening Range_V1Plots the Opening Range for the First Hour for Stocks and Forex. Option to Plot the first 30 Minutes Opening Range, or Both. See first Post for Specifics.

EMA RANGEEMA RANGE
EMA RANGE is a simple, price-focused indicator that plots an Exponential Moving Average (EMA) with a dynamic ATR-based range above and below it. The ATR bands adapt to market volatility, helping traders visualize normal price movement and identify potential expansion or compression zones.
🔹 Features
Customizable EMA length
ATR range bands plotted above and below the EMA
Adjustable ATR length and multiplier
Toggle to enable or disable ATR ranges
Fully customizable colors and line thickness from the Style tab
🔹 How It Works
The EMA serves as the central trend reference.
The Average True Range (ATR) measures volatility.
Upper and lower bands are calculated as:
EMA ± (ATR × Multiplier)
When price remains inside the range, conditions are considered normal. Moves outside the range may signal increased volatility, momentum expansion, or potential breakout conditions.
🔹 Best Use Cases
Trend continuation and pullback analysis
Volatility-based risk framing
Dynamic support and resistance visualization
Works on any market and timeframe
EMA RANGE is designed to stay clean, responsive, and easy to interpret—making it suitable for both discretionary and systematic traders.
