MACD Momentum Structure & Volume Profile Sniper [MTF]**Description and Methodology**
This script offers a unique approach to Market Structure by moving away from traditional fractal-based highs and lows (which can be noisy). Instead, it utilizes **MACD Momentum Swings** to identify significant structural points, combined with an automated Fixed Range Volume Profile to pinpoint high-probability entry zones.
**1. Why MACD Structure? (The Core Concept)**
Traditional "ZigZag" or Fractal indicators rely solely on price action, often leading to fake-outs during low-volume consolidation.
* This script defines a "Swing High" only when the MACD Histogram crosses below zero (Momentum shifts Bearish).
* This script defines a "Swing Low" only when MACD crosses above zero (Momentum shifts Bullish).
By linking structure to momentum, we filter out weak price movements and focus on the true "heartbeat" of the trend.
**2. The "Mashup" Synergy: Structure + Volume + Logic**
This is not a random combination of indicators. Each component serves a specific step in the trading execution sequence:
* **Step 1 (Structure):** The script identifies a Change of Character (CHoCH) based on the MACD peaks described above.
* **Step 2 (Liquidity/Value):** When a CHoCH occurs, the script *automatically* draws a **Fixed Range Volume Profile (FRVP)** specifically covering the impulse leg that caused the break. This reveals the "Point of Control" (POC)—the hidden price level where the most volume occurred during the move.
* **Step 3 (The Sniper Entry):** The script creates a "Zone" around that POC. It then waits for Price to retrace into this zone.
* **Step 4 (Confirmation):** Once the zone is touched, the script monitors a lower timeframe (User selectable, default M1) for a fresh MACD crossover to trigger the final entry signal.
**Features**
* **Multi-Timeframe Dashboard:** Monitor the MACD Trend direction across 4 different timeframes simultaneously.
* **Dynamic Trendlines:** Automatically connects confirmed MACD peaks to visualize trend integrity.
* **Fibo Time Zones:** Projects potential future pivot points based on the duration of the previous swing.
* **Alert System:** Integrated alerts for Zone Touches and "Sniper" entries (Zone Touch + LTF Momentum Confirmation).
**How to Use**
1. **Identify Trend:** Look for the CHoCH labels. Green indicates a shift to Bullish, Red to Bearish.
2. **Wait for Pullback:** Do not chase the break. Wait for price to return to the Yellow POC Zone generated by the Volume Profile.
3. **Entry Trigger:** Watch for the "BUY" or "SELL" marks. These appear only when price hits the zone AND the lower-timeframe momentum aligns with the trade direction.
**Settings & Inputs**
* **Global MACD:** Adjust the sensitivity of the swing detection (Default 12, 26, 9).
* **Sniper Entry:** Select the timeframe used for the final confirmation (e.g., use M1 confirmation for an H1 chart structure).
* **VP Settings:** Customize how the Volume Profile looks on the chart.
*Disclaimer: This script is intended for educational purposes and market analysis. It does not provide financial advice.*
Wyszukaj w skryptach "poc"

Bassi's Consolidation Breakout — ULTIMATE PRO + VPOverview
Bassi’s Consolidation Breakout — ULTIMATE PRO + VP is a professional-grade breakout detection system that combines price structure, volume confirmation, volatility compression, and custom volume profile logic.
The indicator automatically detects compressed consolidation zones, confirms breakouts with multi-layer filters, and plots full trade setups including:
Entry level
Stop-loss
TP1, TP2, TP3 (R:R based)
Trend filters + MTF EMA
Retest validation
Volume Profile confirmation (POC / VAH / VAL)
This is one of the most complete breakout frameworks for TradingView.
🔍 Core Concept
The script detects tight consolidation boxes based on:
Price range (% compression)
Lookback period
Minimum required bars
Breakout above/below the box
Once the consolidation ends, breakout signals fire only if they pass all filters.
This focuses your trading on high-probability breakouts only.
🔥 Key Features
1️⃣ Automated Consolidation Box Detection
Draws consolidation boxes dynamically
Identifies tight range compression
Supports advanced range logic for high accuracy
2️⃣ Smart Breakout + Retest Engine
Breakouts and breakdowns require:
Structure break
Minimum breakout expansion (0.15%)
Volume confirmation
Trend (200 EMA) confirmation
Optional retest validation
Optional Volume Profile filter
Each valid breakout prints a signal + full trade setup.
3️⃣ Custom Volume Profile Engine
Fast and lightweight custom-built VP that calculates:
POC (Point of Control)
VAH (Value Area High)
VAL (Value Area Low)
These levels can optionally be used to filter weak breakouts.
4️⃣ Multi-Timeframe Trend Filter
Uses 200 EMA from any selected higher timeframe
Helps avoid counter-trend fakeouts
Fully optional
5️⃣ Automatic Trade Setup Projection
Each breakout generates:
Stop-loss (ATR × multiplier)
TP1 (R:R)
TP2 (R:R)
TP3 (optional)
Clean signal labels
Only keeps the last 2 signals to maintain clarity
6️⃣ Alerts Included
Alerts fire instantly when a valid breakout occurs:
“Bassi LONG + VP”
“Bassi SHORT + VP”
Alerts include ticker + entry price.
📘 Usage Guide & Trading Rules
✔ Recommended Trading Steps
1. Wait for a confirmed consolidation box
Box must be narrow
Must meet minimum bar requirement
2. Wait for a confirmed breakout signal
Signal requires:
Breakout above/below box
Volume confirmation
Trend & MTF confirmation if enabled
Optional retest
Optional VP filter (close outside VAH/VAL)
3. Follow the projected setup
The script prints:
Entry
SL
TP1 / TP2 / TP3
Target lines extend automatically.
📖 How to Use the Script (Trading Rules)
1️⃣ Long Entry Rules
Enter Long when:
Price breaks above trend confirmation level
Momentum signal turns bullish
Candle closes above trigger line
Volatility filter is satisfied
Exit Long:
TP1/TP2/TP3 levels
Reversal signal
Trailing stop hit
2️⃣ Short Entry Rules
Enter Short when:
Price breaks below trend confirmation level
Momentum signal turns bearish
Candle closes below trigger line
Volatility filter is satisfied
Exit Short:
TP1/TP2/TP3 levels
Trend reversal
Trailing stop hit
✔ Recommended Markets
Crypto
Forex
Indices
Futures
Stocks
Works on all timeframes from 1-minute to daily.
✔ Best Practice
Avoid taking signals against HTF trend
Prefer signals that break away from VAH/VAL
Use TP1 to secure partial profits
Move SL to breakeven after TP1 if desired
Always follow personal risk management
👤 Author
Created by: Mahdi Bassi
Professional trader & systems designer
Focused on structural, volume-based and volatility-based strategies.
⚠️ Disclaimer
This script is for educational purposes only.
No indicator can guarantee profits.
Always use proper risk management and trade responsibly.

z8u Daily & Weekly Key Levels (Extended)1. OVERVIEW
------------------------------------------------------------------------
The "Daily & Weekly Key Levels" indicator is a charting tool designed to
visualize critical auction market structures. It overlays automated
historical price data (Previous Day/Week Highs and Lows) with manual
inputs for Volume Profile levels (VAH, VAL, POC) and Institutional
"Kickoff" levels.
It is designed to replicate specific institutional styling, allowing
traders to see where the market is balancing relative to previous sessions.
2. FEATURES
------------------------------------------------------------------------
Automated Lookback:
Automatically calculates previous Day's High/Low/Settlement and
previous Week's High/Low.
Hybrid Input System:
Allows manual entry for data points that require specific feed
accuracy (Value Area High, Value Area Low, POC).
Clean Charting:
Manual levels default to '0.0'. If no price is entered in the
settings, the lines remain invisible to keep the chart clean.
Custom Styling:
Colors and line weights are pre-configured to match standard
Volume Profile aesthetics.
4. CONFIGURATION (INPUTS TAB)
------------------------------------------------------------------------
To see the Volume Profile and Kickoff lines, you must enter prices
manually in the indicator settings.
1. Double-click the indicator line on the chart (or the gear icon).
2. Go to the "Inputs" tab.
3. Enter the price levels for the current session:
- Yesterday's Value Area High Price
- Yesterday's VPOC Price
- Yesterday's Value Area Low Price
- Weekly Kickoff Low Price
- Weekly Kickoff High Price
*Note: If you leave a value as 0.0, that specific line will not be drawn.*
5. COLOR LEGEND (STYLE TAB)
------------------------------------------------------------------------
The lines are color-coded as follows:
Last Week's High
Yesterday's High
Yesterday's Value Area High (VAH)
Yesterday's VPOC (Volume Point of Control)
Settlement (Previous Close)
Yesterday's Value Area Low (VAL)
Yesterday's Low
Weekly Kickoff Low
Weekly Kickoff High
Last Week's Low
6. DISCLAIMER
------------------------------------------------------------------------
This tool is for informational and educational purposes only. It does not
constitute financial advice. Trading futures and financial markets
involves substantial risk of loss.
14 minutes ago
Release Notes
UPDATE
*Added Extend Levels to the Right Toggle

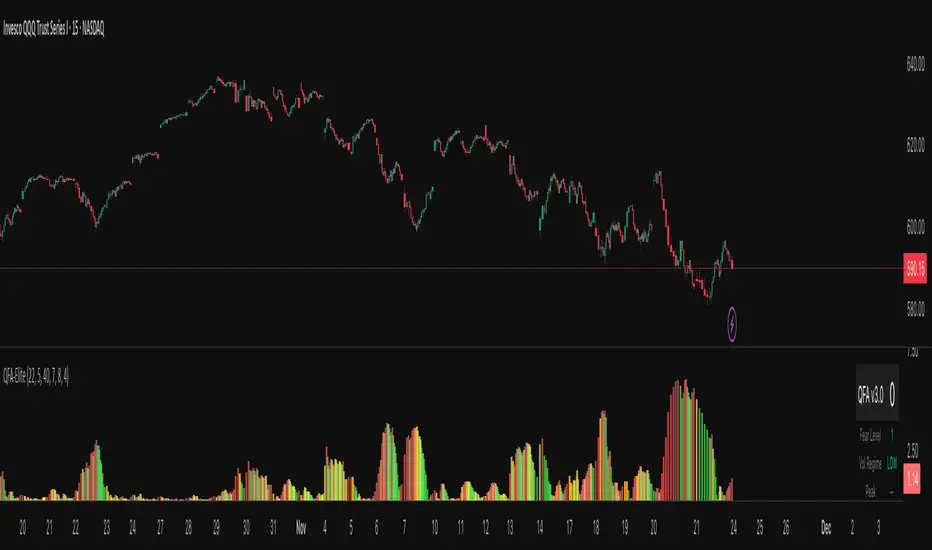
QFA Volatility MeterQFA Volatility Meter
This is a technical indicator I built to measure market fear and identify potential bottom reversal setups in liquid ETFs and stocks. It combines multiple technical factors into a single scoring system. This is a new indicator with limited real-world testing so treat it as experimental.
What It Actually Does
The indicator calculates a fear index based on how far price has dropped from the highest close over the past 14 bars. It then applies zero lag EMA smoothing with a 5-period setting to reduce noise. The fear reading gets adjusted based on ATR percentile rank with the theory being that high volatility drops should register as more significant than low volatility drops.
On top of this base fear calculation, the indicator checks for five additional factors: momentum peaks where fear stops accelerating upward, RSI divergence using a 7-period RSI, support levels that have been tested multiple times in the past 50 bars, volume patterns including spikes and rejection wicks, and point of control using a 30-bar volume profile calculation. Each factor that triggers adds points to a score from 0 to 100.
The histogram bars change color based on whether fear is rising or falling. Red means fear is increasing, green means decreasing. Gold colors appear when the score crosses certain thresholds: bright gold for scores above 40, orange for scores above 30, pale gold for scores above 20. There is a table in the upper right showing the current score, raw fear level, volatility regime, and which components are active.
The Core Problem You Need To Know
This indicator has a fundamental lag issue that I have not yet solved. Because it measures price drops over a 14 bar lookback period, it is calculating what already happened rather than what is happening right now. During fast selloffs you will often see the fear level reading very low like 5 or 10 even though price is clearly crashing in real time. The reading catches up eventually but by then you have missed the entry by 10 to 20 bars.
I attempted to fix this with ATR normalization and faster smoothing but the lookback period remains the main bottleneck. The indicator works better at identifying areas where fear has already peaked and is starting to decline than at catching the exact moment of peak fear. This makes it more useful for confirmation than for timing entries.
What Works
The multi-component scoring system does a decent job of filtering out low quality setups. When you get a high score above 50 or 60 with multiple components firing like divergence plus support plus volume, those tend to be legitimate reversal zones worth paying attention to. The color coding is intuitive and easy to read at a glance. The real-time table helps you understand what is triggering without having to decode the chart.
The volume climax detection catches some extreme bottoms where you see three or more bars of increasing volume combined with panic selling. These can mark capitulation points. The multi-touch support logic does add value by distinguishing between random price levels and actual tested support zones.
The indicator handles changes in volatility reasonably well. During low volatility periods it lowers the threshold so you still get some signals. During high volatility it raises the threshold to filter noise. This dynamic adjustment is better than using a fixed threshold across all market conditions.
What Does Not Work
The lag issue means you will frequently see obvious selloffs where the indicator shows nothing. Fear level of 5 during a 3 percent drop is not useful information. This happens because the lookback window is too long and the smoothing further delays the reading.
The gold signals that are supposed to mark high conviction bottoms often do not trigger when you expect them to. Looking at recent price action you can point to clear bottoms where the indicator stayed gray or showed low scores. This is partly the lag and partly because the scoring system requires multiple components to align which does not always happen at actual bottoms.
The indicator has only been tested on 15 minute QQQ charts during a few weeks of data. I do not know how it performs on other timeframes, other instruments, or during different market regimes like strong trends versus ranges. It may work very differently on individual stocks versus ETFs or on 5 minute versus 1 hour charts.
There is no formal backtest data showing win rate, average gain, maximum drawdown, or any other performance metrics. The scoring thresholds and component weights were set based on visual inspection and intuition rather than systematic optimization. They might be completely wrong.
Real Risks If You Use This
If you trade based on gold signals alone you will get caught in falling knives. The indicator does not know the difference between a normal pullback in an uptrend versus a breakdown that keeps going. You need your own analysis of market structure, key levels, and trend direction.
The lag means you will often be late to entries. By the time a gold signal appears price may have already bounced 1 to 2 percent off the low. This eats into your risk reward ratio. You might be buying near resistance when you think you are buying near support.
False signals happen regularly especially during choppy sideways action. You will see early and building signals that never develop into actual reversals. If you take every signal you will get chopped up.
The indicator can give conflicting information where the histogram shows green bars indicating fear is falling but the score is still low. Or red bars with a high score. This happens because color tracks momentum direction while score tracks absolute conditions. It is confusing in real time.
The volume profile calculations reset every 30 bars so the POC level jumps around. This can cause the POC component to trigger at seemingly random times. The value area high and low have similar issues.
Honest Pros and Cons
Pros: Combines multiple factors instead of relying on one signal. Color coded for quick visual assessment. Shows component breakdown so you understand why score is high or low. Includes volatility regime context. Free and customizable. Works in TradingView.
Cons: Significant lag during fast moves. No proven track record or backtest results. Complex with many moving parts that can conflict. Requires additional analysis to use effectively. Will produce false signals and missed opportunities. Thresholds and weights are arbitrary. Only tested on limited data.
How Someone Might Actually Use This
If you wanted to use this indicator despite its limitations here is a realistic approach. Keep it on your chart as one input among several. When price drops to a logical support level that you have identified independently, check if the indicator is showing elevated fear and building score. If fear level is above 60 and score is above 30 and you like the price action, that adds a bit of confirmation to your setup.
Do not take trades based solely on gold signals. Do not expect it to call exact bottoms. Do not use it in isolation. Think of it like a momentum oscillator that has some additional context baked in. It might help you avoid buying when there is no fear which means no panic to fade. But it will not tell you when to buy with any precision.
You would need to set your stop losses based on price structure not based on the indicator. Manage position size appropriately because this tool does not reduce risk. Keep records of which signals worked and which failed so you can learn its actual behavior rather than what you hope it does.
Settings Guidance
The default threshold of 40 seems reasonable for 15 minute charts in normal volatility. Going lower will increase signals but also increase noise. Going higher will reduce signals and may cause you to miss opportunities. I do not have data to recommend optimal settings.
The smoothing period of 5 is a compromise between responsiveness and stability. Lower numbers like 3 will be jumpier. Higher numbers like 7 will be smoother but slower. Again no data on what works best.
You can disable components if you want simpler scoring. For example if you only care about divergence and support you can turn off volume and POC. This will make scores lower overall but more focused on specific patterns.
Development Status
This indicator was built in a few hours as an experiment. It has not gone through rigorous testing or optimization. There are known issues that need fixing particularly the lag problem. I may continue developing it or I may abandon it. No guarantees on updates or support.
The code is provided as is. If you modify it or break it that is on you. The calculations could have bugs I have not found. The logic might be flawed in ways I have not realized.
Bottom Line
This is an experimental multi-factor fear indicator with significant limitations including lag, untested performance, and complexity. It might provide some useful context when combined with solid price action analysis and risk management. It will not make you money by itself. It will produce false signals and miss real opportunities. Use it as supplementary information at best and do not rely on it for trading decisions without your own analysis. If you use it, track results carefully and be skeptical of what it tells you until you have proven to yourself that it adds value to your process.
Scout Regiment - D17# Scout Regiment - D17 Indicator
## English Documentation
### Overview
Scout Regiment - D17 is a comprehensive TradingView indicator that combines multiple technical analysis tools into one powerful overlay indicator. It provides traders with market structure analysis, divergence detection, volume profiling, smart money concepts, and session analysis.
### Key Features
#### 1. **EMA (Exponential Moving Averages)**
- **Purpose**: Trend identification and dynamic support/resistance levels
- **Configuration**: 13 customizable EMAs with adjustable periods
- **Default Active EMAs**: EMA 3 (21), EMA 5 (55), EMA 7 (144), EMA 8 (233)
- **Uses**: Identify trend direction, entry/exit points, and trend strength
- **Color Coding**: Different colors for easy visual distinction
#### 2. **TFMA (Timeframe Moving Averages)**
- **Purpose**: Multi-timeframe trend analysis
- **Features**:
- 3 EMAs on higher timeframes
- Dynamic labels showing trend direction
- Price difference percentage display
- Customizable timeframe settings
- **Default Settings**: 21-period timeframe with lengths 55, 144, and 233
- **Benefits**: Align trades with higher timeframe trends
#### 3. **DFMA (Daily Frame Moving Averages)**
- **Purpose**: Daily timeframe perspective on any chart
- **Features**: Similar to TFMA but specifically for daily analysis
- **Default Timeframe**: 1D (Daily)
- **Use Case**: Long-term trend confirmation and positioning
#### 4. **PMA (Price Moving Averages)**
- **Purpose**: Price channel analysis with filled areas
- **Configuration**: 7 customizable moving averages with fill zones
- **Default Lengths**: 12, 144, 169, 288, 338, 576, 676
- **Visual**: Color-filled zones between selected MAs for channel trading
#### 5. **VWAP (Volume Weighted Average Price)**
- **Purpose**: Institutional trading levels and fair value
- **Features**:
- Multiple anchor periods (Session, Week, Month, Quarter, Year, etc.)
- Standard deviation bands
- Corporate event anchoring (Earnings, Dividends, Splits)
- **Use Case**: Identify institutional support/resistance and mean reversion opportunities
#### 6. **Divergence Detector**
- **Purpose**: Identify potential trend reversals
- **Supported Indicators**: MACD, MACD Histogram, RSI, Stochastic, CCI, Williams %R, Bias, Momentum, OBV, SOBV, VWmacd, CMF, MFI, and external indicators
- **Divergence Types**:
- Regular Bullish/Bearish
- Hidden Bullish/Bearish
- **Features**:
- Automatic divergence line drawing
- Customizable detection parameters
- Color-coded alerts
#### 7. **Volume Profile & Node Detection**
- **Purpose**: Identify key price levels based on volume distribution
- **Features**:
- Volume Profile with POC (Point of Control)
- Value Area High (VAH) and Value Area Low (VAL)
- Peak and trough volume node detection
- Highest/lowest volume node highlighting
- **Lookback**: Configurable (default 377 bars)
- **Use Case**: Identify support/resistance zones and liquidity areas
#### 8. **Smart Money Concepts**
- **Purpose**: Track institutional trading patterns
- **Features**:
- Market Structure (BOS - Break of Structure, CHoCH - Change of Character)
- Internal and Swing structures
- Strong/Weak Highs and Lows
- Equal Highs/Lows detection
- Fair Value Gaps (FVG)
- **Modes**: Historical or Present (latest only)
- **Use Case**: Trade with institutional flow
#### 9. **Trading Sessions**
- **Purpose**: Analyze market behavior during different global sessions
- **Available Sessions**:
- Asian Session
- Sydney, Tokyo, Shanghai, Hong Kong
- European Session
- London, New York, NYSE
- **Features**:
- Session boxes with high/low visualization
- Real-time countdown timers
- Volume and price change tracking
- Information table with session statistics
- **Customization**: Choose which sessions to display, colors, and box styles
### How to Use
#### For Trend Following:
1. Enable EMAs 3, 5, 7, and 8
2. Use TFMA for higher timeframe confirmation
3. Look for price above/below key EMAs for trend direction
4. Use VWAP as additional confirmation
#### For Reversal Trading:
1. Enable Divergence Detector with MACD Histogram and Bias
2. Look for divergences at key support/resistance levels
3. Confirm with Smart Money CHoCH signals
4. Use Volume Profile nodes as entry/exit targets
#### For Intraday Trading:
1. Enable Trading Sessions
2. Focus on high-volume sessions (London, New York overlap)
3. Use session highs/lows as support/resistance
4. Trade Fair Value Gaps during active sessions
#### For Swing Trading:
1. Use DFMA for daily trend
2. Enable PMA for channel identification
3. Look for price reactions at volume profile value areas
4. Confirm with swing structure breaks
### Best Practices
1. **Don't Overcrowd**: Enable only the components you need for your strategy
2. **Multi-Timeframe Analysis**: Always check higher timeframe TFMA/DFMA
3. **Confluence**: Look for multiple signals confirming the same direction
4. **Volume Confirmation**: Use Volume Profile to validate price action
5. **Session Awareness**: Be aware of which session is active for volatility expectations
### Performance Optimization
- Disable unused features to improve chart loading speed
- Use "Present Mode" for Smart Money Concepts if historical data isn't needed
- Reduce Volume Profile lookback period on slower devices
### Alerts
The indicator includes alert conditions for:
- All divergence types (8 conditions)
- Smart Money structure breaks (8 conditions)
- Equal highs/lows detection
- Fair Value Gaps formation
---
## 中文说明文档
### 概述
Scout Regiment - D17 是一款综合性TradingView指标,将多个技术分析工具整合到一个强大的叠加指标中。它为交易者提供市场结构分析、背离检测、成交量分析、聪明钱概念和时区分析。
### 核心功能
#### 1. **EMA(指数移动平均线)**
- **用途**:趋势识别和动态支撑阻力位
- **配置**:13条可自定义周期的EMA
- **默认启用**:EMA 3(21)、EMA 5(55)、EMA 7(144)、EMA 8(233)
- **应用**:识别趋势方向、进出场点位和趋势强度
- **颜色编码**:不同颜色便于视觉区分
#### 2. **TFMA(时间框架移动平均线)**
- **用途**:多时间框架趋势分析
- **特点**:
- 3条更高时间框架的EMA
- 显示趋势方向的动态标签
- 价格差异百分比显示
- 可自定义时间框架设置
- **默认设置**:21周期时间框架,长度为55、144和233
- **优势**:使交易与更高时间框架趋势保持一致
#### 3. **DFMA(日线框架移动平均线)**
- **用途**:在任何图表上提供日线时间框架视角
- **特点**:与TFMA类似,但专门用于日线分析
- **默认时间框架**:1D(日线)
- **使用场景**:长期趋势确认和定位
#### 4. **PMA(价格移动平均线)**
- **用途**:价格通道分析与填充区域
- **配置**:7条可自定义的移动平均线,带填充区域
- **默认长度**:12、144、169、288、338、576、676
- **视觉效果**:选定MA之间的彩色填充区域,用于通道交易
#### 5. **VWAP(成交量加权平均价格)**
- **用途**:机构交易水平和公允价值
- **特点**:
- 多个锚定周期(交易日、周、月、季度、年等)
- 标准差波段
- 企业事件锚定(财报、分红、拆股)
- **使用场景**:识别机构支撑阻力和均值回归机会
#### 6. **背离检测器**
- **用途**:识别潜在趋势反转
- **支持指标**:MACD、MACD柱状图、RSI、随机指标、CCI、威廉指标、乖离率、动量、OBV、SOBV、VWmacd、CMF、MFI及外部指标
- **背离类型**:
- 常规看涨/看跌背离
- 隐藏看涨/看跌背离
- **特点**:
- 自动绘制背离连线
- 可自定义检测参数
- 颜色编码警报
#### 7. **成交量分布与节点检测**
- **用途**:基于成交量分布识别关键价格水平
- **特点**:
- 成交量分布图与POC(控制点)
- 价值区域高点(VAH)和低点(VAL)
- 峰值和低谷成交量节点检测
- 最高/最低成交量节点突出显示
- **回溯期**:可配置(默认377根K线)
- **使用场景**:识别支撑阻力区域和流动性区域
#### 8. **聪明钱概念**
- **用途**:追踪机构交易模式
- **特点**:
- 市场结构(BOS-突破结构、CHoCH-结构转变)
- 内部和摆动结构
- 强/弱高低点
- 等高/等低检测
- 公允价值缺口(FVG)
- **模式**:历史模式或当前模式(仅最新)
- **使用场景**:跟随机构资金流动交易
#### 9. **交易时区**
- **用途**:分析不同全球时段的市场行为
- **可用时段**:
- 亚洲时段
- 悉尼、东京、上海、香港
- 欧洲时段
- 伦敦、纽约、纽交所
- **特点**:
- 时段方框显示高低点
- 实时倒计时
- 成交量和价格变化追踪
- 时段统计信息表格
- **自定义**:选择显示哪些时段、颜色和方框样式
### 使用方法
#### 趋势跟随策略:
1. 启用EMA 3、5、7和8
2. 使用TFMA进行更高时间框架确认
3. 观察价格在关键EMA上方/下方确定趋势方向
4. 使用VWAP作为额外确认
#### 反转交易策略:
1. 启用背离检测器(MACD柱状图和乖离率)
2. 在关键支撑阻力位寻找背离
3. 用聪明钱CHoCH信号确认
4. 使用成交量分布节点作为进出场目标
#### 日内交易策略:
1. 启用交易时区
2. 关注高成交量时段(伦敦、纽约重叠时段)
3. 使用时段高低点作为支撑阻力
4. 在活跃时段交易公允价值缺口
#### 波段交易策略:
1. 使用DFMA确定日线趋势
2. 启用PMA识别通道
3. 观察价格在成交量分布价值区域的反应
4. 用摆动结构突破确认
### 最佳实践
1. **避免过度拥挤**:仅启用策略所需的组件
2. **多时间框架分析**:始终检查更高时间框架的TFMA/DFMA
3. **汇合点**:寻找多个信号确认同一方向
4. **成交量确认**:使用成交量分布验证价格行为
5. **时段意识**:了解当前活跃时段以预期波动性
### 性能优化
- 禁用未使用的功能以提高图表加载速度
- 如果不需要历史数据,对聪明钱概念使用"当前模式"
- 在较慢设备上减少成交量分布回溯期
### 警报
指标包含以下警报条件:
- 所有背离类型(8个条件)
- 聪明钱结构突破(8个条件)
- 等高/等低检测
- 公允价值缺口形成
---
## Technical Support
For questions or issues, please refer to the TradingView community or contact the indicator creator.
## 技术支持
如有问题,请参考TradingView社区或联系指标创建者。

Periodic Volume Time Velocity ProfileThis is the Periodic Volume Time Velocity Profile (PVTVP). It is an advanced professional profiling tool that goes beyond standard volume analysis by introducing Time and Velocity (Flow Rate) as profile dimensions.
By analyzing high-resolution intra-bar data, it builds
precise profiles for any custom period (Session, Day, Week, etc.),
helping you understand not just *where* the market traded,
but *how* it traded there.
## The 3 Dimensions of the Market
Unlike standard tools that only show Volume, PVTVP allows you
to switch between three critical metrics:
1. **VOLUME Profile (The "Where"):**
* Shows standard acceptance. High volume nodes (HVN)
are magnets for price.
2. **TIME Profile (The "How Long"):**
* Similar to TPO, it measures how long price spent at each
level.
* **High Time:** True acceptance and fair value.
* **Low Time:** Rejection or rapid movement.
3. **VELOCITY Profile (The "How Fast"):**
* Measures the **speed of trading** (Contracts per Second).
This reveals the hidden intent of market participants.
* **High Velocity (Fast Flow):** Aggression. Initiative
buyers/sellers are hitting market orders rapidly. Often
seen at breakouts or in liquidity vacuums.
* **Low Velocity (Slow Flow):** Absorption. Massive passive
limit orders are slowing price down despite high volume.
Often seen at major reversals ("hitting a brick wall").
## Key Features
1. **Statistical Volume Profile Engine:** For each bar in the selected
period, the indicator builds a complete volume profile on a lower
'Intra-Bar Timeframe'. Instead of simple tick counting, it uses
**statistical models ('PDF' allocation)** to distribute volume
across price levels and **advanced classifiers ('Dynamic' split)**
to determine the buy/sell pressure within that profile.
2. **Flexible Profile Display:** The **finalized profile** (plotted at
the end of each period) can be visualized in three distinct
ways: 'Up/Down' (buy vs. sell), 'Total' (combined volume),
and 'Delta' (net difference).
3. **Developing Key Levels:** The indicator also plots the developing
Point of Control (POC), Value Area (VA), VWAP, and Standard
Deviation bands in real-time as the period unfolds, providing
live insights into the emerging market structure.
4. **Dynamic Row Sizing:** Includes an option ('Rows per Percent')
to automatically adjust the number of profile rows (buckets)
based on the profile's price range, maintaining a consistent
visual density.
5. **Integrated Alerts:** Includes 12 alerts that trigger when the
main price crosses over or under the key developing levels:
POC, VWAP, Value Area High/Low, and the +/- Standard
Deviation bands.
**Caution: Real-Time Data Behavior (Intra-Bar Repainting)**
This indicator uses high-resolution intra-bar data. As a result, the
values on the **current, unclosed bar** (the real-time bar) will
update dynamically as new intra-bar data arrives. This behavior is
normal and necessary for this type of analysis. Signals should only
be considered final **after the main chart bar has closed.**
---
**DISCLAIMER**
1. **For Informational/Educational Use Only:** This indicator is
provided for informational and educational purposes only. It does
not constitute financial, investment, or trading advice, nor is
it a recommendation to buy or sell any asset.
2. **Use at Your Own Risk:** All trading decisions you make based on
the information or signals generated by this indicator are made
solely at your own risk.
3. **No Guarantee of Performance:** Past performance is not an
indicator of future results. The author makes no guarantee
regarding the accuracy of the signals or future profitability.
4. **No Liability:** The author shall not be held liable for any
financial losses or damages incurred directly or indirectly from
the use of this indicator.
5. **Signals Are Not Recommendations:** The alerts and visual signals
(e.g., crossovers) generated by this tool are not direct
recommendations to buy or sell. They are technical observations
for your own analysis and consideration.

PA + Big Candle Zones + EMA Pack (14/100/200/720) • TH v2.0PA + Big Candle Zones + EMA Pack (14/100/200/720) • TH v2.0
What it does
EMA Pack: 14/100/200/720 เลือกสไตล์เส้นได้ เปิด–ปิดเป็นรายเส้น
Price Action 10 แบบ: Bull/Bear Engulfing, Hammer, Shooting Star, Morning/Evening Star, Tweezer Bottom/Top, Bull/Bear Marubozu
Double Bottom (คอเสื้อ): เลือกยืนยันเฉพาะ “ปิดเหนือคอเสื้อ” ได้
BJ Key Levels: รวมระดับเป็นคลัสเตอร์ตาม % + เช็ก “ราคาใกล้ระดับสำคัญ”
Donchian Channel: ขอบบน/ล่าง + Midline เปลี่ยนสีตามฝั่งราคา (มีสัญญาณครอส BUY/SELL)
Big Candle Zones (Supply/Demand): ตรวจแท่งใหญ่ (ATR*k หรือ Body/Range), รวมโซน, อายุโซน, break buffer, แสดงเฉพาะ N โซนที่ใกล้ราคา
RSI: แถบ OB/OS + Regular Divergence (จุด/เส้น) + ตาราง RSI มุมจอ
Volume Profile (Fixed Range): POC + Value Area (อัปเดตแถบล่าสุด)
How to use (quick)
ดู Bias จาก Donchian Midline (เขียว=เหนือ, แดง=ใต้)
หา PA ฝั่งเดียวกับเทรนด์ใกล้ Big Candle Zone (Demand/Supply)
ถ้ามี BJ Near หรือ RSI Divergence ใช้เป็นตัวกรองจังหวะเข้า/ออก
วาง SL/TP ด้วยขอบโซน, Midline/ขอบ Donchian, POC/VA
Important inputs
Double Bottom: Pivot L/R, min bars apart, tolerance %, require close above neckline
Big Candle: ATR Len/Mult, Body/Range, EdgeFrac, (Option) Vol≥SMA20*k, Max zones near price, Expire bars, Break buffer %
BJ: Pivot L/R, Min touches, Cluster %, Near %, Max levels, Extend right
Donchian Len, RSI 14 (OB/OS/Extreme), VP: Bars/Rows/VA%
Alerts included
PA ทั้งหมด: Engulfing, Hammer, Shooting Star, Morning/Evening Star, Tweezer Bottom/Top, Marubozu
Double Bottom: (Confirm) / (Bottom#2)
BJ: Price near key level
Donchian Midline: BUY / SELL
RSI: Overbought/Extreme, Oversold/Extreme, Bullish/Bearish Divergence, Crossback
Notes
สัญญาณที่พึ่งพา pivot (Double Bottom/RSI Div) ยืนยันช้าตามธรรมชาติ
โซน Big Candle ถูก “รวม/หมดอายุ/ลบเมื่อเบรก” อัตโนมัติ
อินดี้นี้เป็นเครื่องมือช่วยตัดสินใจ ไม่ใช่คำแนะนำการลงทุน

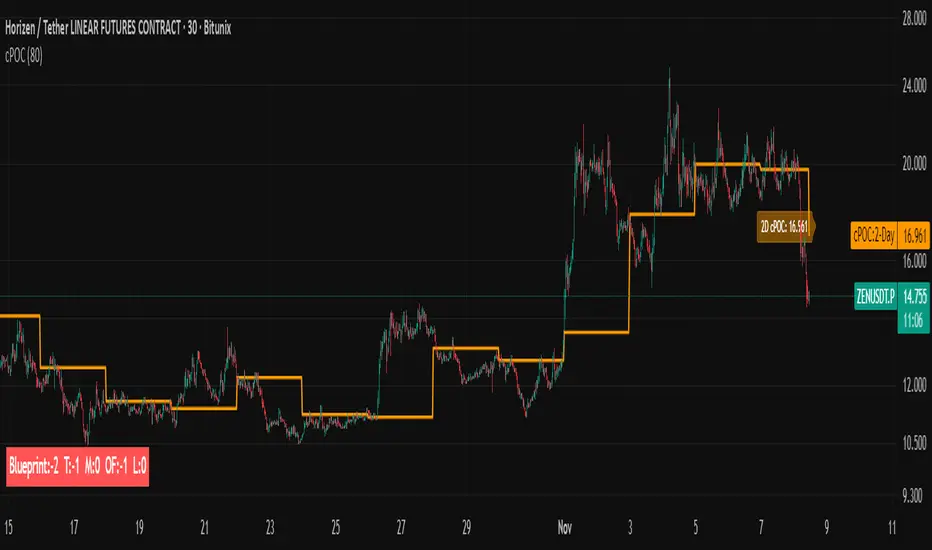
cPOC 2 DayIt’s perfect for your 2-Day cPOC since:
It derives from volume distribution data.
It highlights market structure, value area, and composite volume behavior.
Traders searching for “cPOC,” “volume profile,” or “market profile” will find it here.
Use this if your indicator’s main function is showing POCs, VAH/VAL, or composite volume balance zones.
If your cPOC script is part of a broader system:
Trend Analysis — if it’s used for directional bias and context with VWAP/EMAs.
Support/Resistance — if the tool primarily highlights POC/VAH/VAL as static levels to trade from.
Other — only if your indicator mixes data from multiple frameworks (e.g., combines orderflow, delta, VWAP, and TPO).
Volumemetrix Variance StrategyThe “Volumemetrix Variance Strategy” is an advanced Pine Script strategy designed to identify trade entries and exits using a combination of volume profile analysis, candle structure, and volatility filters. It constructs a dynamic volume profile over a specified lookback period to identify critical price levels such as the Point of Control (PoC), Value Area High (VAH), and Value Area Low (VAL). These levels represent zones of high trading activity that often act as support and resistance. The script smooths and adjusts these levels across different timeframes to align short-term market structure with higher-timeframe trends. It incorporates a variety of filters to exclude doji candles, detect continuation or rejection patterns, and confirm alignment with higher timeframe candle direction (e.g., 4-hour bullish or bearish bias).
Trade logic is built around detecting crossovers and breakouts relative to the PoC and value areas. The system can trigger entries based on several configurable behaviors: breakout, retake, bounce, reversal, or rejection near key volume zones. It supports flexible entry conditions for long, short, or both sides of the market, as well as a range of customizable settings for time-based trading restrictions, end-of-day position closures, and alert-based data capture. For execution, the script includes integrated risk management—users can specify take-profit and stop-loss levels, enable moving (trailing) stops, and even apply a “power curve” model to dynamically adjust trailing stops using exponential decay logic that adapts to price progress.
Overall, the Volumemetrix Variance Strategy is a hybrid between a quantitative volume-based strategy and a volatility-adaptive trade manager. It combines fixed range volume profiling with multi-timeframe confirmation, candle pattern validation, and adaptive exit logic. Its architecture allows for detailed trade automation, alert generation for external systems, and real-time control over parameters such as ATR scaling, entry delay, or bar confirmation. The result is a high-granularity framework for both backtesting and live execution that seeks to capture statistically favorable setups around liquidity concentration zones.

Intra Bar Volume ProfileThis indicator provides a high-resolution volume profile analysis for every single bar on the chart. It builds this profile by sampling data from a lower intra-bar timeframe, allowing for a granular view of price distribution and buying/selling pressure within the bar.
Key Features:
Intra-Bar Profile Engine: For each bar on the main chart, the indicator builds a complete volume profile on a lower 'Intra-Bar Timeframe'. It uses:
Statistical Models ('Allot model'): Distributes volume across price levels using 'PDF' (Probability Density Function) or 'Classic' (close) methods.
Buy/Sell Classifiers ('Volume Estimator'): Splits volume using a 'Dynamic' (trend/wick-based) or 'Classic' (candle color) model.
On-Chart Visualization (Overlay): The analysis is rendered directly onto the price bars:
Point of Control (POC): A line showing the price level with the most volume for that bar.
Value Area (VA): A colored box representing the price range where the specified percentage (e..g., 50%) of volume was traded.
VWAP: Displays the volume-weighted average price (VWAP) for the bar as a separate line.
Integrated Alerts: Includes 8 alerts that trigger when the main price crosses over or under the key intra-bar levels: POC, VWAP, and the Value Area High/Low.
Caution: Real-Time Data Behavior (Intra-Bar Repainting) This indicator uses high-resolution intra-bar data. As a result, the values on the current, unclosed bar (the real-time bar) will update dynamically as new intra-bar data arrives. This behavior is normal and necessary for this type of analysis. Signals should only be considered final after the main chart bar has closed.
DISCLAIMM
For Informational/Educational Use Only: This indicator is provided for informational and educational purposes only. It does not constitute financial, investment, or trading advice, nor is it a recommendation to buy or sell any asset.
Use at Your Own Risk: All trading decisions you make based on the information or signals generated by this indicator are made solely at your own risk.
No Guarantee of Performance: Past performance is not an indicator of future results. The author makes no guarantee regarding the accuracy of the signals or future profitability.
No Liability: The author shall not be held liable for any financial losses or damages incurred directly or indirectly from the use of this indicator.
Signals Are Not Recommendations: The alerts and visual signals (e.g., crossovers) generated by this tool are not direct recommendations to buy or sell. They are technical observations for your own analysis and consideration.

Periodic Volume ProfileThis indicator visualizes volume profiles that are dynamically anchored to market structure events, rather than fixed time intervals. It builds these profiles using high-resolution intra-bar data to provide a precise view of where value is established during critical market phases.
Key Features:
Event-Based Profile Anchoring: The indicator starts a new profile based on one of three user-selected events ('Profile Anchor'):
Swing: A new profile begins when the 'impulse baseline' (derived from delta) changes. This baseline adjusts when a new price pivot is confirmed: When a price high forms, the baseline moves to the lower of its previous level or the peak delta (max of delta O/C) at the pivot. When a price low forms, it moves to the higher of its previous level or the trough delta (min of delta O/C).
Structure: A new profile begins immediately on the bar that confirms a market structure break (e.g., a new HH or LL, based on a sequence of price pivots).
Delta: A new profile begins immediately on the bar that confirms a break in the cumulative delta's market structure (e.g., a new HH or LL in the delta).
Statistical Profile Engine: For each bar in the anchored period, the indicator builds a volume profile on a lower 'Intra-Bar Timeframe'. It uses:
Statistical Models ('Allot model'): Distributes volume across price levels using 'PDF' (Probability Density Function) or 'Classic' (close) methods.
Buy/Sell Classifiers ('Volume Estimator'): Splits volume using a 'Dynamic' (trend/wick-based) or 'Classic' (candle color) model.
Note on Anchor Lag: The different anchor types have different delays. 'Structure' and 'Delta' profiles begin in real-time on the confirmation bar. The 'Swing' profile calculation is plotted retroactively to the pivot's origin, as the pivot is only confirmed Pivot Right Bars after it occurs.
Flexible Visualization Modes: The finalized profile (plotted at the end of each period) can be displayed in three ways: 'Up/Down' (buy vs. sell), 'Total' (combined volume), and 'Delta' (net difference).
Developing Real-Time Metrics: The indicator plots the developing Point of Control (POC), Value Area (VA), VWAP, and Standard Deviation bands in real-time as the new profile forms.
Dynamic Row Sizing: Includes an option ('Rows per Percent') to automatically adjust the number of profile rows (buckets) based on the profile's price range, maintaining a consistent visual density.
Integrated Alerts: Includes 13 alerts that trigger for:
A new profile reset ('Profile was resetted').
Price crossing any of the 6 developing levels (POC, VA High/Low, VWAP, StdDev High/Low).
Caution: Real-Time Data Behavior (Intra-Bar Repainting) This indicator uses high-resolution intra-bar data. As a result, the values on the current, unclosed bar (the real-time bar) will update dynamically as new intra-bar data arrives. This behavior is normal and necessary for this type of analysis. Signals should only be considered final after the main chart bar has closed.
DISCLAIMER
For Informational/Educational Use Only: This indicator is provided for informational and educational purposes only. It does not constitute financial, investment, or trading advice, nor is it a recommendation to buy or sell any asset.
Use at Your Own Risk: All trading decisions you make based on the information or signals generated by this indicator are made solely at your own risk.
No Guarantee of Performance: Past performance is not an indicator of future results. The author makes no guarantee regarding the accuracy of the signals or future profitability.
No Liability: The author shall not be held liable for any financial losses or damages incurred directly or indirectly from the use of this indicator.
Signals Are Not Recommendations: The alerts and visual signals (e.g., crossovers) generated by this tool are not direct recommendations to buy or sell. They are technical observations for your own analysis and consideration.

Meeting Point TrackerDescription
This script — Options – Meeting Point — visually combines Call (CE) and Put (PE) option candles of the same strike into a single layout, designed for intraday option traders who monitor both legs simultaneously.
💡 Key Features
🔹 Dual Candle Display
Plots CE candles in green/red and PE candles in blue/magenta.
Both legs appear on the same panel — perfect for straddle/strangle monitoring.
🔹 Automatic Symbol Builder
Auto-constructs CE/PE symbols from spot index, expiry, and strike.
Manual override supported for custom inputs.
🔹 Live BEP & Levels(Under testing)
Displays intraday CE/PE highs & lows with dotted lines.
Shows Live Break-Even Points (BEP) for the straddle — updated tick-by-tick.
Optional manual price line for quick visual references.
🔹 VWAP Support
Plots VWAP for both CE and PE options individually (toggleable).
Helps compare momentum and strength between both sides.
🔹 Point of Control (POC)
Calculates dynamic intraday POC using 1-minute price–volume density.
Updates automatically as new data streams in.
🔹 Trade Blocks (Per-Leg)
Define trade details for CALL and PUT independently:
Entry, SL, Target, Quantity, Side (Buy/Sell).
Calculates Live P&L and Status (“Target Hit”, “SL Hit”, or “Live”).(Under testing)
⚠️ Disclaimer
This indicator is for educational and analytical purposes only.
It does not constitute financial advice or trade recommendations.
Past performance is not indicative of future results.

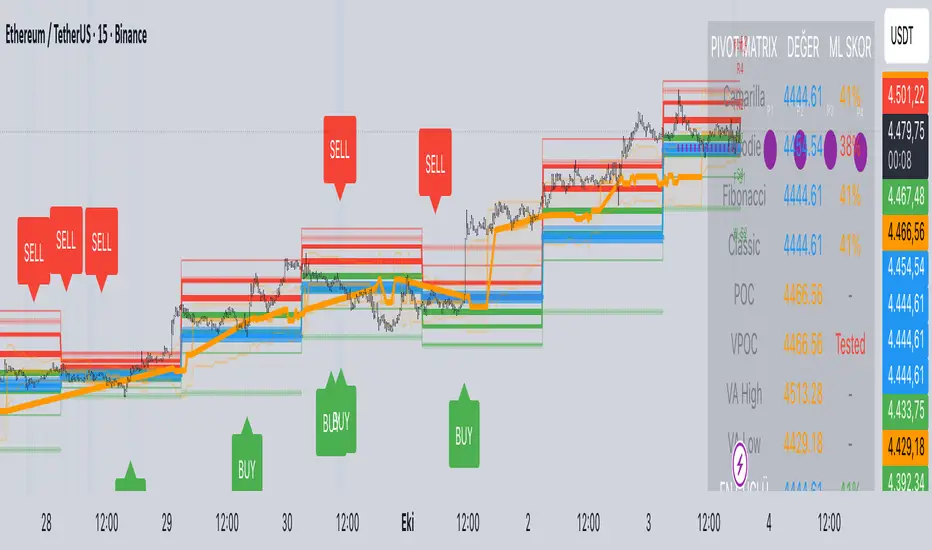
Predictive Pivot Matrix OHLC data, integrates volume profile for POC/Value Area tracking (including virgin POC), applies rule-based "ML" scoring to evaluate pivot strength via factors like proximity, volume, touches, trend, and confluence, monitors adaptive success rates, projects 5-day future pivots using trend/volatility, detects overlapping confluence zones, and generates visuals (lines, labels, table), alerts, and buy/sell signals on key crossings.
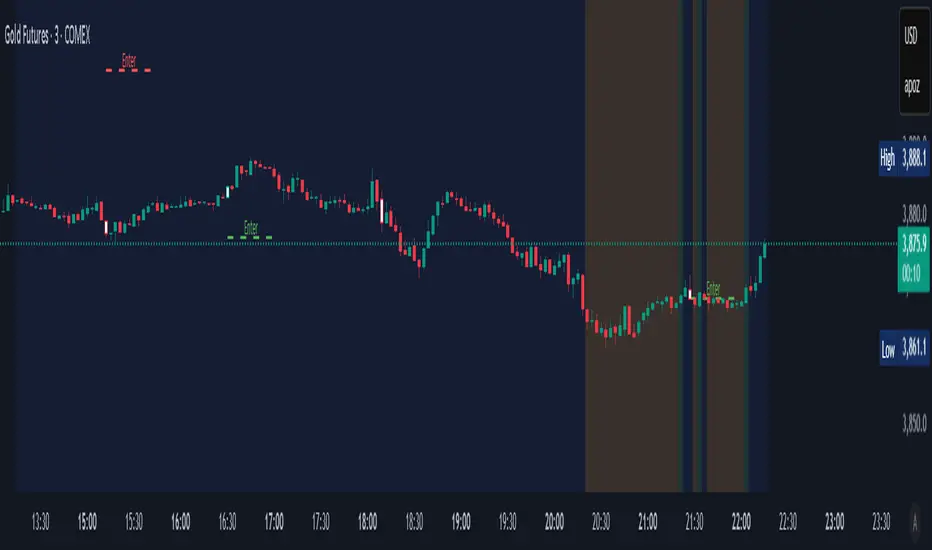
FEI: Futures Entry Identifier📘 FEI: Futures Entry Identifier
FEI is a modular, futures-grade entry engine designed for precision trading across GC1!, MNQ1!, ES1!, and related contracts. It combines manual SVP structure, CHoCH detection, and Colby-style candle strength filters to identify high-probability long and short entries.
🔧 Features
• Manual SVP inputs (VAH, VAL, POC)
• Symbol-aware filters for micro vs standard contracts
• Multi-timeframe signal logic (3m, 5m, 10m, 15m, 30m)
• CHoCH detection with optional engulfing filter (default off)
• FRVP entry zone plotting after CHoCH confirmation
• Candle coloring on CHoCH trigger
• Session-aware logic (ETH default, optional RTH-only)
• Narratable visuals and audit-safe alerts
🧭 How to Use
1. Input VAH, VAL, and POC manually
2. Select signal timeframe (e.g. 3m or 5m)
3. Watch for CHoCH (white candle = structural shift)
4. Entry line plots at top/bottom of recent range
5. Long/short markers appear when SVP + candle strength align
6. Toggle RTH-only mode if needed
🌟 Why It’s Unique
FEI is built for traders who demand clarity, structure, and precision. Every signal is narratable, audit-safe, and resolution-aware—ideal for futures overlays and sniper-grade entries.
SCTI - D14SCTI - D14 Comprehensive Technical Analysis Suite
English Description
SCTI D14 is an advanced multi-component technical analysis indicator designed for professional traders and analysts. This comprehensive suite combines multiple analytical tools into a single, powerful indicator that provides deep market insights across various timeframes and methodologies.
Core Components:
1. EMA System (Exponential Moving Averages)
13 customizable EMA lines with periods ranging from 8 to 2584
Fibonacci-based periods (8, 13, 21, 34, 55, 89, 144, 233, 377, 610, 987, 1597, 2584)
Color-coded visualization for easy trend identification
Individual toggle controls for each EMA line
2. TFMA (Multi-Timeframe Moving Averages)
Cross-timeframe analysis with 3 independent EMA calculations
Real-time labels showing trend direction and price relationships
Customizable timeframes for each moving average
Percentage deviation display from current price
3. PMA (Precision Moving Average Cloud)
7-layer moving average system with customizable periods
Fill areas between moving averages for trend visualization
Support and resistance zone identification
Dynamic color-coded trend clouds
4. VWAP (Volume Weighted Average Price)
Multiple anchor points (Session, Week, Month, Quarter, Year, Earnings, Dividends, Splits)
Standard deviation bands for volatility analysis
Automatic session detection and anchoring
Statistical price level identification
5. Advanced Divergence Detector
12 technical indicators for divergence analysis (MACD, RSI, Stochastic, CCI, Williams %R, Bias, Momentum, OBV, VW-MACD, CMF, MFI, External)
Regular and hidden divergences detection
Bullish and bearish signals with visual confirmation
Customizable sensitivity and filtering options
Real-time alerts for divergence formations
6. Volume Profile & Node Analysis
Comprehensive volume distribution analysis
Point of Control (POC) identification
Value Area High/Low (VAH/VAL) calculations
Volume peaks and troughs detection
Support and resistance levels based on volume
7. Smart Money Concepts
Market structure analysis with Break of Structure (BOS) and Change of Character (CHoCH)
Internal and swing structure detection
Equal highs and lows identification
Fair Value Gaps (FVG) detection and visualization
Liquidity zones and institutional flow analysis
8. Trading Sessions
9 major trading sessions (Asia, Sydney, Tokyo, Shanghai, Hong Kong, Europe, London, New York, NYSE)
Real-time session status and countdown timers
Session volume and performance tracking
Customizable session boxes and labels
Statistical session analysis table
Key Features:
Modular Design: Enable/disable any component independently
Real-time Analysis: Live updates with market data
Multi-timeframe Support: Works across all chart timeframes
Customizable Alerts: Set alerts for any detected pattern or signal
Professional Visualization: Clean, organized display with customizable colors
Performance Optimized: Efficient code for smooth chart performance
Use Cases:
Trend Analysis: Identify market direction using multiple EMA systems
Entry/Exit Points: Use divergences and structure breaks for timing
Risk Management: Utilize volume profiles and session analysis for better positioning
Multi-timeframe Analysis: Confirm signals across different timeframes
Institutional Analysis: Track smart money flows and market structure
Perfect For:
Day traders seeking comprehensive market analysis
Swing traders needing multi-timeframe confirmation
Professional analysts requiring detailed market structure insights
Algorithmic traders looking for systematic signal generation
---
中文描述
SCTI - D14是一个先进的多组件技术分析指标,专为专业交易者和分析师设计。这个综合套件将多种分析工具整合到一个强大的指标中,在各种时间框架和方法论中提供深度市场洞察。
核心组件:
1. EMA系统(指数移动平均线)
13条可定制EMA线,周期从8到2584
基于斐波那契的周期(8, 13, 21, 34, 55, 89, 144, 233, 377, 610, 987, 1597, 2584)
颜色编码可视化,便于趋势识别
每条EMA线的独立切换控制
2. TFMA(多时间框架移动平均线)
跨时间框架分析,包含3个独立的EMA计算
实时标签显示趋势方向和价格关系
每个移动平均线的可定制时间框架
显示与当前价格的百分比偏差
3. PMA(精密移动平均云)
7层移动平均系统,周期可定制
移动平均线间填充区域用于趋势可视化
支撑阻力区域识别
动态颜色编码趋势云
4. VWAP(成交量加权平均价格)
多个锚点(交易时段、周、月、季、年、财报、分红、拆股)
标准差带用于波动性分析
自动时段检测和锚定
统计价格水平识别
5. 高级背离检测器
12个技术指标用于背离分析(MACD、RSI、随机指标、CCI、威廉姆斯%R、Bias、动量、OBV、VW-MACD、CMF、MFI、外部指标)
常规和隐藏背离检测
看涨看跌信号配视觉确认
可定制敏感度和过滤选项
背离形成的实时警报
6. 成交量分布与节点分析
全面的成交量分布分析
控制点(POC)识别
价值区域高/低点(VAH/VAL)计算
成交量峰值和低谷检测
基于成交量的支撑阻力水平
7. 聪明钱概念
市场结构分析,包括结构突破(BOS)和结构转变(CHoCH)
内部和摆动结构检测
等高等低识别
公允价值缺口(FVG)检测和可视化
流动性区域和机构资金流分析
8. 交易时区
9个主要交易时段(亚洲、悉尼、东京、上海、香港、欧洲、伦敦、纽约、纽交所)
实时时段状态和倒计时器
时段成交量和表现跟踪
可定制时段框和标签
统计时段分析表格
主要特性:
模块化设计:可独立启用/禁用任何组件
实时分析:随市场数据实时更新
多时间框架支持:适用于所有图表时间框架
可定制警报:为任何检测到的模式或信号设置警报
专业可视化:清洁、有序的显示界面,颜色可定制
性能优化:高效代码确保图表流畅运行
使用场景:
趋势分析:使用多重EMA系统识别市场方向
入场/出场点:利用背离和结构突破进行时机选择
风险管理:利用成交量分布和时段分析进行更好定位
多时间框架分析:在不同时间框架间确认信号
机构分析:跟踪聪明钱流向和市场结构
适用于:
寻求全面市场分析的日内交易者
需要多时间框架确认的摆动交易者
需要详细市场结构洞察的专业分析师
寻求系统化信号生成的算法交易者

Universal Key Level IndicatorCustomizable indicator which provide key levels for:
NY Session
Asia Session
London Session
Globex Session
Previous Day OCHL
Previous Week OCHL
Previous Day VAH VAL POC
Previous Week VAH VAL POC

Fixed Range Volume Profile"Distribution of transaction volume by price group (transaction volume by price block)"
Instructions for use (Professional Manual)
1. a basic concept
By vertical axis (price), shows the cumulative trading volume traded in the segment.
The longer the block, the more transactions took place in that price range.
Colors distinguish between buying/selling strength (green = buying advantage, red = selling advantage).
2. Key components
POC (Point of Control)
→ Longest block (most traded price segment, "key selling point").
VAH / VAL (Value Area High/Low)
→ Top/bottom segments where approximately 70% of the total volume is formed.
→ Role of "Major Support/Resistance".
High Capacity Node (HVN)
→ Significantly higher trading volumes → strong support/resistance.
Low Volume Node (LVN)
→ Low volume section → areas where prices are easily passed.
3. practical application
Find Support/Resistance
The thickest block (POC) is used as a place where prices often rebound/resist.
a trading entry/liquidation strategy
Buy if the price is supported near HVN,
When breaking through the LVN, fast movement (gap movement) can be expected.
break/goal setting
Finger = Under the LVN,
Target = Next HVN.
Judgment of trends
When the block distribution is concentrated above, "Increase to Collection Section"
If you're driven below, you're "in a downtrend to a variance section."
4. Precautions
The volume distribution is "past data based" and is not an indicator of the future.
Rather than using it alone, it is more effective to combine with Fibonacci, trend lines, and candle patterns.
In particular, in the volatile market, the LVN breakthrough → may signal a surge/fall.
In summary, this block indicator is "a map showing the most market participants at any price point".
In other words, it is useful for finding support/resistance as a tool for analyzing sales and establishing the basis for trading strategies.

Weekly Volume Profile -Previous Week Projected into Current WeekThis indicator displays the Volume Profile of the previous week projected into the current week. It calculates the Point of Control (POC), Value Area High (VAH), and Value Area Low (VAL) based on the weekly volume distribution. Lines are extended to the right to provide a reference for the current week's trading. Optional small labels show PWPOC, PWVAH, and PWVAL. Ideal for traders who want to track key levels from the previous week and use them as support/resistance in the current week.
Features:
Customizable number of price bins
Adjustable Value Area percentage
POC, VAH, and VAL lines projected forward
Optional minimal labels for each level
Resets every week on Sunday 22:00 UTC

Volume Profile AnalysisThe Volume Profile Dashboard is a professional-grade analysis tool built for TradingView. It focuses on displaying a comprehensive volume profile breakdown within a dashboard format directly on the chart. The purpose of this tool is to help traders quickly assess buy versus sell volume dynamics, momentum, and sentiment in order to support informed trading decisions.
Instead of plotting simple bars, this indicator uses a detailed table and visual progress bar to summarize live and historical market activity. By condensing key metrics into a structured format, traders can analyse market behaviour without manually calculating or switching between multiple indicators.
________________________________________
How the Script Works
1. Data Gathering
The script uses lower-timeframe price and volume data to calculate buy volume, sell volume, and total traded volume for the current and previous candles.
2. Volume Allocation
Buy and sell volumes are estimated by looking at the candle’s range (high to low) and how the closing price aligns within that range. The closer the close is to the high, the stronger the buying pressure. The closer the close is to the low, the stronger the selling pressure.
3. Delta and Momentum
o Delta measures the difference between buy and sell volume.
o Volume momentum compares the current candle’s activity to the previous one, showing if interest is rising or fading.
4. Point of Control (POC)
An average of high, low, and close is calculated to give an approximate “point of control” level—an area of balance where buyers and sellers previously agreed on price.
5. Dashboard Visualization
All these calculations are displayed inside a clean dashboard table with separate rows for the current candle, previous candle, and a summary row. Icons, colors, and progress bars make it visually intuitive.
6. On-Chart Progress Indicator
A dynamic horizontal progress bar is plotted on the chart above price, showing the balance between buy and sell volume for the latest activity.
7. Alerts
Built-in alerts trigger when strong buying or selling pressure is detected or when there is a significant spike in total traded volume.
________________________________________
How This Tool Can Be Used
• Intraday Trading: Quickly gauge whether buyers or sellers are in control of the market at any moment.
• Swing Trading: Compare momentum shifts between candles to identify early trend reversals.
• Risk Management: Use delta and sentiment signals to confirm whether to hold or reduce exposure.
• Confirmation: Align the volume profile dashboard with other indicators (such as RSI, MACD, or trendlines) for stronger trading conviction.
________________________________________
Using Mixed Indicators for Decisions
This dashboard alone provides volume insights, but better decisions come when it is combined with other tools:
• Pairing it with an RSI can show whether heavy buying is happening in overbought conditions.
• Combining with a SuperTrend or moving averages can confirm if volume momentum aligns with the price trend.
• Overlaying support/resistance levels can identify whether strong buy/sell signals occur at critical levels.
Mixed indicators prevent relying on one signal alone, reducing false trades.
________________________________________
Importance of This Tool
• Clarity: Condenses complex volume data into a simple, visual format.
• Speed: Traders can react faster with pre-calculated buy/sell percentages.
• Precision: Highlights hidden imbalances that are not obvious from candles alone.
• Professional-grade dashboard: Offers an institutional-style view of market behavior directly within TradingView.
________________________________________
Parameters in the Dashboard Table
• Period: Shows whether the row is for the current or previous candle, along with trend arrows.
• Price Range: The high–low range of the candle.
• Total Volume: The sum of buy and sell activity.
• Buy Volume / Sell Volume: Separated distribution of transactions leaning bullish or bearish.
• Delta: The net difference between buy and sell volumes, highlighting pressure imbalance.
• Buy % / Sell %: The percentage contribution of each side to total volume.
• POC: An average reference level where market consensus was strongest.
• Progress: A graphical bar showing buy vs sell dominance.
• Signal: Simplified output like Strong Buy, Buy, Strong Sell, Sell, Neutral.
• Summary Row: Compares changes between the current and previous candles and gives overall market sentiment.
________________________________________
Stock Market Disclaimer
This tool is for educational and informational purposes only. It does not constitute financial advice, investment advice, or trading recommendations. The stock market and cryptocurrency markets involve high risk. Traders and investors should do their own research and consult licensed financial advisors before making investment decisions. Past performance is not indicative of future results.
________________________________________
Misuse Disclaimer
This script has been developed as per TradingView’s rules and is intended for responsible trading analysis only. Any misuse, redistribution, or modification outside of TradingView’s policies is discouraged. The author and platform are not responsible for financial losses, misinterpretation of signals, or misuse of the code.
________________________________________
Disclaimer
Training & Educational Only — This material and the indicator are provided for educational purposes only. Nothing here is investment advice or a solicitation to buy or sell financial instruments. Past simulated or historical performance does not predict future results. Always perform full back testing and risk management, and consider seeking advice from a qualified financial professional before trading with real capital.
________________________________________

VPOC Harmonics - Liquidity-Weighted Price / Time RatiosVPOC Harmonics - Liquidity-Weighted Price / Time Ratios
Summary
This indicator transforms a swing’s price range, duration, and liquidity profile into a structured set of price-per-bar ratios. By anchoring two points and manually entering the swing’s VPOC (highest-volume price), it generates candidate compression values that unify price, time, and liquidity structure. These values can be applied to chart scaling, harmonic testing, and liquidity-aware market geometry.
________________________________________
Overview
Most swing analysis tools only consider price (ΔP) and time (N bars). This script goes further by incorporating the VPOC (Point of Control) — the price with the highest traded volume — directly into swing geometry.
• Anchors define the swing’s Low (L), High (H), and bar count (N).
• The user manually enters the VPOC (highest-volume price).
• The indicator then computes a suite of ratios that integrate range, duration, and liquidity placement.
The output is a table of liquidity-weighted price-per-bar candidates, designed for compression testing and harmonic analysis across swings and instruments.
________________________________________
How to Use
1. Select a Swing
- Place Anchor A and Anchor B to define the swing’s Low, High, and bar count.
2. Find the VPOC
- Apply TradingView’s Fixed Range Volume Profile tool over the same swing.
- Identify the Point of Control (POC) — the price level with the highest traded volume.
3. Enter the VPOC
- Manually input the POC into the indicator settings.
4. Review Outputs
- The table will display candidate ratios expressed mainly as price-per-bar values.
5. Apply in Practice
- Use the ratios as chart compression inputs or as benchmarks for testing harmonic alignments across swings.
________________________________________
Outputs
Swing & Inputs
• Bars (N): total bar count of the swing.
• Low (L): swing low price.
• High (H): swing high price.
• ΔP = H − L: price range.
• Mid = (L + H) ÷ 2: midpoint price.
• VPOC (V): user-entered highest-volume price.
• Base slope s0 = ΔP ÷ N: average change per bar.
• π-adjusted slope sπ = (π × ΔP) ÷ (2 × N): slope adjusted for half-cycle arc geometry.
________________________________________
VPOC Harmony Ratios (L, H, V, N)
• λ = (V − L) ÷ ΔP: normalized VPOC position within the range.
• R = (V − L) ÷ (H − V): symmetry ratio comparing lower vs. upper segment.
• s1 = (V − L) ÷ N: slope from Low → VPOC.
• s2 = (H − V) ÷ N: slope from VPOC → High.
________________________________________
Blended Means (s1, s2)
These combine the two segment slopes in different ways:
• HM(s1,s2) = 2 ÷ (1/s1 + 1/s2): Harmonic mean, emphasizes the smaller slope.
• GM(s1,s2) = sqrt(s1 × s2): Geometric mean, balances both slopes proportionally.
• RMS(s1,s2) = sqrt((s1² + s2²) ÷ 2): Root-mean-square, emphasizes the larger slope.
• L2 = sqrt(s1² + s2²): Euclidean norm, the vector length of both slopes combined.
________________________________________
Slope Blends
• Quadratic weighting: s_quad = s0 × ((V−L)² + (H−V)²) ÷ (ΔP²)
• Tilted slope: s_tilt = s0 × (0.5 + λ)
• Entropy-scaled slope: s_ent = s0 × H2(λ), with H2(λ) = −
________________________________________
Curvature & Liquidity Extensions
• π-arc × λ: s_arc = sπ × λ
• Liquidity-π: s_piV = sπ × (V ÷ Mid)
________________________________________
Scale-Normalized Families
With k = sqrt(H ÷ L):
• k (scale factor) = sqrt(H ÷ L)
• s_comp = s0 ÷ k: compressed slope candidate
• s_exp = s0 × k: expanded slope candidate
• Exponentiated blends:
- s_kλ = s0 × k^(2λ−1)
- s_φλ = s0 × φ^(2λ−1), with φ = golden ratio ≈ 1.618
- s_√2λ = s0 × (√2)^(2λ−1)
________________________________________
Practical Application
All formulas generate liquidity-weighted price-per-bar ratios that integrate range, time, and VPOC placement.
These values are designed for:
• Chart compression settings
• Testing harmonic alignments across swings
• Liquidity-aware scaling experiments
________________________________________

Dynamic Support and Resistance V2 | AnonycryptousThe Dynamic Support and Resistance V2 indicator, an easy tool to identify key support, resistance, trendline levels, pivot points and volume data.
Pivot Points.
Calculates support, resistance and trendline levels using pivot points, which are derived from the high, low, and close prices of previous trading periods.
Customize the pivot calculation by using Close' or 'High/Low' and adjusting the lookback periods for both the left and right sides of the pivot calculation.
Pivot points are crucial for forecasting potential market turning points, so it allows traders to adapt the indicator to different market conditions and timeframes.
By using pivot points, traders can spot reversal and consolidation levels or trendlines early on, allowing them to react to them in time.
Volume Levels.
This option focuses on identifying support and resistance levels based on volume data, specifically the Point of Control.
The POC is the highest traded volume price level during a time period.
This POC calculation, allow traders to areas of significant trading levels as support or resistance zones.
Volume-based levels gives insights into market sentiment and showes strong support and resistance based on trading volume.
Traders can choose between pivot-based and volume-based levels or use both simultaneously, depending on their analysis.
The indicator offers custom colors, so the trader can customize their visual analysis to their own style.
It calculates the importance of each level based on the number of touches and the duration it holds.
This indicator is intended for educational and informational purposes only and should not be considered financial advice.
Trading involves significant risk, and you should consult with a financial advisor before making any trading decisions.
The performance of this indicator is not guaranteed, and past results do not predict future performance.
Use at your own risk.

VPOCS ZScore by GumbotxAn indicator Showing Candle POC's.
Added a Zscore Filter to filter out the High volume candle's.
I like to use at Key Support and resistance Area's to see Absorbtion and Offside positions only on High volume Candles ( The high volume candle part is Key! ). Thoose candles Generally indicate forced participants opening or closing positions, or "Breakout traders entering" positions. When i see a Hi-Volume at S/R levels and price is rejecting ( trading away from the POC ) ill take that as a trigger for a trade.
- Dynamic Support and resistance.
- Show Offside and and Trapped traders
You can tweak the Zscore nominator for Less of more Frequent hits.
kaka-Buff横盘系统与CVD和LVP
作用:此指标用于识别市场横盘(震荡)区间,检测累积成交量差额(CVD)背离(基于分形和参考方法),并标记基于大成交量K线的关键价格水平(Large Volume Price, LVP)。它通过结合横盘信号、成交量背离和关键价格水平,帮助交易者识别潜在的趋势反转或延续。指标还绘制可自定义的指数移动平均线(EMA)以辅助趋势分析。主要功能:横盘检测:使用EMA标准差(STD)、平均真实波幅(ATR)、平均方向指数(ADX)和布林带宽度(BB宽度)识别低波动性的横盘区间。
分形CVD背离:通过分形枢轴点和成交量差额计算,检测看涨(“+RD”)和看跌(“-RD”)背离,以标签形式显示在图表上。
参考CVD背离:在成交量分布区域(VAH、VAL、POC)内识别简单的CVD背离(基于价格和成交量差额高/低点),以绿色/红色三角形显示。
大成交量价格(LVP):在回看周期(可自主设置长度)内标记最大成交量K线的最高/最低价,绘制线和标签,指示关键支撑/阻力位。
EMA线:绘制20、50、100和200周期的EMA,带开关控制和可自定义颜色,用于趋势可视化。
表格:以可自定义的表格(字体大小/颜色均可调节)显示横盘指标(EMA STD、ATR、ADX、BB宽度)和整体横盘状态。
警报:提供横盘进入/退出、分形CVD背离、参考CVD背离和LVP价格突破的警报。
Consolidation System with CVD and LVP
Purpose: This indicator identifies market consolidation zones, detects Cumulative Volume Delta (CVD) divergences (both fractal-based and reference-based), and marks significant price levels based on large volume bars (Large Volume Price, LVP). It helps traders identify potential trend reversals or continuations by combining consolidation signals, volume-based divergence, and key price levels. The indicator also plots customizable Exponential Moving Averages (EMAs) to aid in trend analysis.Key Features:Consolidation Detection: Uses EMA Standard Deviation (STD), Average True Range (ATR), Average Directional Index (ADX), and Bollinger Bands (BB) width to identify low-volatility consolidation zones.
Fractal CVD Divergence: Detects bullish ("+RD") and bearish ("-RD") divergences using fractal pivot points and a volume delta calculation, displayed as labels on the chart.
Reference CVD Divergence: Identifies simpler CVD divergences (based on price and volume delta highs/lows) within volume profile zones (VAH, VAL, POC), shown as green/red triangles.
Large Volume Price (LVP): Marks the high/low of the highest volume bar within a lookback period with lines and labels, indicating key support/resistance levels.
EMA Lines: Plots EMA 20, 50, 100, and 200 with toggle switches and customizable colors for trend visualization.
Table: Displays consolidation metrics (EMA STD, ATR, ADX, BB width) and overall consolidation status in a customizable table.
Alerts: Provides alerts for consolidation entry/exit, fractal CVD divergences, reference CVD divergences, and LVP price crossings.
