Oscilator CandlesBased on the response received on Bollinger %B candles, thought it would be nice to get the same on oscillators.
Use cases include applying atr based indicators or any indicators which utilizes - high, low, open close on oscillator values. Example : supertrend
Note: length values are reused by different oscillator types based on input requirements.
Wyszukaj w skryptach "oscillator"

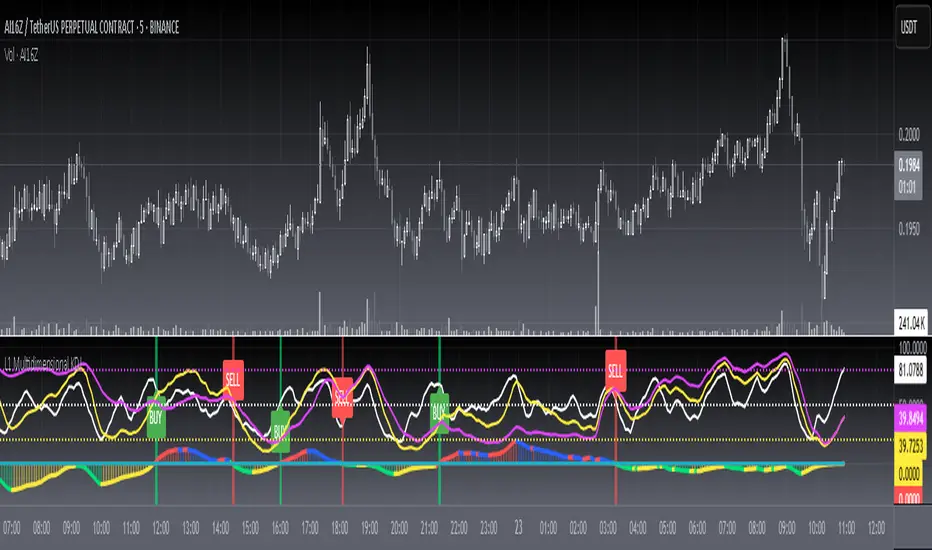
L1 Multidimensional KDJLevel: 1
Background
The KDJ oscillator display consists of 3 lines (K, D and J - hence the name of the display) and 2 levels. K and D are the same lines you see when using the stochastic oscillator. The J line in turn represents the deviation of the D value from the K value. The convergence of these lines indicates new trading opportunities. Just like the Stochastic Oscillator, oversold and overbought levels correspond to the times when the trend is likely to reverse.
Function
L1 Multidimensional KDJ utilizes multiple KDJ modeling across multiple time frames. In this instance, it covers three time frames as day, week and month. Although it is named like that, one can deduce and use it in small time frames e.g. 15mins (day), 60mins (week) and 4H (month) because KDJ oscillator is commonly used for small time frames across various markets.
Key Signal
kd --> day K value
kw --> week K value
km --> month K value
dd --> day D value
dw --> week D value
dm --> month D value
divergence --> divergence among day, week, month D values
resonance --> all three time frame D values are in the same direction
Pros and Cons
Pros:
1. Enable multidimensional KDJ,especially D value comparisons
2. divergence and resoanance among different time frame KDJ can be disclosed
Cons:
1. It may satruate for extreme conditions of long and short.
2. Not accurate for long and short entries by resonance effect.
Remarks
Bring about multiple time frames into consideration of KDJ is novel.
Readme
In real life, I am a prolific inventor. I have successfully applied for more than 60 international and regional patents in the past 12 years. But in the past two years or so, I have tried to transfer my creativity to the development of trading strategies. Tradingview is the ideal platform for me. I am selecting and contributing some of the hundreds of scripts to publish in Tradingview community. Welcome everyone to interact with me to discuss these interesting pine scripts.
The scripts posted are categorized into 5 levels according to my efforts or manhours put into these works.
Level 1 : interesting script snippets or distinctive improvement from classic indicators or strategy. Level 1 scripts can usually appear in more complex indicators as a function module or element.
Level 2 : composite indicator/strategy. By selecting or combining several independent or dependent functions or sub indicators in proper way, the composite script exhibits a resonance phenomenon which can filter out noise or fake trading signal to enhance trading confidence level.
Level 3 : comprehensive indicator/strategy. They are simple trading systems based on my strategies. They are commonly containing several or all of entry signal, close signal, stop loss, take profit, re-entry, risk management, and position sizing techniques. Even some interesting fundamental and mass psychological aspects are incorporated.
Level 4 : script snippets or functions that do not disclose source code. Interesting element that can reveal market laws and work as raw material for indicators and strategies. If you find Level 1~2 scripts are helpful, Level 4 is a private version that took me far more efforts to develop.
Level 5 : indicator/strategy that do not disclose source code. private version of Level 3 script with my accumulated script processing skills or a large number of custom functions. I had a private function library built in past two years. Level 5 scripts use many of them to achieve private trading strategy.
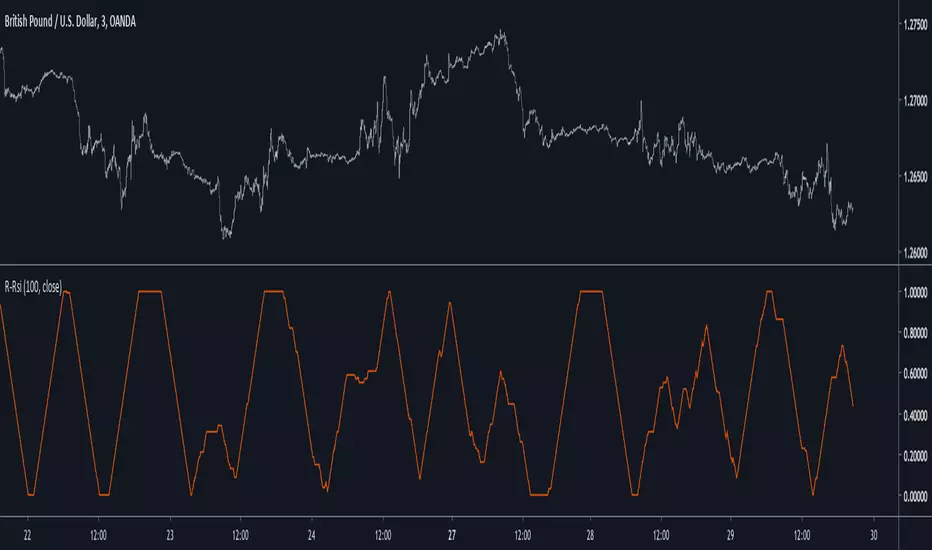
Recursive RsiIntroduction
I have already posted a classic indicator using recursion, it was the stochastic oscillator and recursion helped to get a more predictive and smooth result. Here i will do the same thing with the rsi oscillator but with a different approach. As reminder when using recursion you just use a fraction of the output of a function as input of the same function, i say a fraction because if you feedback the entire output you will just have a periodic function, this is why you average the output with the input.
The Indicator
The indicator will use 50% of the output and 50% of the input, remember that when using feedback always rescale your input, else the effect might be different depending on the market you are in. You can interpret the indicator like a normal rsi except if you plan to use the 80/20 level, depending on length the scale might change, if you need a fixed scale you can always rescale b by using an rsi or stochastic oscillator.
Conclusion
I have presented an rsi oscillator using a different type of recursion structure than the recursive stochastic i posted in the past, the result might be more predictive than the original rsi. Hope you like it and thanks for reading !
Need HELP coding this SCRIPT. Thanks Can anyone help me colour code the oscillator and also an overlay on the chart mirroring the oscillator.
If the Oscillator closes above -90 / below - 10 Turns white & Also the Candlestick
If the Oscillator then closes between the -30/-70 within only the next bar to turn BLUE within the Oscillator/ Candlestick!
Thanks it's pretty basic but new to coding!!
oscillator fast cryptosmart (Bands on Scale)The oscillator fast cryptosmart is a high-sensitivity momentum indicator designed to generate signals more rapidly than many traditional oscillators, such as the MACD. It is engineered to detect potential price breakouts by analyzing short-term market cycles.
At its core, the indicator uses a Detrended Price Oscillator (DPO) to remove the longer-term trend from price action, allowing it to focus purely on the underlying momentum cycles. It then calculates dynamic volatility bands around this oscillator line.
Signals are generated when momentum breaks out from a normal range, providing traders with an early warning of a potential acceleration in price.
How to Interpret the Signals:
Buy Signal (Green Vertical Line): A buy signal is generated when the oscillator's main line (yellow) crosses above its upper statistical band. This indicates a sharp surge in positive momentum, suggesting a potential upward move is beginning.
Sell Signal (Red Vertical Line): A sell signal is generated when the oscillator's main line crosses below its lower statistical band. This indicates a significant increase in negative momentum, suggesting a potential downward move is starting.
By focusing on momentum breakouts rather than lagging moving average crossovers, the oscillator fast cryptosmart aims to provide an edge in identifying opportunities in fast-moving markets.

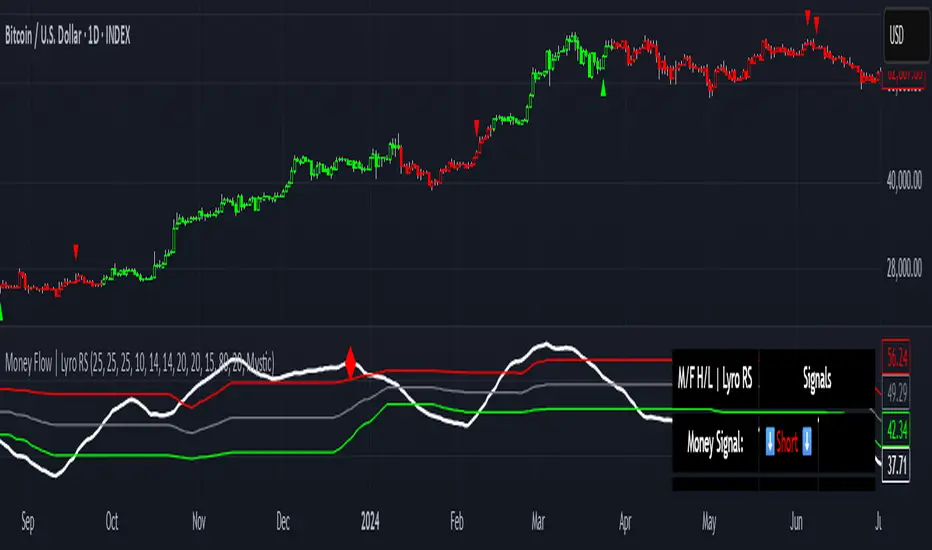
Money Flow | Lyro RSMoney Flow | Lyro RS
The Money Flow is a momentum and volume-driven oscillator designed to highlight market strength, exhaustion, and potential reversal points. By combining smoothed Money Flow Index readings with volatility, momentum, and RVI-based logic, it offers traders a deeper perspective on money inflow/outflow, divergences, and overbought/oversold dynamics.
Key Features
Smoothed Money Flow Line
EMA-smoothed calculation of the MFI for noise reduction.
Clear thresholds for overbought and oversold zones.
Normalized Histogram
Histogram plots show bullish/bearish money flow pressure.
Color-coded cross logic for quick trend assessment.
Relative Volatility Index (RVI) Signals
Detects overbought and oversold conditions using volatility-adjusted RVI.
Plots ▲ and ▼ markers at exhaustion points.
Momentum Strength Gauge
Calculates normalized momentum strength from ROC and volume activity.
Displays percentage scale of current momentum force.
Divergence Detection
Bullish divergence: Price makes lower lows while money flow makes higher lows.
Bearish divergence: Price makes higher highs while money flow makes lower highs.
Plotted as diamond markers on the oscillator.
Signal Dashboard (Table Overlay)
Displays real-time status of Money Flow signals, volatility, and momentum.
Color-coded readouts for instant clarity (Long/Short/Neutral + Momentum Bias).
How It Works
Money Flow Calculation – Applies EMA smoothing to MFI values.
Normalization – Scales oscillator between relative high/low values.
Trend & Signals – Generates bullish/bearish signals based on midline and histogram cross logic.
RVI Integration – Confirms momentum exhaustion with overbought/oversold markers.
Divergences – Identifies hidden market imbalances between price and money flow.
Practical Use
Trend Confirmation – Use midline crossovers with histogram direction for money flow bias.
Overbought/Oversold Reversals – Watch RVI ▲/▼ markers for exhaustion setups.
Momentum Tracking – Monitor momentum percentage to gauge strength of current trend.
Divergence Alerts – Spot early reversal opportunities when money flow diverges from price action.
Customization
Adjust length, smoothing, and thresholds for different markets.
Enable/disable divergence detection as needed.
Personalize visuals and dashboard display for cleaner charts.
⚠️ Disclaimer
This indicator is a tool for technical analysis and does not provide guaranteed results. It should be used alongside other methods and proper risk management. The creator is not responsible for financial decisions made using this script.
Confluence StackPlease read the instructions below. The code was mostly written using AI so may contain errors. Happy trading all and good luck. ATB Richard
INTENDED USE
This indicator is designed for technical traders who want to move beyond simple buy/sell signals and gain a deeper understanding of the underlying market dynamics. It is ideal for trend followers, swing traders, and anyone looking to confirm the quality of a trend.
WHO IS THIS FOR?
Traders who want to differentiate between strong, sustainable trends and weak, unreliable moves.
Analysts looking to identify high-conviction setups backed by multiple factors (e.g., momentum confirmed by volume).
Discretionary traders who need a quick, visual tool to gauge market sentiment and avoid choppy conditions.
WHY USE IT?
Traditional indicators often give conflicting signals. The Confluence Stack solves this by aggregating multiple perspectives into one clear visual. It helps you answer not just "Is the market going up?" but "WHY is it going up, and how strong is the conviction?". This allows for more informed decision-making and helps filter out low-probability trades.
DISCLAIMER AND LICENSE
This script is for educational purposes only and is not a recommendation to buy or sell any financial instrument. All trading and investment decisions are the sole responsibility of the user. Trading involves significant risk.
This source code is subject to the terms of the Mozilla Public License 2.0 at www.mozilla.org
HOW TO USE THIS INDICATOR
This indicator is designed to show the 'character' of a market move by grouping signals into distinct categories. Instead of seeing many individual signals, you see the strength of the underlying forces driving the price.
1. READ THE HEIGHT (Strength of Confluence)
The total height of the stack shows the strength of agreement. A tall stack means many signals are aligned, indicating a high-conviction move. A short stack means weak agreement and a choppy, indecisive market.
2. READ THE COLOR (Character of the Move)
The colors tell you WHY the market is moving.
BLUE (Momentum): A stack of mostly blue shades indicates a trend driven by pure momentum. This is the 'speed' of the market.
RSI (Relative Strength Index): Measures the magnitude of recent price gains versus losses. A smooth measure of trend strength.
Stochastic Oscillator: Measures the current closing price's position within the recent high-low range. More sensitive to immediate price action.
CCI (Commodity Channel Index): Measures the price's deviation from its moving average. Excels at identifying cyclical turns.
MACD (Moving Average Convergence Divergence): A trend-following momentum indicator showing the relationship between two moving averages. Excellent for identifying the start and end of trends.
YELLOW (Volume): The appearance of yellow shades confirms the move is supported by high market participation. This is the 'fuel' for the trend.
Volume Ratio: A custom signal that triggers when buy or sell volume is unusually high compared to its recent average.
CRV (Candle Range Volume): A custom signal that looks for candles with significant price range and volume.
OBV (On-Balance Volume): A cumulative indicator that adds volume on up days and subtracts it on down days. It shows the long-term flow of money.
FUCHSIA (Volatility): A fuchsia block signals a volatility breakout. This adds a sense of urgency and confirms the price is moving with exceptional force.
Bollinger Bands: A signal triggers when the price closes outside of the upper or lower standard deviation bands.
ORANGE (Price Action): An orange block is a pure price structure signal. It's a raw statement of intent from the market.
Price Gap: A signal that triggers when there's a gap up or gap down between candles.
3. READ THE TRANSITION (Shift in Sentiment)
The most important signal from the stacks is the flip from one side of the zero line to the other.
Flipping from Negative to Positive: A bearish stack disappears and is replaced by a bullish stack. This indicates market sentiment is shifting from bearish to bullish.
Flipping from Positive to Negative: A bullish stack disappears and is replaced by a bearish stack. This warns of a potential top or the start of a new downtrend.
4. FILTER FOR NOISE (Plot Threshold)
In choppy markets, the stack can flicker with low signal counts (e.g., +1 or -1). To focus only on high-conviction moves, go to the indicator settings and increase the "Plot Threshold". A setting of 2 or 3 will hide all stacks that don't have at least 2 or 3 agreeing signals, effectively filtering out market noise and keeping your chart clean.
5. CUSTOMIZE YOUR SIGNALS (Enable/Disable)
This indicator is fully customizable. In the settings, you can enable or disable each of the 9 indicators individually. For example, if you are a pure momentum trader, you could disable all Volume, Volatility, and Price Action signals to focus only on the blue stacks. Tailor it to fit your specific trading style.
EXAMPLE INTERPRETATIONS
Strong, Confirmed Trend: A tall stack of mostly blue (Momentum) and yellow (Volume) indicates a high-quality trend backed by both speed and market participation.
Momentum-Only Trend: A tall stack of only blue is a strong momentum move, but the lack of yellow (Volume) is a warning that the move may lack the "fuel" to be sustained.
Choppy/Indecisive Market: A short, mixed-color stack flickering around the zero line means the market is choppy with no clear conviction. It's often best to stay out.
Volatility Breakout: A new stack that appears suddenly with a fuchsia (Bollinger Bands) block on its first bar suggests a volatility-driven breakout is initiating.
Exhaustion Move: An orange (Price Gap) block appearing at the peak of a tall, long-standing stack can signal an exhaustion gap, potentially marking the end of the trend.
Weakening Conviction (Divergence): If price makes a new high but the positive stack is visibly shorter than the stack at the previous price high, it suggests underlying conviction is weakening.

TZanalyserTZanalyser (Trend Zone Monitor With Trend Strength, Volume Focus And -Events Markers)
Before I used TrendZones to manage my portfolio I used Fibonacci Zone Oscillator as my favorite in the sub panel, accompanied with another subpanel indicator which I never published called IncliValue and also REVE Cohorts.
TZanalyser inherits Ideas and code from all three of them: The visual and the idea of using a channel as the basis for an oscillator depicted as a histogram, is taken from the FibZone Oscillator. The idea of providing a number to evaluate the trend is taken from IncliValue. The idea to create a horizontal line which indicates high and low volume focus completed with markers for volume events, is taken from REVE-cohorts.
These ideas are combined in one sleek visual called TZanalyser. TZ stand for TrendZones, because the histogram is based on it.
The histogram.
Depicted is the distance of the price from COG as percent. The distance between Upper Curve and Lower Curve is used as 100%. The values may reach between 300 and -300. The colors indicate in which zone the candle lives, blue in the blue zone, green in the green zone etc. Despite the absence of a gray zone, there are gray bars. These depict candles that wrap around COG. Because hl2 is used as price, some gray bars point up and others down. The orange and red bars point down because the orange and red downtrend zones are below COG.
Use of the histogram.
Sometimes I need to create a list of stocks which are in uptrend in monthly, weekly and daily charts from the stocks I follow in my universe. This job is done fast and easy by looking at the last bar of the histogram. The histogram also gives a quick evaluation of how the stock fared in the past.
The number.
Suppose I need to allocate some money to another stock, selected a few, looked into news and gurus and they look equally good. Then it is nice to be able to find out which has the best charts. Which one has the strongest uptrend. For this purpose this number can be consulted, because it indicates somehow the strength of the trend. It is an integer between 20 and -20, the closer to 20 the stronger the uptrend, closer to -20 indicates a stronger downtrend. The color of the background is the same as the last column of the histogram.
Volume focus and events
The horizontal lines depict volume focus, the line below the focus that comes with the uptrend columns pointing up, the one above the focus for the downtrend columns pointing down. Thes line have tree colors: maroon for high volume focus, green for normal volume and gray for low volume situations. Between the lines and the histogram triangles appear at volume events, a green triangle when the candle comes with high volume, i.e. 120-200 percent of normal, maroon when extreme volume, i.e. more than 200 percent of normal.
The direction of these triangles is that of the histogram, i.e. when the price is higher, direction is up and vice versa.
Take care and have fun.

Volumetric Expansion/Contraction### Indicator Title: Volumetric Expansion/Contraction
### Summary
The Volumetric Expansion/Contraction (PCC) indicator is a comprehensive momentum oscillator designed to identify high-conviction price moves. Unlike traditional oscillators that only look at price, the PCC integrates four critical dimensions of market activity: **Price Change**, **Relative Volume (RVOL)**, **Cumulative Volume Delta (CVD)**, and **Average True Range (ATR)**.
Its primary purpose is to help traders distinguish between meaningful, volume-backed market expansions and noisy, unsustainable price action. It gives more weight to moves that occur in a controlled, low-volatility environment, highlighting potential starts of new trends or significant shifts in market sentiment.
### Key Concepts & Purpose
The indicator's unique formula synthesizes the following concepts:
1. **Price Change:** Measures the magnitude and direction of the primary move.
2. **Relative Volume (RVOL):** Confirms that the move is backed by significant volume compared to its recent average, indicating institutional participation.
3. **Cumulative Volume Delta (CVD):** Measures the underlying buying and selling pressure, confirming that the price move is aligned with the net flow of market orders.
4. **Inverse Volatility (ATR):** This is the indicator's unique twist. It normalizes the signal by the inverse of the Average True Range. This means the indicator's value is **amplified** when volatility (ATR) is low (signifying a controlled, confident expansion) and **dampened** when volatility is high (filtering out chaotic, less predictable moves).
The goal is to provide a single, easy-to-read oscillator that signals when price, volume, and order flow are all in alignment, especially during a breakout from a period of contraction.
### Features
* **Main Oscillator Line:** A single line plotted in a separate pane that represents the calculated strength of the volumetric expansion or contraction.
* **Zero Line:** A dotted reference line to easily distinguish between bullish (above zero) and bearish (below zero) regimes.
* **Visual Threshold Zones:** The background automatically changes color to highlight periods of significant strength:
* **Bright Green:** Indicates a "Strong Up Move" when the oscillator crosses above the user-defined upper threshold.
* **Bright Fuchsia:** Indicates a "Strong Down Move" when the oscillator crosses below the user-defined lower threshold.
### Configurable Settings & Filters
The indicator is fully customizable to allow for extensive testing and adaptation to different assets and timeframes.
#### Main Calculation Inputs
* **Price Change Lookback:** Sets the period for calculating the primary price change.
* **CVD Normalization Length:** The lookback period for normalizing the Cumulative Volume Delta.
* **RVOL Avg Volume Length:** The lookback for the simple moving average of volume, used to calculate RVOL.
* **RVOL Normalization Length:** The lookback period for normalizing the RVOL score.
* **ATR Length & Normalization Length:** Sets the periods for calculating the ATR and its longer-term average for normalization.
#### Weights
* Fine-tune the impact of each core component on the final calculation, allowing you to emphasize what matters most to your strategy (e.g., give more weight to CVD or RVOL).
#### External Market Filter (Powerful Feature)
* **Enable SPY/QQQ Filter for Up Moves?:** A checkbox to activate a powerful regime filter.
* **Symbol:** A dropdown to choose whether to filter signals based on the trend of **SPY** or **QQQ**.
* **SMA Period:** Sets the lookback period for the Simple Moving Average (default is 50).
* **How it works:** When enabled, this filter will **only allow "Strong Up Move" signals to appear if the chosen symbol (SPY or QQQ) is currently trading above its specified SMA**. This is an excellent tool for aligning your signals with the broader market trend and avoiding bullish entries in a bearish market.
#### Visuals
* **Upper/Lower Threshold:** Allows you to define what level the oscillator must cross to trigger the colored background zones, letting you customize the indicator's sensitivity.
***
**Disclaimer:** This tool is designed for market analysis and confluence. It is not a standalone trading system. Always use this indicator in conjunction with your own trading strategy, risk management, and other forms of analysis.

Flux Capacitor (FC)# Flux Capacitor
**A volume-weighted, outlier-resistant momentum oscillator designed to expose hidden directional pressure from institutional participants.**
---
### Why "Flux Capacitor"?
The name pays homage to the fictional energy core in *Back to the Future* — an invisible engine that powers movement. Similarly, this indicator detects whether price movement is being powered by real market participation (volume) or if it's coasting without conviction.
---
### Methodology
The Flux Capacitor fuses three statistical layers:
- **Normalized Momentum**: `(Close – Open) / ATR`
Controls for raw price size and volatility.
- **Volume Scaling**:
Amplifies the effect of price moves that occur with elevated volume.
- **Robust Normalization**:
- *Winsorization* caps outlier spikes.
- *MAD-Z scoring* normalizes the signal across assets (crypto, futures, stocks).
- This produces consistent scaling across timeframes and symbols.
The result is a smooth oscillator that reliably indicates **liquidity-backed momentum** — not just price movement.
---
### Signal Events
- **Divergence (D)**: Price makes higher highs or lower lows, but Flux does not.
- **Absorption (A)**: Candle shows high volume and small body, while Flux opposes the candle direction — indicates smart money stepping in.
- **Compression (◆)**: High volume with low momentum — potential breakout zone.
- **Zero-Cross**: Indicates directional regime flip.
- **Flux Acceleration**: Histogram shows pressure rate of change.
- **Regime Background**: Color fades with weakening trend conviction.
All signals are color-coded and visually compact for easy pattern recognition.
---
### Interpreting Divergence & Absorption Correctly
Signal strength improves significantly when it appears **in the correct zone**:
#### Divergence:
| Signal | Zone | Meaning | Strength |
|--------|------------|------------------------------------------|--------------|
| Green D | Below 0 | Bullish reversal forming in weakness | **Strong** |
| Green D | Above 0 | Bullish, but less convincing | Moderate |
| Red D | Above 0 | Bearish reversal forming in strength | **Strong** |
| Red D | Below 0 | Bearish continuation — low warning value | Weak |
#### Absorption:
| Signal | Zone | Meaning | Strength |
|--------|------------|-----------------------------------------|--------------|
| Green A | Below 0 | Buyers absorbing panic-selling | **Strong** |
| Green A | Above 0 | Support continuation | Moderate |
| Red A | Above 0 | Sellers absorbing FOMO buying | **Strong** |
| Red A | Below 0 | Trend continuation — not actionable | Weak |
Look for **absorption or divergence signals in “enemy territory”** for the most actionable entries.
---
### Reducing Visual Footprint
If your chart shows a long line of numbers across the top of the Flux Capacitor pane (e.g. "FC 14 20 9 ... Bottom Right"), it’s due to TradingView’s *status line input display*.
**To fix this**:
Right-click the indicator pane → **Settings** → **Status Line** tab → uncheck “Show Indicator Arguments”.
This frees up vertical space so top-edge signals (like red `D` or yellow `◆`) remain visible and unobstructed.
---
### Features
- Original MAD-Z based momentum design
- True volume-based divergence and absorption logic
- Built-in alerts for all signal types
- Works across timeframes (1-min to weekly)
- Minimalist, responsive layout
- 25+ customizable parameters
- No future leaks, no repainting
---
### Usage Scenarios
- **Trend confirmation**: Flux > 0 confirms bullish trend strength
- **Reversal detection**: Divergence or absorption in opposite territory = high-probability reversal
- **Breakout anticipation**: Compression signal inside range often precedes directional move
- **Momentum shifts**: Watch for zero-crosses + flux acceleration spikes
---
### ⚠ Visual Note for BTC, ETH, Crude Oil & Futures
These high-priced or rapidly accelerating instruments can visually compress any linear oscillator. You may notice the Flux Capacitor’s line appears "flat" or muted on these assets — especially over long lookbacks.
> **This does not affect signal validity.** Divergence, absorption, and compression triggers still fire based on underlying logic — only the line’s amplitude appears reduced due to scaling constraints.
---
### Disclaimer
This indicator is for educational purposes only. It is not trading advice. Past results do not guarantee future performance. Use in combination with your own risk management and analysis.

Stochastic RainbowThe Stochastic Rainbow indicator is a multi-layered momentum oscillator designed to provide a comprehensive view of market dynamics by combining multiple stochastic oscillators of varying periods. This approach allows traders to analyze both short-term and long-term momentum within a single visual framework, enhancing decision-making for entries and exits.
🔧 Indicator Settings and Customization
Select from various moving average methods (e.g., SMA, EMA, DEMA, TEMA, WMA, VWMA, RMA, T3) to smooth the stochastic lines. Different methods can affect the responsiveness of the indicator.
The indicator computes five sets of stochastic oscillators with Fibonacci values.
Each %K line is smoothed using the selected moving average type, and a corresponding %D line is plotted for each %K.
🎨 Visual Interpretation
The Stochastic Rainbow indicator plots multiple %K and %D lines, each with distinct colors for easy differentiation.
Additionally, horizontal dotted lines are drawn at levels 80 (Upper Band), 50 (Midline), and 20 (Lower Band) to indicate overbought, neutral, and oversold conditions, respectively.
📈 Trading Strategies Using Stochastic Rainbow
The multi-layered structure of the Stochastic Rainbow allows for nuanced analysis.
Trend Confirmation:
When all %K lines are above 50 and aligned in ascending order (short-term above long-term), it suggests a strong uptrend.
Conversely, when all %K lines are below 50 and aligned in descending order, it indicates a strong downtrend.
Overbought/Oversold Conditions:
If the shorter-term %K lines (e.g., %K 5,3 and %K 8,3) enter the overbought zone (>80) while longer-term lines remain below, it may signal a potential reversal.
Similarly, if shorter-term lines enter the oversold zone (<20) while longer-term lines remain above, it could indicate an upcoming bullish reversal.
Crossovers:
A bullish signal occurs when a %K line crosses above its corresponding %D line.
A bearish signal occurs when a %K line crosses below its corresponding %D line.
Divergence Analysis:
If price makes a new high while the %K lines do not, it may indicate bearish divergence and a potential reversal.
If price makes a new low while the %K lines do not, it may indicate bullish divergence and a potential reversal.
⚙️ Adjusting Settings for Optimal Use
The Stochastic Rainbow's flexibility allows traders to adjust settings to match their trading style and the specific asset's behavior:
Short-Term Trading: Use shorter periods (e.g., 5 for %K) and more responsive moving averages (e.g., WMA, VWMA, EMA, DEMA, TEMA, HMA) to capture quick market movements.
Long-Term Trading: Opt for longer periods (e.g., 55 for %K) and smoother moving averages (e.g., SMA, RMA, T3) to filter out noise and focus on broader trends.
Volatile Markets: Consider using the T3 moving average for its smoothing capabilities, helping to reduce false signals in choppy markets.
By experimenting with different settings, traders can fine-tune the indicator to better suit their analysis and improve decision-making.

Disparity Index with Volatility ZonesDisparity Index with Volatility Zones
is a momentum oscillator that measures the percentage difference between the current price and its simple moving average (SMA). This allows traders to identify overbought/oversold conditions, assess momentum strength, and detect potential trend reversals or continuations.
🔍 Core Concept:
The Disparity Index (DI) is calculated as:
DI = 100 × (Price − SMA) / SMA
A positive DI indicates the price is trading above its moving average (potential bullish sentiment), while a negative DI suggests the price is below the average (potential bearish sentiment).
This version of the Disparity Index introduces a dual-zone volatility framework, offering deeper insight into the market's current state.
🧠 What Makes This Version Unique?
1. High Volatility Zones
When DI crosses above +1.0% or below –1.0%, it often indicates the start or continuation of a strong trend.
Sustained readings beyond these thresholds typically align with trending phases, offering opportunities for momentum-based entries.
A reversal back within ±1.0% after exceeding these levels can suggest a shift in momentum — similar to how RSI exits the overbought/oversold zones before reversals.
These thresholds act as dynamic markers for breakout confirmation and potential trend exhaustion.
2. Low Volatility Zones
DI values between –0.5% and +0.5% define the low-volatility zone, shaded for visual clarity.
This area typically indicates market indecision, sideways price action, or consolidation.
Trading within this range may favor range-bound or mean-reversion strategies, as trend momentum is likely limited.
The logic is similar to interpreting a flat ADX, tight Bollinger Bands, or contracting Keltner Channels — all suggesting consolidation.
⚙️ Features:
Customizable moving average length and input source
Adjustable thresholds for overbought/oversold and low-volatility zones
Optional visual fill between low-volatility bounds
Clean and minimal chart footprint (non-essential plots hidden by default)
📈 How to Use:
1. Trend Confirmation:
A break above +1.0% can be used as a bullish continuation signal.
A break below –1.0% may confirm bearish strength.
Long periods above/below these thresholds support trend-following entries.
2. Reversal Detection:
If DI returns below +1.0% after exceeding it, bullish momentum may be fading.
If DI rises above –1.0% after falling below, bearish pressure may be weakening.
These shifts resemble overbought/oversold transitions in oscillators like RSI or Stochastic, and can be paired with divergence, volume, or price structure analysis for higher reliability.
3. Sideways Market Detection:
DI values within ±0.5% indicate low volatility or a non-trending environment.
Traders may avoid breakout entries during these periods or apply range-trading tactics instead.
Observing transitions out of the low-volatility zone can help anticipate breakouts.
4. Combine with Other Indicators:
DI signals can be enhanced using tools like MACD, Volume Oscillators, or Moving Averages.
For example, a DI breakout beyond ±1.0% supported by a MACD crossover or volume spike can help validate trend initiation.
This indicator is especially powerful when paired with Bollinger Bands:
A simultaneous price breakout from the Bollinger Band and DI moving beyond ±1.0% can help identify early trend inflection points.
This combination supports entering positions early in a developing trend, improving the efficiency of trend-following strategies and enhancing decision-making precision.
It also helps filter false breakouts when DI fails to confirm the move outside the band.
This indicator is designed for educational and analytical purposes and works across all timeframes and asset classes.
It is particularly useful for traders seeking a clear framework to identify momentum strength, filter sideways markets, and improve entry timing within a larger trading system.

Monest Value Indicator (MVI)
Description
The Monest Value Indicator (MVI) is a modern oscillator designed to address common issues in traditional oscillators like RSI or MACD. Unlike classical oscillators, the MVI dynamically adjusts to relative price movements and market volatility, providing a transparent and reliable valuation for short-term trading decisions.
This indicator normalizes price data around a consensus line and accounts for market volatility using the Average True Range (ATR). It highlights overbought and oversold conditions, offering a unique perspective for traders.
Key Features
Dynamic Overbought/Oversold Levels : Highlights significant price extremes for better entry and exit signals. Volatility Normalization : Adapts to market conditions, ensuring consistent readings across various assets. Consensus-Based Valuation : Uses a moving average of the midrange price for baseline calculations. No Lag or Stickiness : Reacts promptly to price movements without getting stuck in extreme zones.
How It Works
Consensus Line :
Calculated as a 5-day moving average of the midrange:
Consensus = SMA((High + Low) / 2, 5) .
Offset OHLC Data :
All prices are adjusted relative to the consensus line:
Offset Price = Price - Consensus .
Volatility Normalization :
Adjusted prices are normalized using a 5-day ATR divided by 5:
Normalized Price = Offset Price / (ATR / 5) .
MVI Calculation :
The normalized closing price is plotted as the MVI.
Overbought/Oversold Levels :
Default levels are set at +8 (overbought) and -8 (oversold).
How to Use
Identifying Overbought/Oversold Conditions :
When the MVI crosses above +8 , the asset is overbought, signaling a potential reversal or pullback.
When the MVI drops below -8 , the asset is oversold, indicating a potential bounce or upward move.
Trend Confirmation :
Use the MVI to confirm trends by observing sustained movements above or below zero.
Combine with other trend indicators (e.g., Moving Averages) for robust analysis.
Alerts :
Set alerts for when the MVI crosses overbought or oversold levels to stay informed about potential trading opportunities.
Inputs
ATR Length : Default is 5. Adjust to modify the sensitivity of volatility normalization. Consensus Length : Default is 5. Change to tweak the baseline calculation.
Example
Overbought Signal : MVI exceeds +8 , indicating the asset may reverse from an overvalued position. Oversold Signal : MVI drops below -8 , suggesting the asset may recover from an undervalued state. Flat Market : MVI hovers near zero, indicating price consolidation.

[blackcat] L2 Improved Jeffrey Owen Cyclical SystemLevel: 2
Background
In Jeffrey Owen Katz's article "Trading stocks with a cyclical system" he introduces the Stock Rhythm System. I found the central part is quite similar to KDJ indicator and I use my own KDJ algo to enhance its performance.
Function
Jeffrey Owen Katz has a customized stochastic indicator. I used it as the engine of my own KDJ trading system. My KDJ oscillator display consists of 3 lines (K, D and J - hence the name of the display) and 2 levels. K and D are the same lines you see when using the stochastic oscillator. The J line in turn represents the deviation of the D value from the K value. The convergence of these lines indicates new trading opportunities. Just like the Stochastic Oscillator, oversold and overbought levels correspond to the times when the trend is likely to reverse. Just as the Stochastic, the KDJ has the K & D lines, plus the J. This last one represents the divergence from the K-line. When all three converge, it usually signals a possible trend forming. Labels and alerts are added for long and short entries.
Key Signal
KVal --> K.
DVal --> D.
JVal --> J.
Remarks
This is a Level 2 free and open source indicator.
Feedbacks are appreciated.

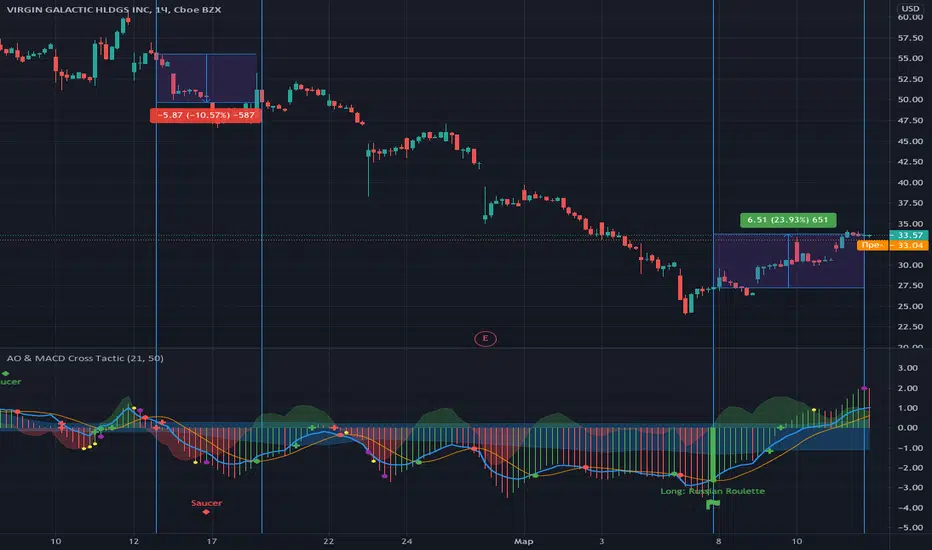
Awesome Oscillator & MACD Cross TacticOscillator for Tradingview based on MACD and Awesome Oscillator. This oscillator is designed to identify potential local growth or decline in prices as part of a trend movement.
For some ridiculous reason I am not allowed to attach screenshots of graphs and links on TradingView, so I hope that you will find my detailed instructions on my github page: github.com/samgozman/AO-MACD-cross-tradingview
RSI With Noise Elimination Technology (John Ehlers)Indicator translation to Pinescript requested by cookie_crusher on Twitter. The "RSI With Noise Elimination Technology" (NET) is an indicator developed by John Elhers.
The indicator is simply a rolling Kendall rank correlation coefficient of a normalized momentum oscillator (a version of the RSI introduced by Elhers in the May 2018 issue of Stocks & Commodities). It can be interesting to note that the absolute value of this oscillator is equal to the efficiency ratio used in the Kaufman adaptive moving average (KAMA).
Even if both the normalized momentum oscillator and rolling Rank correlation are scale-invariant oscillators, they do not have the same behaviors when increasing their settings, that is the normalized momentum oscillator scale range will become lower while the Kendall correlation will stay close to 1/-1, here is a closed-form approximation of the mean of the absolute value of the normalized momentum oscillator absolute value (efficiency ratio):
E (er) ≈ 1/√p
Where E (er) is the mean of the efficiency ratio er while p is the period of the efficiency ratio, as such the scale of the normalized momentum oscillator will shrink with a higher period, maybe that both are not intended to be plotted at the same time but that's what the original code does.
It's still a coll indicator. The link to J. Elhers article is in the code.

Hybrid Overbought/Oversold Detector + Put/Call SignalsThere are many indicators of overbought/oversold conditions out there. Some of more common ones are:
- Bollinger Bands %B
- Money Flow Index (MFI)
- Relative Strength Index (RSI)
- Stochastic
This script uses a combination of these 4 oscillators to confirm overbought/oversold and filter the signals of market reverse which could be used for trading binary options.
You may select which oscillators you want to apply and of course change the source, the length of the calculations and the overbought/oversold levels.
Also the script will draw a combined graph which is the average of the selected oscillators in the options.
Send me your ideas!

Combo Strategy 123 Reversal & ECO This is combo strategies for get a cumulative signal.
First strategy
This System was created from the Book "How I Tripled My Money In The
Futures Market" by Ulf Jensen, Page 183. This is reverse type of strategies.
The strategy buys at market, if close price is higher than the previous close
during 2 days and the meaning of 9-days Stochastic Slow Oscillator is lower than 50.
The strategy sells at market, if close price is lower than the previous close price
during 2 days and the meaning of 9-days Stochastic Fast Oscillator is higher than 50.
Second strategy
We call this one the ECO for short, but it will be listed on the indicator list
at W. Blau’s Ergodic Candlestick Oscillator. The ECO is a momentum indicator.
It is based on candlestick bars, and takes into account the size and direction
of the candlestick "body". We have found it to be a very good momentum indicator,
and especially smooth, because it is unaffected by gaps in price, unlike many other
momentum indicators.
We like to use this indicator as an additional trend confirmation tool, or as an
alternate trend definition tool, in place of a weekly indicator. The simplest way
of using the indicator is simply to define the trend based on which side of the "0"
line the indicator is located on. If the indicator is above "0", then the trend is up.
If the indicator is below "0" then the trend is down. You can add an additional
qualifier by noting the "slope" of the indicator, and the crossing points of the slow
and fast lines. Some like to use the slope alone to define trend direction. If the
lines are sloping upward, the trend is up. Alternately, if the lines are sloping
downward, the trend is down. In this view, the point where the lines "cross" is the
point where the trend changes.
When the ECO is below the "0" line, the trend is down, and we are qualified only to
sell on new short signals from the Hi-Lo Activator. In other words, when the ECO is
above 0, we are not allowed to take short signals, and when the ECO is below 0, we
are not allowed to take long signals.
WARNING:
- For purpose educate only
- This script to change bars colors.

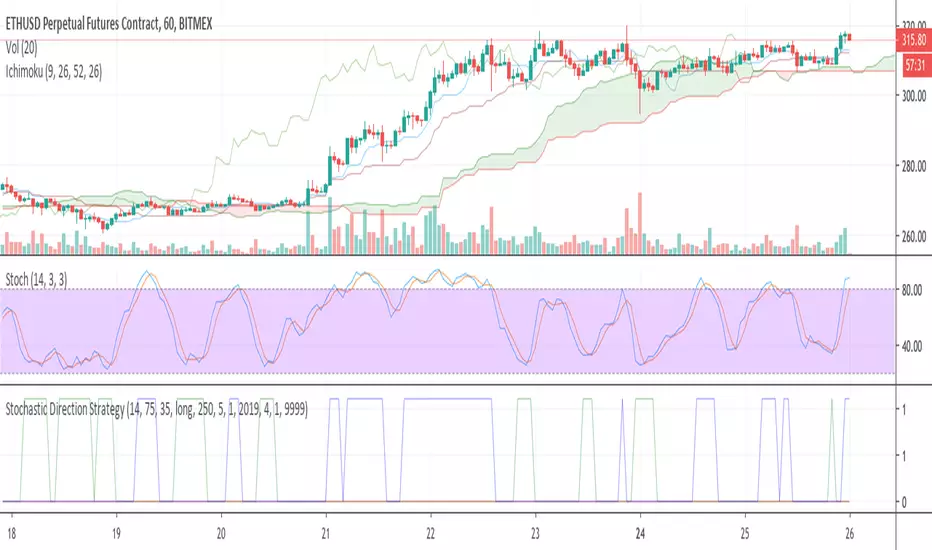
Stochastic Direction StrategyThis is a simple strategy based on the Stochastic Oscillator: stockcharts com/school/doku.php?id=chart_school:technical_indicators:stochastic_oscillator_fast_slow_and_full
Its purpose is to gradually build a position in a trending market (as of June 26th 2016 in most cryptocurrencies).
Inputs:
- direction (long/short)
- overbought/oversold
- close positions (yes/no to only increase positions)
Outputs:
- buy/sell/close signals plotted on a chart below
This script can easily be used as a TradingView study (for alerts) and a strategy (for backtesting). See the comments in the code.
I have added additional alert conditions to be used easily together with a trading bot reading the signals
Yet obviously you can also do manual trading on each alert.
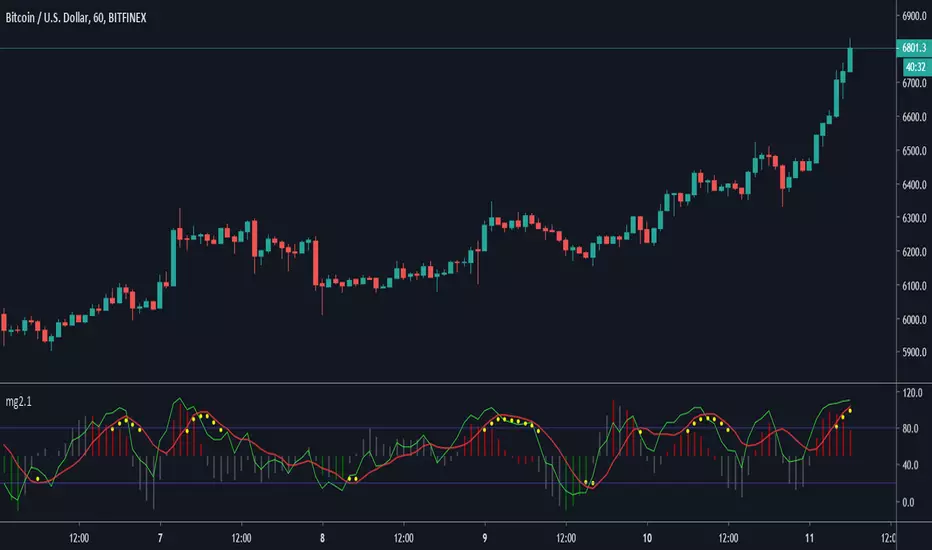
Minimal Godmode 2.1// Acknowledgments:
// Original Godmode Authors:
// @Legion, @LazyBear, @Ni6HTH4wK, @xSilas
// Drop a line if you use or modify this code.
// Godmode 3.1.4: @SNOW_CITY
// Godmode 3.2: @sco77m4r7in and @oh92
// Godmode3.2+LSMA: @scilentor
// Godmode 4.0.0-4.0.1: @chrysopoetics
// Jurik Moving Average: @everget
// Constance Brown Composite Index RSI: @LazyBear
// Wavetrend Oscillator: @fskrypt
// TTM Squeeze: @Greeny
// True TSI/RSI: @cI8DH and @chrysopoetics
// Laguerre RSI (Self-Adjusting Alpha with Fractals Energy): @everget
// RSI Shaded: @mortdiggiddy
// Minimal Godmode v2.0:
// 6 BTC pairs/exchanges (instead of 11) to reduce loading time from the pinescript security() function
// Volume Composite for engine calculation
// TTM Squeeze on Wavetrend Signal
// Constance Brown Composite Index RSI (CBCI)
// TrueTSI (Godmode 4.0.0 implementation)
// Laguerre RSI (LRSI)
// Minimal Godmode v2.1:
// Removed TTM Squeeze and Volume Composite
// EMA for Wavetrend Signal
// Multi-exchange for BTC no longer the default
// mg engine toggle for CBCI, Laguerre RSI, and TTSI
// Wavetrend Histogram component toggle

BUBD+ - Bats Ultimate Bullish Divergence DetectorBUBD checks for price divergence from oscillators across 6 different oscillators - MACD, CCI (Vol. weighted), RSI, Stochastic RSI, Money Flow and Relative Vigor index. Use it to find good entry spots for longs and also to find downtrend reversals. If this gets popular I will release a Bearish divergence indicator as well.
Please check your stock/crypto across all time frames to get a hint of any developing "Bullish" divergences.
In case you get mixed signals -
Blue - RSI
Purple - RVI
Yellow - CCI
Green - MACD
Lime light green - MFI
Orange - Stoch RSI
Dont get confused by signals appearing on top and bottom all are bullish indicators. If you see a signal go to the respective oscillator to check the developing trend.

Multiple Values TableThis Pine Script indicator, named "Multiple Values Table," provides a comprehensive view of various technical indicators in a tabular format directly on your trading chart. It allows traders to quickly assess multiple metrics without switching between different charts or panels.
Key Features:
Table Position and Size:
Users can choose the position of the table on the chart (e.g., top left, top right).
The size of the table can be adjusted (e.g., tiny, small, normal, large).
Moving Averages:
Calculates the 5-day Exponential Moving Average (5DEMA) using daily data.
Calculates the 5-week and 20-week EMAs (5WEMA and 20WEMA) using weekly data.
Indicates whether the current price is above or below these moving averages in percentage terms.
Drawdown and Williams VIX Fix:
Computes the drawdown from the 365-day high to the current close.
Calculates the Williams VIX Fix (WVF), which measures the volatility of the asset.
Shows both the current WVF and a 2% drawdown level.
Relative Strength Index (RSI):
Displays the current RSI and compares it to the RSI from 14 days ago.
Indicates whether the RSI is increasing, decreasing, or flat.
Stochastic RSI:
Computes the Stochastic RSI and compares it to the value from 14 days ago.
Indicates whether the Stochastic RSI is increasing, decreasing, or flat.
Normalized MACD (NMACD):
Calculates the Normalized MACD values.
Indicates whether the MACD is increasing, decreasing, or flat.
Awesome Oscillator (AO):
Calculates the AO on a daily timeframe.
Indicates whether the AO is increasing, decreasing, or flat.
Volume Analysis:
Displays the average volume over the last 22 days.
Shows the current day's volume as a percentage of the average volume.
Percentile Calculations:
Calculates the current percentile rank of the WVF and ATH over specified periods.
Indicates the percentile rank of the current volume percentage over the past period.
Table Display:
All these values are presented in a neatly formatted table.
The table updates dynamically with the latest data.
Example Use Cases:
Comprehensive Market Analysis: Quickly assess multiple indicators at a glance.
Trend and Momentum Analysis: Identify trends and momentum changes based on various moving averages and oscillators.
Volatility and Drawdown Monitoring: Track volatility and drawdown levels to manage risk effectively.
This script offers a powerful tool for traders who want to have a holistic view of various technical indicators in one place. It provides flexibility in customization and a user-friendly interface to enhance your trading experience.
