BB MTF FVGs & First PresentedBB MTF FVGs with First Presented FVG Highlight
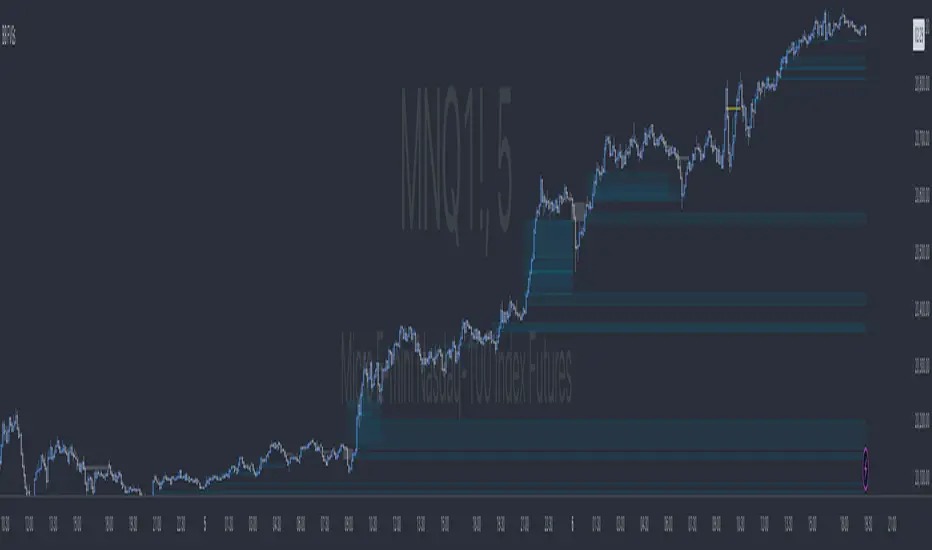
The BB MTF FVGs with First Presented FVG Highlight indicator is an advanced trading tool designed to help users identify and monitor Fair Value Gaps (FVGs) across multiple timeframes, offering traders deep insight into market structure and liquidity imbalances. With the ability to track up to three distinct timeframes (e.g., 1-minute, 1-hour, and 1-day), this indicator provides a comprehensive multi-level perspective, helping traders recognize critical support and resistance areas based on liquidity gaps. Additionally, it highlights the first FVG that presents after a specific time each day, making it especially useful for traders who prioritize session starts or key time-based market activity.
_________________________________________________________________________________
Key Features
1. Multi-Timeframe FVG Detection on Three Levels:
• Track FVGs on three user-defined timeframes for a robust view of liquidity gaps across intraday, intermediate, and higher timeframes. For instance, you could set up 1-minute, 1-hour, and 1-day timeframes to capture the market’s behavior from granular intraday action to daily structural gaps. Each timeframe is fully customizable, and users can enable or disable individual levels as needed.
2. Price Action-Driven FVG Status Analysis:
• The indicator continuously monitors price action to assess the state of each FVG. FVGs are dynamically styled based on their status:
• Untouched: FVGs with solid borders indicate that price has not yet traded into the gap.
• Mitigated: If price partially fills or “mitigates” an FVG, its borders turn dotted, providing visual feedback that the gap has seen some interaction.
• Inverted: When an FVG is fully invalidated by price moving completely through it, the border is removed, signaling the inversion. This real-time analysis gives traders instant feedback on the status of each FVG, helping them quickly assess active, mitigated, or invalidated zones.
3. Highlighting the First FVG After a Specified Time:
• A unique feature that highlights the first FVG presented after a specified time (e.g., 9:30 AM) each day, making it easy for traders to focus on session-based FVGs that could impact market direction. This feature is especially valuable for those tracking the opening range or specific session periods.
4. Configurable FVG Extension Options:
• The indicator offers flexible settings to control how long each FVG remains extended across the chart. Users can choose to extend until the first mitigation, until full mitigation, until inversion, or opt for no extension. This allows traders to adjust FVG visibility duration based on their strategy and trading style.
_________________________________________________________________________________
Customizable User Inputs
The BB MTF FVGs with First Presented FVG Highlight indicator includes various customization options for a personalized experience:
• Three Configurable Timeframes for FVG Tracking:
• Timeframe 1: Primary timeframe, like 1 minute, to capture short-term gaps.
• Timeframe 2: Secondary timeframe, such as 1 hour, to observe intraday market structure.
• Timeframe 3: Higher timeframe, like 1 day, to track major gaps with a longer-term impact. Each timeframe is independently customizable, allowing users to tailor their multi-timeframe FVG setup to fit their trading approach.
• Session-Based First FVG Highlighting:
• Highlight Type: Select whether to highlight only the first FVG presented after the defined time, display it with other FVGs, or turn off the highlight feature.
• Start and End Time for First Highlighted FVG: Specify the start and end time (e.g., 9:30 AM to 10:30 AM) for highlighting the first FVG, enabling a session-focused approach.
• Plotting Control for Forming FVGs:
• Forming FVG Display: Enable or disable forming FVGs for each timeframe, allowing traders to track potential gaps as they start to appear before confirmation.
• Color and Style Customization:
• FVG Colors: Define colors for long and short FVGs on each timeframe for visual clarity. Additionally, set the highlight color for the first FVG to make it stand out.
• Border Styling Based on FVG Status: The indicator’s dynamic border styling provides a clear visual status for each FVG:
• Solid borders for untouched FVGs.
• Dotted borders for mitigated FVGs.
• Borderless display for inverted FVGs.
• Flexible FVG Extension Duration:
• Choose the extension behavior for FVGs based on preferred criteria: extending until first mitigation, keeping them until fully mitigated, extending until inversion, or selecting no extension. This flexibility is ideal for traders who want to adapt FVG visibility to specific conditions.
_________________________________________________________________________________
Technical Details
This indicator leverages precise, real-time calculations to monitor price interactions with each FVG, ensuring clarity and accuracy across multiple timeframes without duplicate or redundant displays. It offers traders a powerful way to track liquidity gaps at various market levels with the added benefit of immediate visual feedback on gap status.
Wyszukaj w skryptach "mtf"
EMA20 in MTFThe "EMA20 in MTF" indicator on TradingView is a versatile tool designed to display the 20-period Exponential Moving Average (EMA) as a horizontal line across various time frames. This indicator provides traders with a comprehensive view of the EMA's behavior by plotting it on multiple time frames (MTF), including Quarterly, Monthly, Weekly, Daily, and 125 Minutes.
By incorporating EMA data from different time frames, traders can gain insights into both short-term and long-term trends. The Quarterly and Monthly time frames offer a broader perspective on market movements, while the Weekly and Daily time frames provide intermediate-term trends. The inclusion of the 125 Minutes time frame further enhances precision, catering to intraday trading strategies.
Overall, the "EMA20 in MTF" indicator serves as a valuable tool for traders seeking to analyze EMA dynamics across various time frames, aiding in trend identification and decision-making processes.

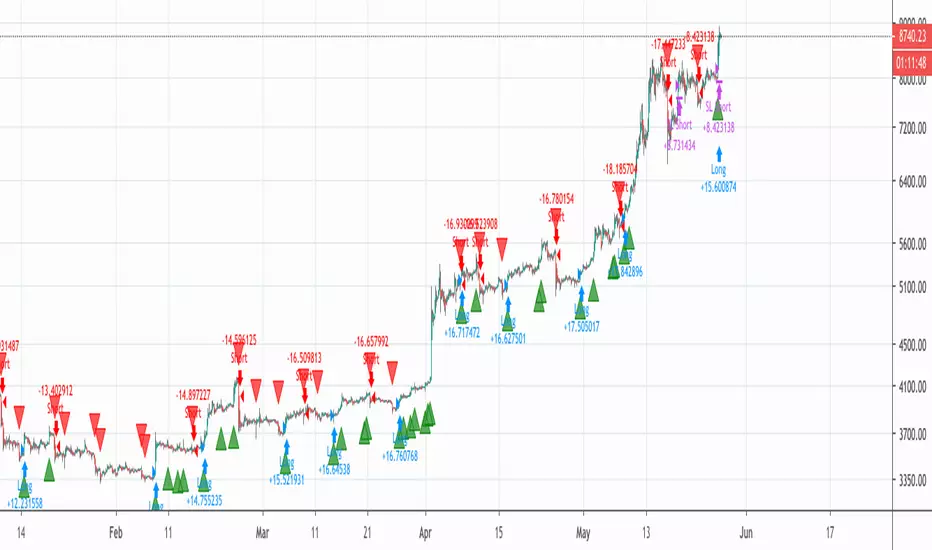
Support and Resistance Signals MTF [LuxAlgo]The Support and Resistance Signals MTF indicator aims to identify undoubtedly one of the key concepts of technical analysis Support and Resistance Levels and more importantly, the script aims to capture and highlight major price action movements, such as Breakouts , Tests of the Zones , Retests of the Zones , and Rejections .
The script supports Multi-TimeFrame (MTF) functionality allowing users to analyze and observe the Support and Resistance Levels/Zones and their associated Signals from a higher timeframe perspective.
This script is an extended version of our previously published Support-and-Resistance-Levels-with-Breaks script from 2020.
Identification of key support and resistance levels/zones is an essential ingredient to successful technical analysis.
🔶 USAGE
Support and resistance are key concepts that help traders understand, analyze and act on chart patterns in the financial markets. Support describes a price level where a downtrend pauses due to demand for an asset increasing, while resistance refers to a level where an uptrend reverses as a sell-off happens.
The creation of support and resistance levels comes as a result of an initial imbalance of supply/demand, which forms what we know as a swing high or swing low. This script starts its processing using the swing highs/lows. Swing Highs/Lows are levels that many of the market participants use as a historical reference to place their trading orders (buy, sell, stop loss), as a result, those price levels potentially become and serve as key support and resistance levels.
One of the important features of the script is the signals it provides. The script follows the major price movements and highlights them on the chart.
🔹 Breakouts (non-repaint)
A breakout is a price moving outside a defined support or resistance level, the significance of the breakout can be measured by examining the volume. This script is not filtering them based on volume but provides volume information for the bar where the breakout takes place.
🔹 Retests
Retest is a case where the price action breaches a zone and then revisits the level breached.
🔹 Tests
Test is a case where the price action touches the support or resistance zones.
🔹 Rejections
Rejections are pin bar patterns with high trading volume.
Finally, Multi TimeFrame (MTF) functionality allows users to analyze and observe the Support and Resistance Levels/Zones and their associated Signals from a higher timeframe perspective.
🔶 SETTINGS
The script takes into account user-defined parameters to detect and highlight the zones, levels, and signals.
🔹 Support & Resistance Settings
Detection Timeframe: Set the indicator resolution, the users may examine higher timeframe detection on their chart timeframe.
Detection Length: Swing levels detection length
Check Previous Historical S&R Level: enables the script to check the previous historical levels.
🔹 Signals
Breakouts: Toggles the visibility of the Breakouts, enables customization of the color and the size of the visuals
Tests: Toggles the visibility of the Tests, enables customization of the color and the size of the visuals
Retests: Toggles the visibility of the Retests, enables customization of the color and the size of the visuals
Rejections: Toggles the visibility of the Rejections, enables customization of the color and the size of the visuals
🔹 Others
Sentiment Profile: Toggles the visibility of the Sentiment Profiles
Bullish Nodes: Color option for Bullish Nodes
Bearish Nodes: Color option for Bearish Nodes
🔶 RELATED SCRIPTS
Support-and-Resistance-Levels-with-Breaks
Buyside-Sellside-Liquidity
Liquidity-Levels-Voids

Premium MTF Layered RSI - Bitcoin Bot [wbburgin]This the premium version of my MTF Layered RSI strategy, which improves significantly on the original strategy (publicly available on my profile). Improvements are below. This strategy will also appear as an overlay on your chart. It is completely non-repainting.
The MTF Layered RSI strategy uses the current timeframe and two configurable higher timeframes to enter a long position when Bitcoin is oversold on all three timeframes, and exit the long position when Bitcoin is overbought on the current timeframe. This hedges against situations where the RSI on higher timeframes never reaches the overbought level and we are left "holding the bag" so to speak with the classic "enter long at oversold and enter short at overbought" strategy.
IMPORTANT: This strategy does not work on ranges. It will work on all timeframes and assets, but does not work on ranges (Renko blocks and some other advanced types of charts).
********** My Background
I am an investor, trader, and entrepreneur with 10 years of cryptocurrency and equity trading experience and founder of two fintech startups. I am a graduate of a prestigious university in the United States and carry broad and inclusive interests in mathematical finance, computer science, machine learning / artificial intelligence, as well as other fields.
**********
Improvements over the original MTF RSI strategy include:
Filters for Uptrends and Downtrends → The Premium RSI strategy will adjust its buy and sell thresholds depending on whether the instrument is trending. This means that, in uptrends, the Premium strategy will buy more frequently, bringing in potentially greater profit, and in downtrends, the strategy will stop buying altogether. These filters and dynamic buy/sell thresholds have made this strategy more profitable in my backtesting across random timeframes, but I cannot guarantee that the strategy will be profitable for you on the default settings. To that end, I have enabled a number of different configurations that you can change in the settings of the strategy.
Stop Loss / Take Profit Calculation Per Tick → Stop loss and take profit are now both enabled in the script and each has their own alerts. You can specify what type of stop loss or take profit you want: percentage or ATR. If you have alerts configured, you will be alerted mid-bar, instead of at close. This helps prevent loss from abrupt falls in price between closing price and next bar open.
Customizable Alert Messages In-Strategy → In the settings, there will be text boxes where you can create your own alerts. All you will need to do is create an alert in the alert panel on Tradingview and leave the message box blank - if you fill out the alert boxes in the settings, these will automatically populate into your alerts. There are in total eight different customizable alerts messages: Entry, Exit, Stop loss, and Take profit alerts for both Long and Short sides. If you disable stop loss and/or take profit, these alerts will also be disabled. Similarly, if you disable shorts, all short alerts will be disabled.
**********
Display
Configuring Stop Loss or Take Profit will make their corresponding displays appear.
Separately from the trading boxes, background colors (green, red) signify extended uptrends and downtrends, respectively.
Configuring Alerts
In TradingView desktop, go to the ‘Alerts’ tab on the right panel. Click the “+” button to create a new alert. Select this strategy for the condition and one of the two options that includes alert() function calls. Name the alert what you wish and clear the default message, because your text in the settings will replace this message.
Now that the alert is configured, you can go to the settings of the strategy and fill in your chosen text for the specific alert condition. You will need to check “Long and Short” in the “Trade Direction” setting in order for any Short Alerts to become active. Similarly, you will need to check “Enable Stop Loss” for stop loss alerts to become active and “Enable Take Profit” for take profit alerts to become active.
**********
Disclaimer
Copyright by wbburgin.
The information contained in my Scripts/Indicators/Algorithms does not constitute financial advice or a solicitation to buy or sell any securities of any type. I will not accept liability for any loss or damage, including without limitation any loss of profit, which may arise directly or indirectly from the use of or reliance on such information.
All investments involve risk, and the past performance of a security, industry, sector, market, financial product, trading strategy, backtest, or individual's trading does not guarantee future results or returns. Investors are fully responsible for any investment decisions they make. Such decisions should be based solely on an evaluation of their financial circumstances, investment objectives, risk tolerance, and liquidity needs.
**********
Notes on the Strategy Performance below: This is 3% of equity per trade, with a pyramiding number of 3. I did not include fees because Binance US on Bitcoin/USD does not charge fees on the instrument; however, I heavily encourage you to include fees in your backtesting if you use a different brokerage. To mitigate fees, this strategy is designed with a high average %/trade. If your current fees are greater than the strategy's average %/trade, I encourage you to choose a higher RSI period, such as 14 or 28, which will result in less trades but potentially a higher %/trade.

Regression Channel Alternative MTF█ OVERVIEW
This indicator displays 3 timeframes of parallel channel using linear regression calculation to assist manual drawing of chart patterns.
This indicator is not true Multi Timeframe (MTF) but considered as Alternative MTF which calculate 100 bars for Primary MTF, can be refer from provided line helper.
The timeframe scenarios are defined based on Position, Swing and Intraday Trader.
█ INSPIRATIONS
These timeframe scenarios are defined based on Harmonic Trading : Volume Three written by Scott M Carney.
By applying channel on each timeframe, MW or ABCD patterns can be easily identified manually.
This can also be applied on other chart patterns.
█ CREDITS
Scott M Carney, Harmonic Trading : Volume Three (Reaction vs. Reversal)
█ TIMEFRAME EXPLAINED
Higher / Distal : The (next) longer or larger comparative timeframe after primary pattern has been identified.
Primary / Clear : Timeframe that possess the clearest pattern structure.
Lower / Proximate : The (next) shorter timeframe after primary pattern has been identified.
Lowest : Check primary timeframe as main reference.
█ EXAMPLE OF USAGE / EXPLAINATION

ORB PSAR MTF Screener+ 1.0The parabolic SAR is a technical indicator used to determine the price direction of an asset, as well as draw attention to when the price direction is changing.
Sometimes known as the "stop and reversal system," the parabolic SAR was developed by J. Welles Wilder Jr., creator of the relative strength index (RSI).
PSAR can itself prove to be great trading strategy if it is used on a multiple timeframe.
This indicator contains the followings:
1. A Screener to process multiple stocks at one go to show possible trades
2. MTF plotting of trading signals for individual stocks as well as list of stocks
3. Alert system to inform you of possible trade setups
4. Auto selection of best MTF for trades
5. Strength Candle markings.
6. Configurable options to customise as per your need.
The indicator works on the 1 Min, 5Min, 30Min, 1Hr, 4Hr, Daily, Monthly setups.
Due to TradingView restrictions and MTF usages, the screener can process a list of only 14 symbols. However , you can use the alerts option to define multiple lists of 14 stocks.
Enjoy!

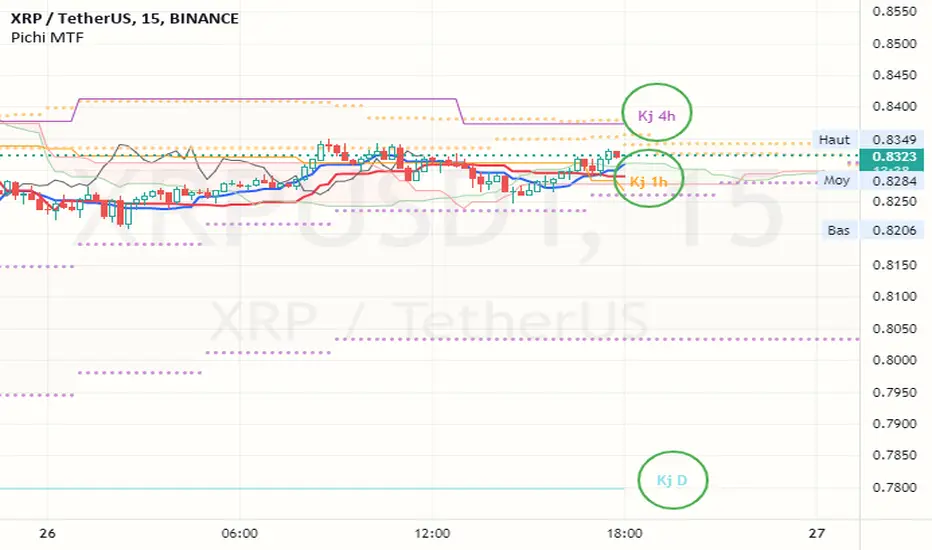
Pax24 MTF IchimokuPax24 Multiple Time Frames and Adaptative Ichimoku Cloud.
(based on the scripts : MTF Selection Framework by PineCoders and MTF ichimoku by anthonyf50)
Possible display :
- four differents Ichimoku, 1 current and 3 from higher UT (depending on your actual UT)
- Tenkan, Kijun, Chikou and Kumo for all
- labels : offset from line, color if you change style and with/without abbreviation
The 3 upper ichimoku you can display depends of your actual Time Frame :
- M1, M3 => M5 M15 H1
- M5 => M15 H1 H4
- M15, M30, M45 => H1 H4 D
- H1, H2, H3 => H4 D W
- H4, H6, H12 => D W M
- D => W M
- W => M
- M => none other
To add the indicator on your graph, go to "Indicators" then search for "Pax24 MTF Ichimoku" and add the script to your favorites.
-------- CONFIGURATION -------
Base : ichimoku numbers
ichimoku and +1 +2 +3 : Show the first ichimoku (actual UT) and 3 others (higher UT)
for each :
Tenkan : Show the Tenkan
Kijun : Show the Kijun
Chikou : Show the Chikou (Lagging span)
Kumo : Show the Kumo
Label : Show the labels
Offset : Label offset
Color : Label color (because you can't change the style of the label in "Style")
Abbreviation : Label abbreviation (Tk = Tenkan)
If you want to best see others UT kumo, change transparency in style for Kumo
There may be slow display since TradingView requires a minimum of candles to make these calculations. Just zoom out and then zoom in to fix the problem (especially for kumo).
[TTI] MTF – Moving Averages & Bollinger Bands
––––History & Credit
Big credit to kv4coins, whose script I used to build upon, check it out great for MTF indicator of MAs
–––––What it does
The script allows you to see different moving averages, on different timeframes as well as seeing their last values.
There is a table to reference the values of the MAs for Stop Losses
It also includes MTF Bollinger Band with a special trick. The upper and lower BB can be changed and customised. This way you can plot a upper band of 3 stdv and lower band of 1stdv. Also it includes, MTF as well.
–––––How to use it
MAs and BBs are lagging indicators used for determining the trends of the market. They are used in many methodologuies in trading.

REDWOOD MTF MacD Stochastic RSIOne of out most premium indicators is this MTF MacD Stochastic RSI combo.
This is calculated with specific conditions to give the best signals for market reversals or continued trends.
=======
For a detailed description of how the REDWOOD MacD works, see profile (links of personal indicators arent posting for some reason)
For a detailed description of how the REDWOOD Stochastic RSI works, see profile
=======
These are both powerful indicators alone, but together they work very well together to confirm positions or see new entries or exits.
Without giving too much away on how it is made, this takes trades when the MacD is weak, with a confirming signal from the Stoch RSI
just the other way, it takes trades when the MacD is strong, and the Stoch RSI confirms trend.
This was made to reduce clutter of watching multiple indicators, while still giving you a chance to see what both indicators are doing and how they are flowing together.
Custom alerts are set so you never miss a trade opportunity! Get alerted on all reversals, strong signals, or even signals from the MacD or Stochastic RSI crosses!
This is a Multi Timeframe indicator so you can see what is happening on a long term time frame while trading short time frame bars, getting a better position in the market.
Best trades are when the alert or indicator is signaling, and the close of the MacD is about to happen on the MTF time frame set. All timeframes for both MacD and Stoch can be customized, and they do come with default settings.
Best MTF Time frames are longer timeframes (1hr, 4hr, D) but it can work well with current timeframe and lower timeframes (15min, 30min)
All settings for the MacD and Stoch are the same as the original, you can remove the MacD or histogram, remove or see crosses, and even color in pivot points in the MacD
~~~
Added feature is this indicator by default shows the MacD to tell you the overall trend, but you can uncheck the Show MacD setting to remove the MacD and check the Show Stoch RSI to have the indicator show you the Stoch RSI all in the same indicator! This is extremely useful to see where the Stoch RSI is at when the MacD is turning or pivoting. If the stoch is turning as well and overbought or oversold, it is a good time to enter or exit a position.
Dark Green is showing buy signals, and dark maroon is showing sell signals.
The coloring in the background (red, lime) is showing the trend we are riding and when the color goes away it is an indication of a possible trend reversal or dip coming. These are mostly used to confirm positions.
~~~
The timeframes I recommend would be the 4hr on both, althought it has proven to work well (if you want more signals) to have either the MacD or Stoch RSI on a higher timeframe and the opposite on a lower timeframe.
All plots and inputs can be customized to your own liking, and there is the option to color the bars with the Stoch RSI being overbought or oversold.
Best Trading Strategy : Enter positions according to the colors being alerted (green = buy, red = sell) when the FIRST is alerted. This is the ideal and best entry.
For safer trading you can wait for a second to confirm and enter there.
Trades can be taken on the shading colors too, trading on trend waves, although this is risky as some waves end abruptly. Best signals are as stated above.
This indicator works very well on its own but can work well along side our other indicators listed here :
Bishop MA's or MA Cloud with Fill
This can be a very useful indicator, and I'm sure some may find settings that work even better
than the default or recommended settings.
This indicator works on all markets, forex, cryptocurrency, and stocks.
For access to this and all indicators available, please DM me here or See profile.
We are here to help each other succeed! The more one succeeds the more we all succeed! We are all in this
together and every person deserves to be financially independent and confident when taking trades
and investing.

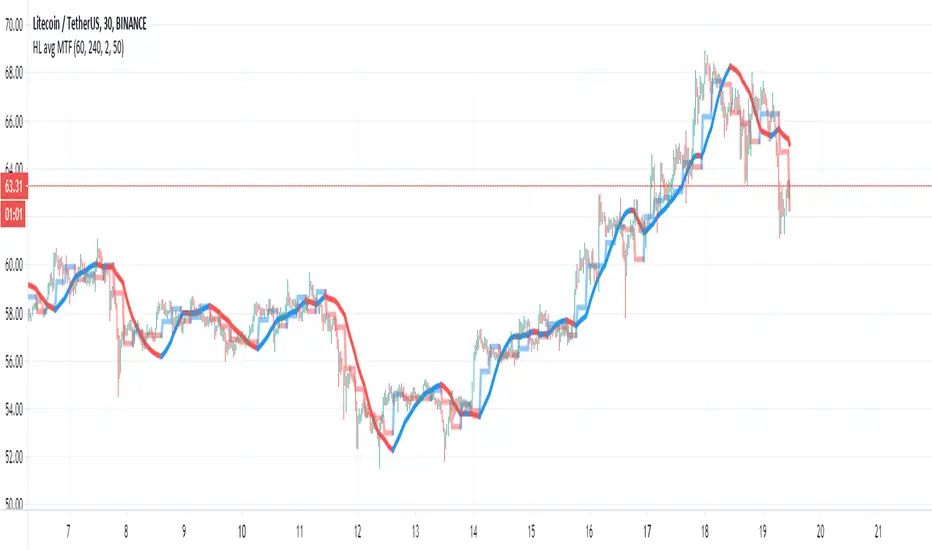
HL avg MTFThis indicator try to find trends more accurate
So first step is to make candle MTF and to find the average of high and low of the MTF candle. I think a ratio of 4/1 is good .
so this seen in the lime /red line
after we take this line and transform it to linear regression type . I use here 50 candle size seen in blue line
if close are above the blue line then we are above the avg of the high and low of the mtf candle .. this indicate a positive trend. if we close is bellow the blue line then it a negative trend and it good time to short it .
also very important is the direction of the blue line as it give us the direction of the trend
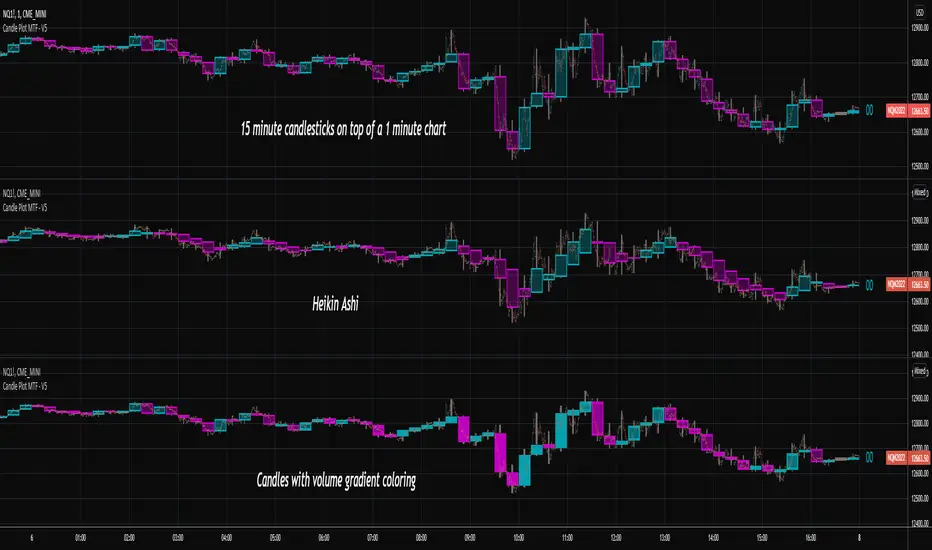
Candlestick Plot MTFPlots the live non-repainting candles for a higher time interval than the chart interval.
Features:
Configuration of the look and feel of the MTF candles.
Live candles update as the price action evolves for the session.
Historical candles can be toggled on/off.
Includes a moving average ribbon that is also MTF, matching the interval chosen.
Please watch this video to understand more:
CR MTF True Sight V1.0 [Signal Script]
Signal script for MTF True Sight strategy: CR MTF True Sight V1.0
When creating alarm, select the signal script and use other fields like this (Change Sell and Sell Alert to Buy and Buy Alert for buy signals):
imgur.com
RSI Shaded - MTF
Non-repainting multiple time frame RSI with shading of overbought and oversold levels.
Includes option for simple moving average smooth of the RSI (Larry Connors)
Includes option to plot the EMA of the RSI
Related to RSI Shaded .
For other multiple time frame indicators see:
Adaptive ATR-ADX Trend
Fisher Transform MTF
ADX-DI MTF
Laguerre RSI MTF
[OZ]MTF Ichimoku CloudBased on this script from RicardoSantos:
This script can display Ichimoku cloud , SSA , SSB , Chikou, Kijun and Tenkan from another time frame.
With it you can apply Karen Péloille's MTF Ichimoku Kinko Hyo advanced trading techniques on TradingView.
By default Tenkan is not displayed (fully transparent).
The original script has been enhanced to draw the full cloud beyond the price and to draw the Chikou.

SMA/WMA histogram with MTF and alertsThis histogram is based on the difference between SMA and WMA (I make it as false MACD to create signals)
Since we have the non repainting MTF function we can see the buy and the sell signals at different time frames.
the color of the histo change according to difference so as the color change from dark red to light red be ready to buy and if color change from dark green to light green be ready to sell. The signal based on cross to the 0 .
since you have MTF in build you can change time frame changing int2 to desire min you want
here 60 min MTF on 30 min graph. you can make any variation you want .it flexible model allow you to find the best setting for your purpose

modified DMI with MTF and alertsThis is special indicator based on DMI , I add to time length MTF that is not repainting
you can change the MTF using int2 function
the alerts are based on crossing the 0 (up or down)
I hope you like it
with no MTF

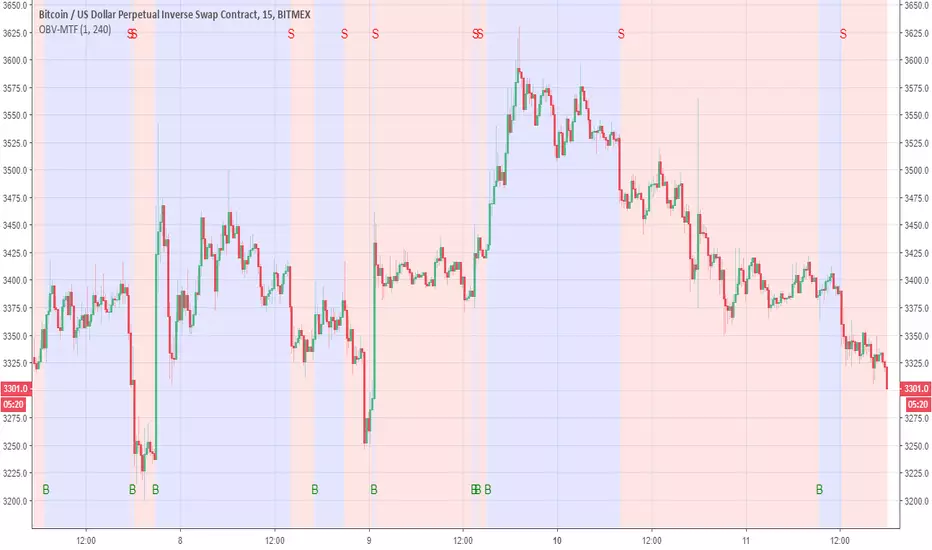
OBV-MTFUsing modified OBV volume equetion and using our modified MTF length (not need to use security so no repaint )
the Buy and Sell reresent in B and S and by the colors of bullish compare to bearish
You change the MTF by changing int2
in this example is set to 240 min MTF over 15 min charts
alerts inside
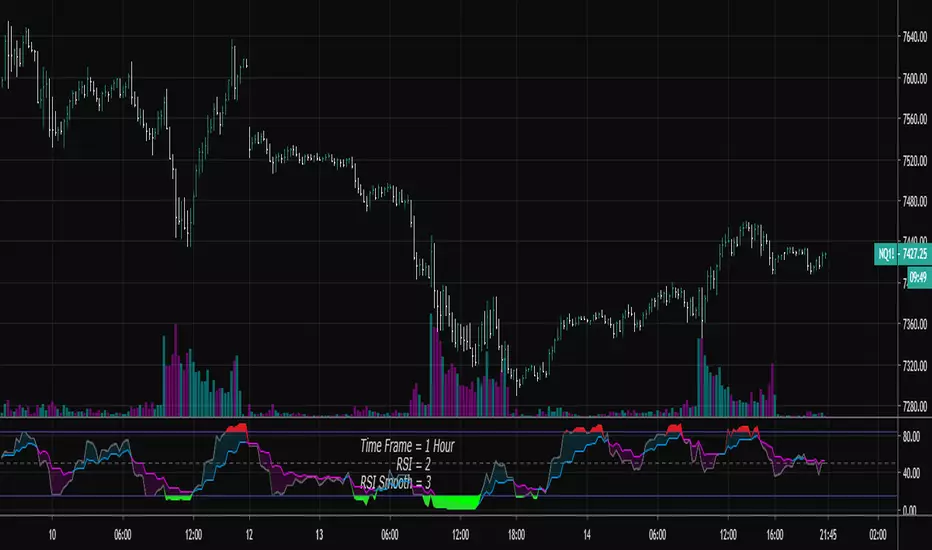
lsi (study about length and MTF) Here in this example I took lazy bear famous momentum squeeze indicator . the problem that there is lagging in the indicator so the buy and sell will be late . So instead the KC length that the original script had we put
int1=input(30)
int2=input(60)
lengthKC=isintraday and interval >= int1 ? int2/interval * 7 : isintraday and interval < 60 ? 60/interval * 24 * 7 : 7
this allow us to create a time and length related function to indicator and result in better output with no lagging
The second and most important thing is the ability to create indicator with time function as MTF without the security function that create repaint
all you need to do is to change int2 (to the time min of your choice ) and you can create an indicator with MTF function without the security function .And by this hopefully avoid the repainting issue
when you use this indicator change the setting of int1 and int 2 according to time frame that you use
lets say 15 min graph
make the int1 <15 min and the int2 at 15 min. if you want to see it as MTF just increase the int2 to the time set of your choice and play little with int1 to best setting

FVG / Imbalance MTF Pro (4 HTFs + Alerts) - (@JP7FX)FVG / Imbalance MTF Pro (@JP7FX)
This indicator finds and plots Fair Value Gaps across up to four higher timeframes on a single chart. It shows them as lines, zones, 50 percent levels and labels, and can fire alerts when new gaps form or when price mitigates them.
Core logic
The script detects bullish and bearish FVGs using the classic three candle logic:
• Bullish FVG when high is below the current low.
• Bearish FVG when low is above the current high.
All logic runs on the selected higher timeframes through request.security, then projects the zones down onto your current chart timeframe. The script also checks that your chart timeframe is equal to or lower than the selected HTFs so the plots stay meaningful.
Multi timeframe control
You can configure up to four separate FVG layers: TF1, TF2, TF3 and TF4.
For each TF you can choose:
• Timeframe (or link it to the chart).
• Display mode, Lines and Zones, Zones Only, Lines Only, or Disable.
• Whether to show the 50 percent line.
• Whether to show a label with the TF name next to each FVG.
Inputs also convert the timeframe into minutes and hours so labels can show clear tags such as “15m”, “1h” and so on.
Visuals per timeframe
For every timeframe you can set:
• Entry and stop FVG line colours.
• 50 percent line colour and line style.
• Bullish and bearish zone fill colours.
• Separate colours for mitigated bullish and mitigated bearish zones.
• Label text colours for demand and supply.
Each FVG can draw:
• Two lines for the “entry” and “stop” edges of the gap.
• An optional 50 percent line through the zone.
• A shaded box that tracks the zone as price trades into it.
• A label that shows the originating timeframe.
Line and zone behaviour
Global settings let you control:
• Maximum number of FVG lines and zones kept on the chart.
• Line style for FVG edges and 50 percent lines.
• Whether lines and zones extend to the right.
• Whether zones update with price movement as price trades deeper.
• Whether the zone colour changes once the FVG has been mitigated.
• Label offset so you can push the TF labels to the right of price.
• An option to avoid overlapping zones per timeframe by checking for box overlap.
The script uses arrays of lines, boxes and labels for each TF and for demand and supply separately. It removes the oldest objects once the max count is hit and deletes or recolours zones when price reaches them.
Bar colouring
You can optionally colour the bar that creates the chart timeframe FVG.
• Bullish FVG origin bar can show as green.
• Bearish FVG origin bar can show as red.
Alerts
The indicator exposes alertcondition signals for both creation and mitigation. For each timeframe it supports:
• FVG zone created, bullish or bearish.
• Bullish FVG mitigated.
• Bearish FVG mitigated.
You choose the alert pack per TF through the inputs, then set the alert from the chart by right clicking the indicator and adding an alert.
Use case
This tool is for traders who map and trade Fair Value Gaps across multiple higher timeframes and want clean, configurable MTF FVG zones with clear labels, mitigation behaviour and alerts all in one script.

Orderblocks MTF Pro (4 HTFs + Alerts) - (@JP7FX)Orderblocks MTF Pro (JP7FX)
Orderblocks MTF Pro identifies higher timeframe orderblocks and displays them on lower timeframe charts. It tracks when new orderblocks form, remain active or become mitigated.
Higher Timeframe Orderblocks
The indicator can display orderblocks from four higher timeframes at the same time.
Users can select which HTFs to show, such as Daily, 4H, 1H and 15m.
Bullish and Bearish Orderblocks
Bullish orderblocks mark areas where buying pressure formed during prior moves.
Bearish orderblocks mark areas where selling pressure formed.
Each block is colour coded and can be customised.
Mitigation Tracking
The tool monitors when price returns to a previously formed orderblock.
If price trades back into the block, the indicator can mark it as mitigated or keep it highlighted as active depending on user settings.
Alerts
Alert conditions are included for:
• New orderblock creation
• Orderblock mitigation
Users can enable or disable alerts for each timeframe.
Customisation
• Choose up to four higher timeframes to display
• Custom colours for bullish and bearish blocks
• Visibility filters for active and mitigated blocks
• Adjustable opacity and block display style
Use Cases
Suitable for traders who reference higher timeframe zones while executing on lower timeframes.
The indicator reduces manual chart work by identifying and updating HTF orderblocks automatically.

SuperTrend Oscillator MTF█ OVERVIEW
SuperTrend Oscillator MTF is a multi-timeframe version of the classic SuperTrend converted into an oscillator. Instead of drawing the SuperTrend line on the price chart, it displays the distance of the close from the SuperTrend line simultaneously for the current timeframe and two additional timeframes. This allows you to instantly see the trend direction and strength across three selected timeframes in a single window.
█ CONCEPT
The classic SuperTrend value is subtracted from price and normalized so that trend direction can be directly compared across different timeframes without switching charts.
- Value above zero = price below SuperTrend line → bearish trend
- Value below zero = price above SuperTrend line → bullish trend
- The further away from zero, the stronger the trend.
█ FEATURES
- Three SuperTrend Oscillator lines: current TF, TF1 and TF2
- Automatic detection of 3-timeframe agreement
- BUY and SELL labels that appear only when all three timeframes turn in the same direction at the same moment
- Circle signals on every zero-line cross of the current timeframe
- Configurable soft gradient fill (can be disabled)
- Zero line changes color (green/red/gray) depending on 3-TF agreement
- Fully customizable colors for each timeframe
- Built-in alerts for all signal types
█ HOW TO USE
Add the indicator to the chart → set two additional timeframes and adjust ATR Period and Factor to suit your trading style.
Main settings:
- ATR Period → default 10
- Factor → default 3.0 (higher = fewer signals)
- TF 1 and TF 2 → any timeframes (e.g. 1H+4H, 4H+D, D+W, etc.)
- Enable gradient → turn fill on/off
- Show BUY/SELL labels (3 TF agreement) → enable/disable the strongest signals
Interpretation:
Two types of signals:
- Green/red circles → current timeframe changes trend direction (faster signal)
- BUY/SELL labels → all three timeframes simultaneously switch to the same direction (strongest confluence)
- Additionally, the zero line turns green or red when all three trends are aligned.
█ APPLICATIONS
Perfect for:
- Trend-following with multi-timeframe confirmation
- Filtering false breakouts on lower timeframes
- Scalping & day trading (use fast circle signals)
- Swing & position trading (wait for full 3-TF agreement)
Best combined with:
- Support/resistance levels and supply/demand zones – enter long after a confirmed breakout and retest of a key level (e.g. Change of Character, Break of Structure, Order Block, 0.618–0.786 Fibonacci) only when the oscillator shows 3-TF agreement or at least a bullish circle. Hold the trade to the next significant resistance/supply zone.
- Volume and Volume Profile – confirm move strength with rising volume and high-volume nodes at the breakout level. Declining volume while moving away from zero may signal trend exhaustion.
- Classic oscillators (RSI, Stochastic, MACD) – use primarily for spotting divergences and overbought/oversold conditions. One of the safest exits is when a regular or hidden divergence appears on RSI/Stochastic in an extreme zone, even if SuperTrend Oscillator MTF still shows alignment.
█ NOTES
- Works on all markets and all timeframes
- BUY/SELL labels (3-TF agreement) are the cleanest and strongest signals
- Circle signals are faster but more prone to noise
- Higher ATR Period = fewer signals, higher quality

ICT Concept MTF Scanner [Elykia]ICT Concept MTF Scanner
Overview
The ICT Concept MTF Scanner is the ultimate productivity dashboard for traders using SMC (Smart Money Concepts) and ICT methodologies.
Stop switching tabs constantly. This indicator allows you to monitor the market structure (Trend, BOS, CHoCH) of 20 different assets simultaneously, each with its own custom timeframe.
It also overlays the structural points and Premium/Discount zones directly on your current chart.
Key Features:
📊 Multi-Asset Dashboard: Monitor up to 20 symbols (Indices, Forex, Crypto, Metals) in a single, fully customizable table.
clock: Individual Timeframes: Unlike standard screeners, you can set a different timeframe for each ticker (e.g., NQ on 15m, ES on 1h, DXY on 4h).
🧠 Auto-Structure Detection:
BOS (Break of Structure): Trend continuation.
CHoCH (Change of Character): Trend reversal signal.
SMS (Shift in Market Structure): Failure swing.
⚖️ Premium & Discount Zones: Automatically calculates buying (Discount) and selling (Premium) zones based on the Active or Previous range.
🔔 Smart Alerts: Get notified on structural changes or when price enters a Premium/Discount zone.
How to use:
1. Ticker Setup: In the settings, select your favorite assets and assign the specific timeframe you want to monitor for each.
2. Sensitivity (Structure): Adjust the "Period" (Pivot Length). A lower value (e.g., 3-5) detects minor structure, while a higher value (e.g., 10-20) reveals the macro trend.
3. Reading the Table:
Teal: Bullish Structure.
Red: Bearish Structure.
Signal: Shows the most recent structural event (BOS or CHoCH).
Disclaimer :
This indicator is for educational and informational purposes only. Past performance does not guarantee future results. Trade at your own risk.

Crypto Intraday Scalper [Patterns + RSI + Volume + MTF + ADX]# Guide to Reading the Indicator (CIS Pro v2)
## 1. Operational Signals (The Labels)
- **GREEN Label "BUY"**:
**Meaning**: Entry for a Long position.
**Conditions**: Bullish candle pattern + Oversold RSI + High Volume + Bullish 1-hour trend + Sufficient Volatility.
- **RED Label "SELL"**:
**Meaning**: Entry for a Short position.
**Conditions**: Bearish candle pattern + Overbought RSI + High Volume + Bearish 1-hour trend + Sufficient Volatility.
- **No Label**: The market is in an uncertain phase, sideways movement, or filters (ADX/MTF) are blocking signals for protection.
## 2. Trend Lines (The Context)
- **Gray Line (EMA 200)**: This serves as the dividing line between bullish and bearish trends.
**Rule**: Seek Long positions only above the gray line; Short positions only below it.
- **Red/Green Step Line (Supertrend / Trailing Stop)**:
**Green (below the price)**: Strong bullish trend. Acts as dynamic support.
**Red (above the price)**: Strong bearish trend. Acts as dynamic resistance.
**Usage**: Use it for trade exits. If in a Long position and the line turns red, close the entire trade.
## 3. Price Levels (Targets and Supports)
- **Blue/Red/Green Dots (Pivot Points)**:
These are levels calculated from the previous day. The price tends to bounce at these points. Use them as final targets for taking profit.
- **Orange Line (VWAP)**:
This represents the "average price" for the day. If the price deviates too far, it often returns (elastic effect).
- **Dashed Lines (Appear after a signal)**:
**Red Dashed**: Suggested Stop Loss (based on ATR volatility).
**Green Dashed**: Suggested Take Profit (quick target).
## 4. The Table (Dashboard in the Top Right)
This provides reasons why you may not be receiving signals:
- **Trend (Current)**: The trend on your current chart.
- **Trend (MTF 60)**: The trend on the 1-hour chart. If these two conflict (e.g., Bullish vs. Bearish), no signals will appear.
- **ADX Volatility**: If RED (below 20), the market is flat—no trades. If GREEN, there is sufficient movement.
- **Volume Status**: Alerts if anomalous high volume is entering (High) or if conditions are calm.
## 🚀 Operational Summary
- Wait for the label.
- Quick Check: Is the price on the correct side of the gray line? Is the step line the right color?
- Enter the trade.
- Exit when the price hits the green dashed line (Quick Take Profit) **OR** when the price breaks the step line (Trailing Stop for longer trends).
What aspect of this indicator should we analyze next—perhaps integrating it with real-time ETH data or testing it via code execution for backtesting?
