Symbol Comparison MACDHow is this different?
This indicator will calculate a MACD between two symbols chosen. As the two symbols price difference grows or shrinks this indicator plots same as MACD and crosses should indicate interesting things with the right symbol selection.
How to use this?
Simply choose a second symbol for comparison or choose two if main chart symbol isn't needed for comparison, the rest of the settings are quite standard to MACD/PPO settings though 14 period signal seems to align better with my intentions.
Which market is it meant for?
Any market, enjoy creating unique combinations and comment any interesting discoveries. I recommend market internals.
What market conditions does this apply to?
Any condition.
Wyszukaj w skryptach "macd"

Range Strat - MACD/RSIThis strategy uses a trend based indicator (MACD) for entry/exit signals with a momentum oscillator (RSI) to act as confirmation. Although relying on a trend based indicator this has been created for range bound crypto markets, which have been in a period of chop since June 2022.
Long/Short signals are generated from MACD with the RSI oscillator thresholds suppressing entries at price extremes. This is not a mean reversion RSI strategy! As the indicators are contrary to each other you will need to be generous with the RSI settings in order for signals to trigger.
Strategy is designed for use on the 4h timeframe, it may work well on higher timeframes, but lower time frames will lead to false signals. Use fixed percentage of equity for order size to capture the compounding effect. As a reversal strategy bear in mind that should market trend strongly in either direction stops will be required.
The RSI thresholds can be tailored to provide higher frequency or safer signals. Similarly tweaking MACD settings will provide earlier/more frequent or safer signals. As this is intended to enter near range high / low you should check the visual cues to ensure a ping-pong effect is observed, so that peaks and troughs are captured. Once an observable range is established the strategy works well across a range of crypto markets,
The script is open source, so feel free to amend as you wish. Using a different momentum oscillator may provide better results. I have prior coding experience, but first time using PineScript was last night, so it's not very tidy. I will update this with some additional customisation and TP/SL in the near future.
Usage: Range bound markets
Markets: Cryptocurrency Alts/BTC/ETH
Timeframe: 4h

Ichimoku Cloud with MACD (By Coinrule)The Ichimoku Cloud is a collection of technical indicators that show support and resistance levels, as well as momentum and trend direction. It does this by taking multiple averages and plotting them on a chart. It also uses these figures to compute a “cloud” that attempts to forecast where the price may find support or resistance in the future.
The Ichimoku Cloud was developed by Goichi Hosoda, a Japanese journalist, and published in the late 1960s. It provides more data points than the standard candlestick chart. While it seems complicated at first glance, those familiar with how to read the charts often find it easy to understand with well-defined trading signals.
The Ichimoku Cloud is composed of five lines or calculations, two of which comprise a cloud where the difference between the two lines is shaded in.
The lines include a nine-period average, a 26-period average, an average of those two averages, a 52-period average, and a lagging closing price line.
The cloud is a key part of the indicator. When the price is below the cloud, the trend is down. When the price is above the cloud, the trend is up.
The above trend signals are strengthened if the cloud is moving in the same direction as the price. For example, during an uptrend, the top of the cloud is moving up, or during a downtrend, the bottom of the cloud is moving down.
The MACD is a trend following momentum indicator and provides identification of short-term trend direction. In this variation it utilises the 12-period as the fast and 26-period as the slow length EMAs, with signal smoothing set at 9.
This strategy combines the Ichimoku Cloud with the MACD indicator to better enter trades.
Long/Short orders are placed when three basic signals are triggered.
Long Position:
Tenkan-Sen is above the Kijun-Sen
Chikou-Span is above the close of 26 bars ago
Close is above the Kumo Cloud
MACD line crosses over the signal line
Short Position:
Tenkan-Sen is below the Kijun-Sen
Chikou-Span is below the close of 26 bars ago
Close is below the Kumo Cloud
MACD line crosses under the signal line
The script is backtested from 1 June 2022 and provides good returns.
The strategy assumes each order is using 30% of the available coins to make the results more realistic and to simulate you only ran this strategy on 30% of your holdings. A trading fee of 0.1% is also taken into account and is aligned to the base fee applied on Binance.
This script also works well on MATIC (1h timeframe), AVA (45m timeframe), and BTC (30m timeframe).

MTF MACD BarOVERVIEW
This indicator shows MACD(Moving Average Convergence/Divergence) is up or down, represented by a bar. This indicator is compatible with MTF.
CONCEPTS
What do you want to know about market analysis?
Do you want a hard analysis? You can look for it.
All I want to know is whether the commonly known technical analysis is 'UP' or 'DOWN'.
All I want to know is whether the current market price is going up or down. Not only for the current, but also for the monthly, weekly, and daily status.
I want to make a decision in a moment. Without even thinking about it.
That is why I created a color-coded bar indicator to show the status.
No need to frown anymore.
DETAILS
You need more information about MACD, click here.
tradingview.com
MACD histogram Green ⇒ Bar is green.
MACD histogramRed ⇒ Bar is red.

Inverse MACD + DMI Scalping with Volatility Stop (By Coinrule)This script is focused on shorting during downtrends and utilises two strength based indicators to provide confluence that the start of a short-term downtrend has occurred - catching the opportunity as soon as possible.
This script can work well on coins you are planning to hodl for long-term and works especially well whilst using an automated bot that can execute your trades for you. It allows you to hedge your investment by allocating a % of your coins to trade with, whilst not risking your entire holding. This mitigates unrealised losses from hodling as it provides additional cash from the profits made. You can then choose to hodl this cash, or use it to reinvest when the market reaches attractive buying levels.
Alternatively, you can use this when trading contracts on futures markets where there is no need to already own the underlying asset prior to shorting it.
ENTRY
The trading system uses the Momentum Average Convergence Divergence (MACD) indicator and the Directional Movement Index (DMI) indicator to confirm when the best time is for selling. Combining these two indicators prevents trading during uptrends and reduces the likelihood of getting stuck in a market with low volatility.
The MACD is a trend following momentum indicator and provides identification of short-term trend direction. In this variation it utilises the 12-period as the fast and 26-period as the slow length EMAs, with signal smoothing set at 9.
The DMI indicates what way price is trending and compares prior lows and highs with two lines drawn between each - the positive directional movement line (+DI) and the negative directional movement line (-DI). The trend can be interpreted by comparing the two lines and what line is greater. When the negative DMI is greater than the positive DMI, there are more chances that the asset is trading in a sustained downtrend, and vice versa.
The system will enter trades when two conditions are met:
1) The MACD histogram turns bearish.
2) When the negative DMI is greater than the positive DMI.
EXIT
The strategy comes with a fixed take profit combined with a volatility stop, which acts as a trailing stop to adapt to the trend's strength. Depending on your long-term confidence in the asset, you can edit the fixed take profit to be more conservative or aggressive.
The position is closed when:
Take-Profit Exit: +8% price decrease from entry price.
OR
Stop-Loss Exit: Price crosses above the volatility stop.
In general, this approach suits medium to long term strategies. The backtesting for this strategy begins on 1 April 2022 to 18 July 2022 in order to demonstrate its results in a bear market. Back testing it further from the beginning of 2022 onwards further also produces good returns.
Pairs that produce very strong results include SOLUSDT on the 45m timeframe, MATICUSDT on the 2h timeframe, and AVAUSDT on the 1h timeframe. Generally, the back testing suggests that it works best on the 45m/1h timeframe across most pairs.
A trading fee of 0.1% is also taken into account and is aligned to the base fee applied on Binance.

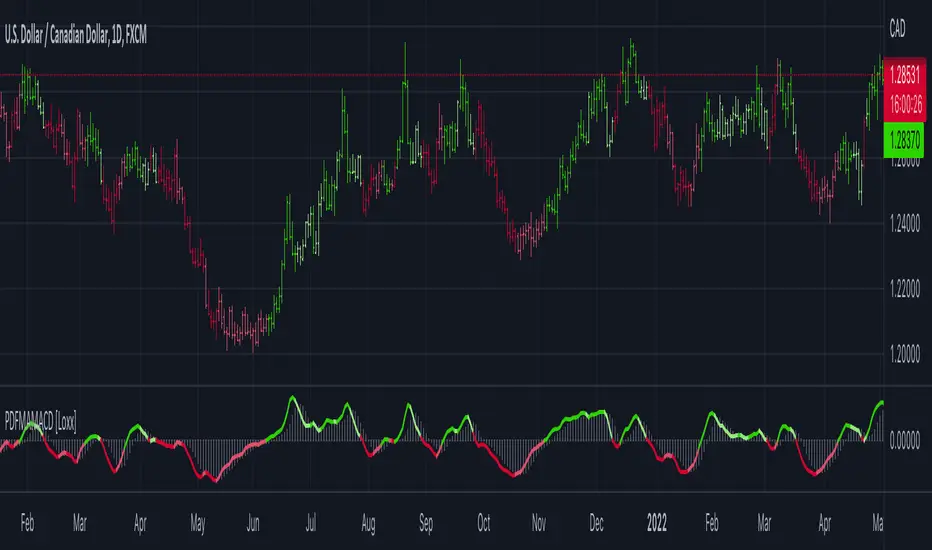
Probability Density Function based MA MACD [Loxx]Probability Density Function based MA MACD is a MACD indicator using a type of weighted moving average.
What is Probability Density Function based MA MACD?
Probability density function based MA is a sort of weighted moving average that uses probability density function to calculate the weights.
Included:
-Toggle on/off bar coloring
Disclosure of 'MACD-Total' indicator (MACD-T)hello?
Traders, welcome.
If you "follow", you can always get new information quickly.
Please also click "Like".
Have a good day.
-------------------------------------
A trend indicator has been added to the previously published MACD-Price indicator.
The added MS-Signal indicator is an indicator for viewing the trend and the strength of the trend.
Trading with a trend line is not easy.
Therefore, various MA lines or slanted lines drawn on the chart are used to see the flow of the chart.
Therefore, it is not recommended to trade with the added MS-Signal indicator as support and resistance points.
A trade requires support and resistance points.
To mark support and resistance points, you need a point or section on the horizontal line.
Therefore, it is necessary to utilize the 'Buy/Sell' indicator corresponding to the previously disclosed MACD-Price indicator.
(1W chart)
The long horizontal point of the 'Buy/Sell' indicator serves as support and resistance.
It is possible to check in which section the trend reversal has changed by displaying the MS-Signal indicator.
(1D chart)
A move has emerged to show a reversal of the trend by breaking above the MS-Signal indicator.
Therefore, the MS-Signal indicator is about to change from a downtrend to an uptrend.
I numbered the horizontal line of the 'Buy/Sell' indicator.
The length is different in the order of No. 2 > No. 1 > No. 3.
Since horizontal line 2 is the longest, it indicates that support and resistance play the greatest role.
If you check the support at the first horizontal point, it can be interpreted that there is a high possibility of receiving resistance at the second horizontal point.
However, if you find support at the 2nd horizontal point, you can see that it will go up significantly with 3rd position.
Trading with indicators allows you to make quick choices and decisions.
However, more important than the use of indicators is your own trading strategy.
in other words,
- How much investment will you proceed with the purchase?
- How to proceed with installment purchases
- At what point will the Stop Loss be done?
- How long will the investment period be?
- Is it a long-term investment or a short-term investment?
As listed above, the most important trading strategy for trading should be established.
When conducting a trade, ignoring the above list and thinking about where to buy and where to sell is like sailing in the dark.
We disclose the indicators in the hope that it will become a faster and more objective indicator for trading with the trading strategy you have established.
thank you
------------------------------------------------------------ -----------------------------------------------------

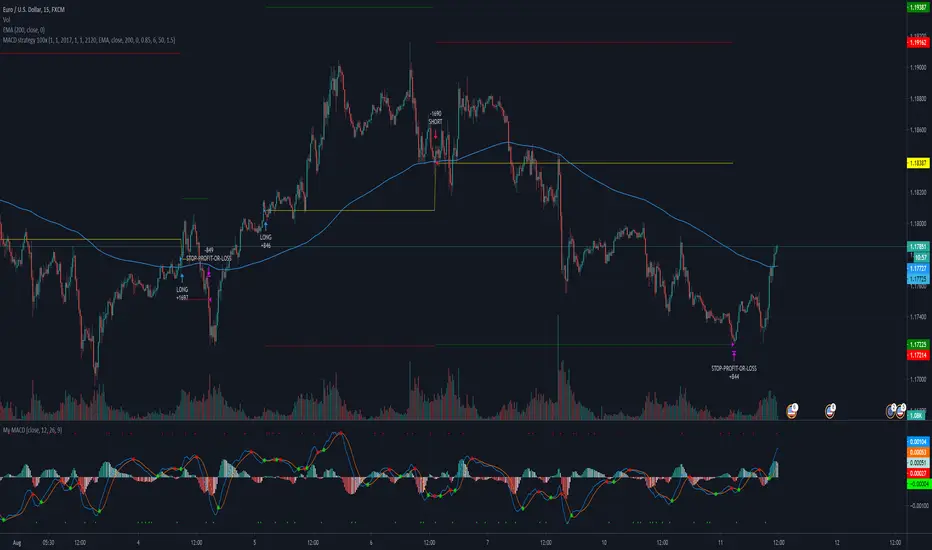
Scalp MACD highlighterThis indicator uses 3 indicators :
- 1Min timeFrame MACD
- EMA SHORT (default set to 50)
- EMA LONG (default set to 200)
Better to use this indicator with adding the 2 EMAs on the chart in complement
This indicator puts in lights the downtick and uptick which are higher / lower than the average or the Highest / Lowest histogram bar (depends on the settings you chose)
How to use it for longs :
1 - Use 5min timeframe
2 - Histogram is in red (means that EMA SHORT > EMA LONG and histogram is lower than average or lower than the lowest bar depending on the sttings you chose)
3 - Pull back of the price
How to use it for short :
1 - Use 5min timeframe
2 - Histogram is in green (means that EMA SHORT < EMA LONG and histogram is higher than average or higher than the highest bar depending on the sttings you chose)
3 - Pull back of the price
Why use this indicator ?
It's easier to read when you can enter a long (red down bar for longs by default) or short (green up bar by default) since the bars are colored on the MACD chart.
If it's not the good time to enter a trade, bars of the histogram will be colored in grey (by default)
I suggest not to change the following parameters :
- EMA lengths
- MACD lengths
Advice for Take profit : 0.5% and for stop Loss : 0.4%
Next steps for development : Change automatically the timeframe of the MACD

Hybrid, Zero lag, Adaptive cycle MACD Backtest (Simple) [Loxx]Simple backtest for Hybrid, Zero lag, Adaptive cycle MACD Backtest (Simple) found here:
What this backtest includes:
-Customization of inputs for MACD calculation
-Take profit 1 (TP1), and Stop-loss (SL), calculated using standard RMA-smoothed true range
-Activation of TP1 after entry candle closes
-Zero-cross entry signal plots
-MACD-Signal cross entry continuations
-Longs and shorts
Happy trading!

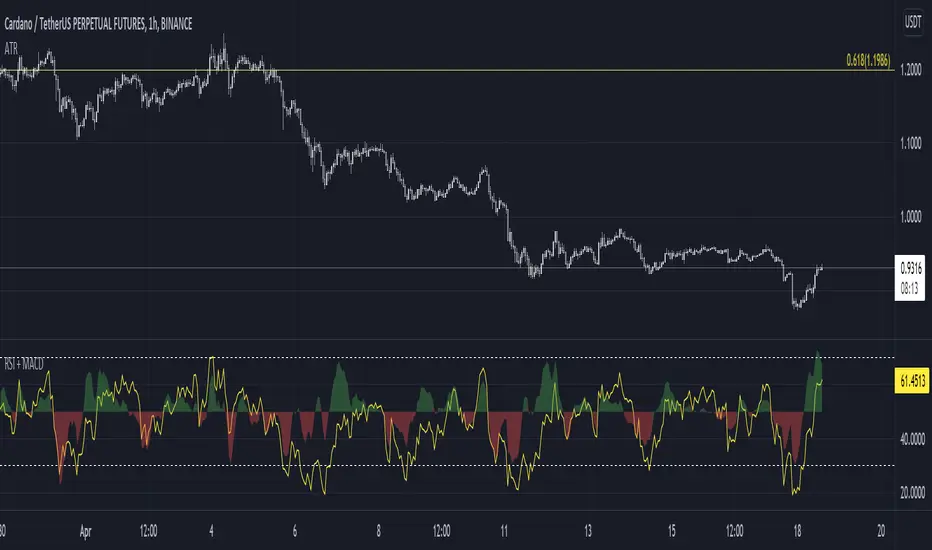
RSI + MACDRSI and MACD in one simplified indicator. Why? Because :
1. Save chart space, declutter, make decision making better, faster
2. MACD is not scaled to RSI range, now it is so you can have side by side comparison
Example how to use:
Enter on RSI oversold or overbought level, then exit on MACD crossover
See if there is an extra confluence to enter, hold or exit your trades, i.e oversold and falling macd is better than oversold and rising macd for short trades potentially.
Trend Following with Donchian Channels and MACDThis is a trend following system based on the Donchian Channels. Instead of using a simple moving average crossover, this system uses the MACD as the trendfilter:
Long positions:
* Price makes a new 50 day high,
* The MACD-line crosses above or is above the Signal-line.
* Both the MACD and the Signal-lines are above the zero-line.
Short positions:
* Price makes a new 50 day low,
* The MACD-line crosses below or is below the Signal-line.
* Both the MACD and the Signal-lines are below the zero-line.
Stoploss:
The initial and the trailing stoploss are 4 ATRs away from the price.

Crypto Scalper Divergence Macd Psar Ema 200This is a very efficient crypto scalper adapted to very short timeframes, however it can be optimized for other timeframes and assests as well.
Its components are
MACD
P SAR
EMA 200
Risk management
Rules for entry:
For short : we have an uptrend on PSAR , histogram is positive (divergence MACD) and close of a candle is below EMA 200
For long : we dont have an uptrend on PSAR, histogram is negative(divergence MACD) and close of a candle is above EMA 200
Rules for exit:
We exit when we either find a reverse condition than the entry one, or based on stop loss/take profit that are calculated on % movements of the price.
If you have any questions, let me know !

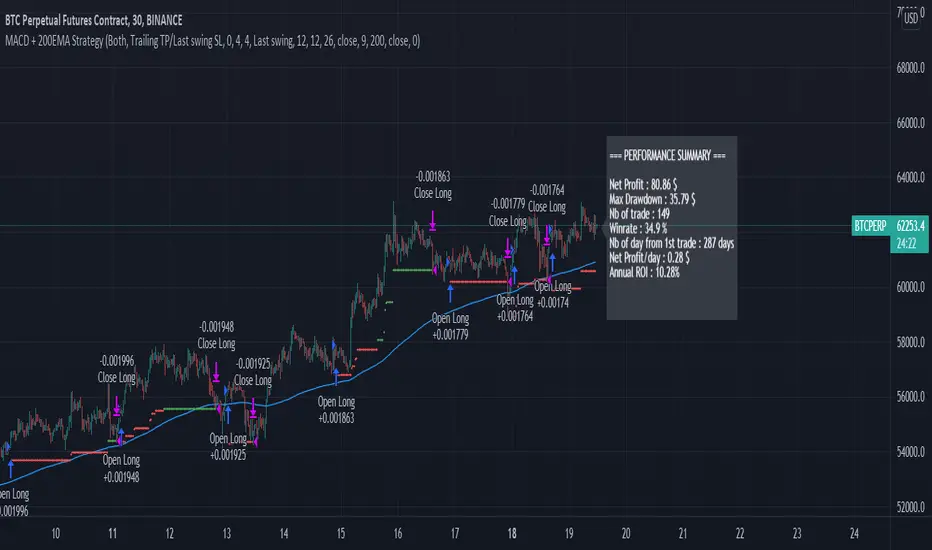
Simple MACD + 200EMA StrategyThis script is based on classic MACD / 200EMA strategy.
It takes a Long trade when MACD line crossup Signal line, when both below Zero line, and Close price above 200 EMA.
It takes a Short trade when MACD line crossdown Signal line, when both above Zero line, and Close price below 200 EMA
It seems to have decent results with 1:1.5 Risk/Reward, with 30min TF (on cryptocurrency market)
It has a number of 1 per day on average.
FEATURES
ORDERS
You can have both Long and Short, or disable one.
STOPLOSS
Stoploss is based on last swing (high or low). You can adjust the lookback period of the swing.
TAKE PROFIT
For now, there is 2 possibilities for TP :
Using adjustable Risk/Reward ratio (Trailing Stoploss need to be at 0)
Using adjustable Trailing Stoploss percentage (RR Ratio need to be at 0)
Results below are with this parameters :
Start date 01/01/2021
1:1.5 RR ratio
100USD Initial capital
100USD Order Size
0.01% Commission fees.
Rfactory: Ken Long MACD SeasonsRfactory has partnered with Dr Ken Long of Tortoise Capital Management to provide his MACD Seasons Indicator which is loaded into its own sub-graph. All settings are preconfigured to be the same as Dr Long uses out of the box and the plots include the MACD line colored by Season, the Signal line and the Red River. SSC (Spring Supported Crossing) Signals are specifically highlighted with large Dots on the MACD Line. Everything is customizable including not only coloring and line styles but also the underlying settings for lookbacks as well as a selector to use SMA's or EMA's for the calculations.
The MACD Seasons indicator helps identify where a market is in a seasonal cycle. In summer (green) the market is trending up and at an expanding pace. Once the season changes to Fall (blue) the market is still trending up but the pace has slowed. When the market moves into Winter (red) the trend has changed to down and at a quickening pace. In Spring (yellow) the trend is still down but the pace has slowed and we are looking ahead to get back to Summer.
The Red River volatility band is an indication of normal and helps identify in particular when a market is in a particularly harsh winter or summer.
The MACD Seasons works best with (and is an extension of) Dr Long's RLCO Framework.

MACD Crossover trend strategy, Long and ShortHey everybody,
This is my first strategy and script I wrote mostly myself. There's tons of content out there to learn how to code in Pinescript and it's exactly what I wanted and needed in this time of my life.
In any case, I made a rather simple MACD crossover strategy that only takes trades in the direction of both EMA and SMA (there are inputs to change the length of the moving averages and lots of other stuff too).
If the MACD line crosses upwards on the signal line, while above the zero point of the histogram and the price is above EMA + SMA , it's a long signal.
If the MACD line cosses downards on the signal line, while below zero on the histogram and the price is below EMA + SMA , it's a short signal.
There are a lot of default variables that make no sense, for basically any symbol you're going to be looking at. You're going to have to adjust the EMA , SMA , backtest date, take profit, stop loss and all that good stuff yourself to find decently profitable parameters.
I made this myself because I couldn't really find a strategy out there that allowed for so much customizing and it's an easy way to get started in Pinescript.
If you have any suggestions, tips or you see a flatout mistake in my code, please let me know. I'm still learning, everyday and I'm enjoying every second of it.

MACD + RSIThis MACD indicator is equipped with RSI strength signal.
Purple circles will display on 0 line when RSI is above 50%.
The MACD signal lines and RSI strength signal can be changed based on your own preference.
Preset value for MACD is 18, 16 & 11.
Preset value for RSI strength signal is 50%.
Alert for MACD Golden Cross and MACD Death Cross are also included.
Buy if MACD Golden Cross occurred and RSI strength signal appeared.
Sell if RSI strength signal disappeared.
Notes: This indicator is a secondary indicator. Therefore, you shouldn't used it solely for trading.

MACD Price Projected Bands [MPPB] Strategy for NIFTY / BTC 2 minMACD Price Projected Bands is an intraday NON REPAINTING Strategy to be used over BTCUSD and NIFTY on 2mins charts for optimum results!!
How the Strategy works
The strategy uses MACD with standard configuration as its main component.
The adaptive Bands are calculated over the MACD lookback, and MACD crosses of the adaptive bands are projected over the Price for creating a decision logic
A cyclic Trend Filter is used to calculate the Optimum Entry and Exit Points for the Strategy,
Levels are also plotted over the price projected bands for better visualisation of the targets!
What is used !
Macd_config : { fast:12 , slow:26 , signal:9 }
Lookback Length : 55
The Strategy has Provision for Alerts
You get Two signals
1. MPPBS Buy Signal
2. MPPBS Sell Signal
How the Visual Target System Works and How to trade Using this Strategy
An Adaptive Projected Band is constructed using MACD for traders to get Visual inputs regarding targets!!
The Trading Methodologies are in below Charts
For Short Trades
For Long Trades
Strategy Configurations for Backtest
For Englishmen!
The Backtesting Rules in the Strategy calculates only when order gets filled, the basic pyramiding in the strategy is set to 1, i.e The maximum number of entries allowed in the same direction is set to 1,
Also we trade only 1 quantity of the security with initial capital of 100000USD, and The commission type used in the strategy is set to 0.05 USD that means we pay 0.05USD as commissions in every trade!
For Coders!
{
calc_on_order_fills=true,
pyramiding=1,
default_qty_type=strategy.fixed,
default_qty_value=1,
initial_capital=100000,
currency=currency.USD,
commission_type= strategy.commission.cash_per_order,
commission_value = 0.05
}
How can you get access
Only do private message to me, donot use comment box for requesting access!

MACD Trend CandlesThe script combines 2 indicators (MACD and Stoch-RSI) and puts them visually directly on the candles - can be used with normal OHLC candles or Heiken Ashi candles. Furthermore, you can derive divergences exremely easy directly visually from the candles as well. Lastly, a SMA 20 high and a SMA 20 low line build a trend channel.
Script is best used in trending markets to trade with the trend.
1) SMA trend channel:
* uptrend: close above
* downtrend: close below
* aggressive entry (uptrend) closing inside channel from below
* conservative entry (uptrend) closing above channel from inside
* hold (uptrend) until close below channel
* can be used accordingly for the downtrend
2) MACD candles
* visualization of the MACD histogram directly on the candles
* dark blue: histogram > 0 and histogram > histogram of previous candle
* light blue: histogram > 0 and histogram < histogram of previous candle
* orange: histogram < 0 and histogram < histogram of previous candle
* light blue: histogram < 0 and histogram > histogram of previous candle
* hold uptrend (dark/light blue candles) - combined with trend channel (above channel)
* hold downtrend (orange /yellow candles) - combined with trend channel (below channel)
* Color divergence: light blue candle > dark blue candle (price and MACD show divergence (bearish)
* Color divergence: yellow candle < orange candle (price and MACD show divergence (bullish)
* Trend change (0 line cross to upside) yellow or orange to dark blue
* Trend change (0 line cross to downside) dark or light blue to orange
3) Stoch RSI diamonds
* visualization of the STOCH-RSI as diamonds above or below the candle
* k, d line > 80: diamond above the candle
* k, d line < 20: diamond below the candle
* divergence caldle without diamond above > candle with diamond above (bearish divergence)
* divergence caldle without diamond below < candle with diamond below (bullish divergence)
Feel free to test each part individually and combine it with other indicators, e.g. BBands and Ichimoku Cloud - you will see it is a powerful visualization script
HAVE FUN

NEW MACD RTA-V1.2NEW MACD RTA-V1.2 来自RTA学院,公开指标。
NEW MACD RTA-V1.2 中文名 新MACD 趋势力量指标
该指标结合双均线系统,配合传统MACD指标以及量能对趋势进行判断,仅限于数字货币市场。
在长期时间框架(日线级别)和中期时间框架(4H~12H级别)下表现可圈可点。在中场期时间框架具有一定的前瞻性。
该指标结合量能,所以只适用于有成交量的标的。
推荐标的:
Coinbase BTCUSD
Bitstamp BTCUSD
Binance BTCUSDT
Huobi BTCUSDT
Bitmex XBTUSD
Bybit BTCUSD
----------------------------------------------------
NEW MACD RTA-V1.2 comes from RTA Academy, public indicators.
This indicator combines the dual moving average system with the traditional MACD indicator to judge the trend. It is only used in the digital currency market.
It performs well in the long-term(Day) and medium-term(4H~12H) time frames.
This indicator is base on Vol, so it is only applicable to objects with Vol.
Recommended:
Coinbase BTCUSD
Bitstamp BTCUSD
Binance BTCUSDT
Huobi BTCUSDT
Bitmex XBTUSD
Bybit BTCUSD

Simple and efficient MACD crypto strategy with risk managementToday I am glad to bring you another great creation suited for crypto markets.
MARKET
Its a simple and efficient strategy, designed for crypto markets( btcusd , btcusdt and so on), and suited for for higher time charts : like 1hour, 4hours, 1 day and so on.
Preferably to use 1h time charts.
COMPONENTS
MACD with simple moving average
ENTRY DESCRIPTION
For entries we have :
We check the direction with MACD . Depending if its an uptrend and positive level on histogram of MACD we go long, otherwise we go short.
RISK MANAGEMENT
In this strategy we use a stop loss based on our equity. For this example I choosed a 2% risk .That means if our account has 100.000 eur, it will automatically close the trade if we lose 2.000.
We dont use a take profit level.
In this example also we use a 100.000 capital account, risking 5% on each trade, but since its underleveraged, we only use 5000 of that ammount on every trade. With leveraged it can be achieved better profits and of course at the same time we will encounter bigger losses.
The comission applied is 5$ and a slippage of 5 points aswell added.
For any questions or suggestions regarding the script , please let me know.

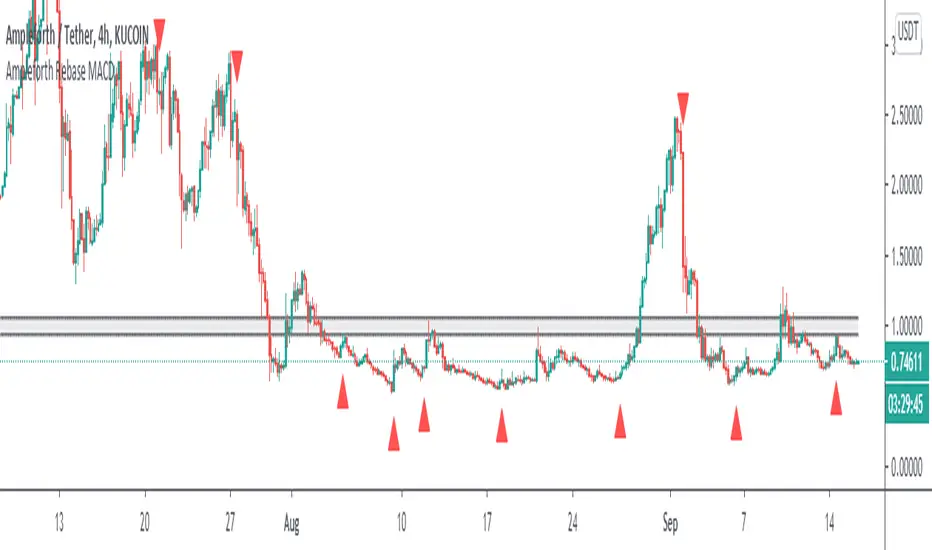
Ampleforth Rebase MACDThis script reveals Ampleforth rebase levels which are going to always work. In addition to that is MACD crossovers serving as potential buy/sell entries. You can set alerts for MACD crossovers and price entering balanced value area (0.96 - 1.06).
MACD signals can be used to automatically open a position and entering a balanced value area can be used as take-profit. Since the price will always move to this level, using this strategy without leverage should be profitable.
Ampleforth seems like a nice asset to trade since it is unlikely to correlate with anything else. At least not when it gets to the extreme levels.
MACD Strategy KMACK Rev 1.1Hull smoothed 45/10 macd
Please note that the macd/rsi values do not print unless the current day is Monday-Friday and the market will be open.
14 period hull smoothed rsi marks the rsi value at each macd reversal and will not signal a long position above 70 or a short position below 30
Macd and rsi will only display on the current day and will only display the last 2 hours
Lit candles occur after 0920 nyse time
Alerts or entries will only fire after 0931 nyse time
Entry signal will confirm with the 5 minute candle.
Long entry requires the current 5 minute candle to close>=hlc3
Short entry requires the current 5 minute candle to close<=hlc3
Buy/sell alerts will only fire in the last 10 seconds of the realtime (current) bar
Options:
Select bias
Modify macd lookback period(s)
Alerts:
Buy
Sell
Rsi crossing into the power region (60)
Rsi crossing into the weakness region (40)
Current strategy exits position upon signal opposite to selected bias, this is for simplicity.
There are currently no add-on strat signals but the alerts/lit candles will fire
Successful trades average >55% with an average profit factor of 3%
Net profit averages 3%
Max drawdown averages below 0.25%
Added order size input
Added show/hide strat signals. Still lights the bars green/red. Make sure your bar color setting in tv is set to a transparent color so you can see the bright reds and greens.
Added a couple lines of code that fire the alert/strat if macd reverses and the corresponding 5min candle does not agree and the following candle does agree. Added an average of 1.5% winning trades.
Message me for free trial access
MACD Crossover Trading Strategy tested 100xI have scripted recently seen youtube video MACD Crossover Trading Strategy tested 100x to see the actual results.
Strategy longs if:
- macd line crossover signal line above zero and price closes above baseline
Strategy shorts if:
- macd line crossunder singnal line below zero and price closes below baseline
As baseline is used ema(200)
As Stop-loss is used swing low/high calculated from last 50 candless or baseline value
As Take-profit is used stop-loss multiplied by RRR 1.5
Settings can be adjusted as you like