Perp Imbalance Zones • Pro (clean)USD Premium (perp vs spot) → (Perp − Spot) / Spot.
Imbalance (z-score of that premium) → how extreme the current premium is relative to its own history over lenPrem bars.
Hysteresis state machine → flips to a SHORT bias when perp-long pressure is extreme; flips to LONG bias when perp-short pressure is extreme. It exits only after the imbalance cools (prevents whipsaw).
Price stretch filter (±σ) → optional Bollinger check so signals only fire when price is already stretched.
HTF confirmation (optional) → require higher-timeframe imbalance to agree with the current-TF bias.
Gradient visuals → line + background tint deepen as |z| grows (more extreme pressure).
What you see on the pane
A single line (z):
Above 0 = perp richer than spot (perp longs pressing).
Below 0 = perp cheaper than spot (perp shorts pressing).
Guides: dotted levels at ±enterZ (entry) and ±exitZ (cool-off/exit).
Background tint:
Red when state = SHORT bias (perp longs heavy).
Blue when state = LONG bias (perp shorts heavy).
Tint intensity scales with |z| (via hotZ).
Labels (optional): prints when bias flips.
Alerts (optional): “Enter SHORT/LONG bias” and “Exit bias”.
How to use it (playbook)
Attach & set symbols
Put the script on your chart.
Set Spot symbol and Perp symbol to the venue you trade (e.g., BINANCE:BTCUSDT + BINANCE:BTCUSDTPERP).
Read the bias
SHORT bias (red background): perp longs over-extended. Look for short entries if price is at resistance, σ-stretched, or your PA system agrees.
LONG bias (blue background): perp shorts over-extended. Look for long entries at support/σ-stretched down.
Entries
Use the bias flip as a context/confirm. Combine with your structure trigger (OB/level sweep, rejection wick, micro-break in market structure, etc.).
If useSigma=true, only trade when price is already ≥ upper band (shorts) or ≤ lower band (longs).
Exits
Bias auto-exits when |z| falls below exitZ.
You can also take profits at your levels or when the line fades back toward 0 while price mean-reverts to the middle band.
Tuning (what each knob does)
enterZ / exitZ (signal strictness + hysteresis)
Higher enterZ → fewer, cleaner signals (e.g., 1.8–2.2).
exitZ should be lower than enterZ (e.g., 0.6–1.0) to prevent flicker.
lenPrem (context window for z)
Larger (50–100) = steadier baseline, fewer signals.
Smaller (20–30) = more reactive, more signals.
smoothLen (EMA on z)
2–3 = snappier; 5–7 = smoother/laggier but cleaner.
useSigma, bbLen, bbK (price-stretch filter)
On filters chop. Try bbLen=100, bbK=1.0–1.5.
Off if you want more frequent signals or you already gate with your own σ/Keltner.
useHTF, htfTF, htfZmin (trend/confirmation)
Turn on to require higher-TF imbalance agreement (e.g., trading 1H → confirm with 4H htfTF=240, htfZmin≈0.6–1.0).
hotZ (visual intensity)
Lower (2.0–2.5) heats up faster; higher (4.0) is more subtle.
Ready-made presets
Conservative swing (fewer, higher-conviction):
enterZ=2.0, exitZ=1.0, lenPrem=60–80, smoothLen=5, useSigma=true, bbK=1.5, useHTF=true (240/0.8).
Balanced intraday (default feel):
enterZ=1.6–1.8, exitZ=0.8–1.0, lenPrem=50, smoothLen=3–4, useSigma=true, bbK=1.0–1.25, useHTF=false/true depending on trendiness.
Aggressive scalping (more signals):
enterZ=1.2–1.4, exitZ=0.6–0.8, lenPrem=20–30, smoothLen=2–3, useSigma=false, useHTF=false.
Practical tips
Don’t trade the line in isolation. Use it to time trades into your levels: VWAP bands, Monday high/low, prior POC/VAH/VAL, order blocks, etc.
Perp-led reversals often snap—be ready to scale out quickly back to mid-bands.
Venue matters. Keep spot & perp from the same exchange family to avoid cross-venue quirks.
Alerts: enable after you’ve tuned thresholds for your timeframe so you only get high-quality pings.
Wyszukaj w skryptach "imbalance"

Volume Imbalance Heatmap + Delta Cluster [@darshakssc]🔥 Volume Imbalance Heatmap + Delta Cluster
Created by: @darshakssc
This indicator is designed to visually reveal institutional pressure zones using a combination of:
🔺 Delta Cluster Detection: Highlights candles with strong body ratios and volume spikes, helping identify aggressive buying or selling activity.
🌡️ Real-Time Heatmap Overlay: Background color dynamically adjusts based on volume imbalance relative to its moving average.
🧠 Adaptive Dashboard: Displays live insights into current market imbalance and directional flow (Buy/Sell clusters).
📈 How It Works:
A candle is marked as a Buy Cluster if it closes bullish, has a strong body, and exhibits a volume spike above average.
A Sell Cluster triggers under the inverse conditions.
The heatmap shades the chart background to reflect areas of high or low imbalance using a color gradient.
⚙️ Inputs You Can Adjust:
Volume MA Length
Minimum Body Ratio
Imbalance Multiplier Sensitivity
Dashboard Location
🚫 Note: This is not a buy/sell signal tool, but a visual aid to support institutional flow tracking and confluence with your existing system.
For educational use only. Not financial advice.

Short Term Imbalance ContinuationShort Term Imbalance Continuation
This indicator identifies short-term trading opportunities based on imbalance situations followed by consolidation.
Functionality:
The indicator looks for a specific candle formation:
1. An imbalance candle where the low is above the high of the following candle (bearish) or the high is below the low of the following candle (bullish)
2. Followed by 1-2 inside candles (close within the range of the previous candle) in the same direction
Theory:
The formation is based on two important market mechanisms:
1. Imbalance and Momentum:
- The imbalance shows a strong move with one-sided orderflow dominance
- Inside candles in the same direction confirm that the opposing side cannot take control
2. Consolidation Behavior:
- Inside candles are a classic consolidation pattern
- They show that the market is "digesting" the previous strong movement
- Consolidation within the range indicates controlled accumulation/distribution
- Particularly relevant when large market participants are building or expanding positions
- Consolidation at higher/lower levels confirms the dominance of the trend direction
Settings:
- Choice between one or two inside candles for different consolidation phases
- Option whether both inside candles must have the same direction
- Customizable colors for bullish and bearish signals
Application:
The indicator is particularly suitable for:
- Trend confirmation after strong movements
- Entry into pullbacks during trends
- Identification of continuation setups after consolidations
- Detection of accumulation/distribution phases of large market participants
Notes:
- Best used in combination with higher timeframe trend
- Particularly meaningful at important price zones
- Consolidation phases can indicate institutional interest
- The length of consolidation (one vs. two inside candles) can indicate different accumulation phases

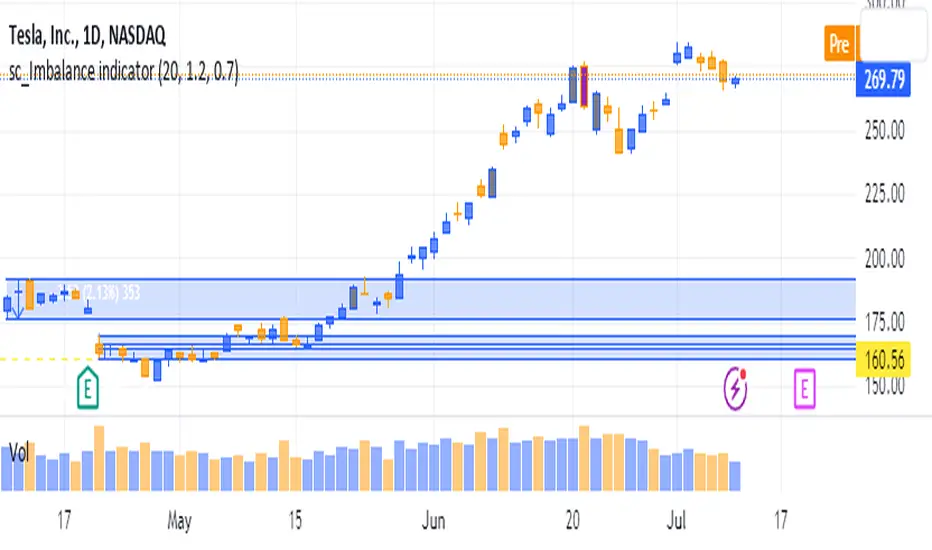
sc_Imbalance indicatorThe script helps to identify imbalance trade candles on the chart.
Prices after a rip-up candle (color in gray, default) will often see subsequent prices backfilling the rip-up candle ie. prices after the rip-up imbalance will fall back down. The opposite is true for flush-down candles (color in purple, default). This indicator allows a quick seeing of which imbalance candle that not been backfilled yet and present opportunities in trading the stock with potential target price based on the imbalance candle.
FVG Reversal Sentinel🔵 FVG Reversal Sentinel – Multi-Timeframe Fair Value Gap Indicator
The FVG Reversal Sentinel is a powerful TradingView indicator designed to help traders identify and track Fair Value Gaps (FVGs) across multiple timeframes, all within a single chart.
This tool allows you to select up to five separate timeframes, ensuring you never miss key market shifts, whether you are scalping, day trading, or swing trading. You can use this indicator in any asset (Cryptos, Futures, Indices, Forex Pairs, etc.).
🔵 - Key Features -
Multi-Timeframe FVG Tracking – Select and display up to five different timeframes on one chart, providing a comprehensive view of market structure.
Customizable Colors – Adjust bullish and bearish FVG colors to match your chart theme for a seamless trading experience.
Enhanced Market Context – Quickly identify key liquidity zones and refine your entries and exits with precision.
Hide the lower timeframes FVGs to get a clear view in a custom timeframe.
Show or hide mitigated FVGs to declutter the chart.
FVGs boxes are going to be displayed only when the candle bar closes
FVGs are going to be mitigated only when the body of the candle closes above or below the FVG area.
No repainting
Whether you're looking to fine-tune your entries or gain a broader market perspective, the FVG Reversal Sentinel indicator ensures you have the tools to stay ahead of price action and capitalize on market inefficiencies.
🔵 - Customization-
You can change the indicator settings as you see fit to achieve the best results for your use case.
TIMEFRAMES
This indicator provides the ability to select up to 5 timeframes. These timeframes are based on the trader's timeframes including any custom timeframes.
Select the desired timeframe from the options list.
Add the label text you would like to show for the selected timeframe.
Check or uncheck the box to display or hide the timeframe from your chart.
FVG SETTINGS
Length of boxes: allows you to select the length of the box that is going to be displayed for the FVGs.
Delete boxes after fill?: allows you to show or hide mitigated FVGs on your chart.
Hide FVGs lower than enabled timeframes?: allows you to show or hide lower timeframe FVGs on your chart. Example - You are in a 15 minutes timeframe chart, if you choose to hide lower timeframe FVGs you will not be able to see 5 minutes FVG defined in your Timeframes Settings, only 15 minutes or higher timeframe FVGs will be displayed on your chart.
BOX VISUALS
Bullish FVG box color: the color and opacity of the box for the bullish FVGs.
Bearish FVG box color: the color and opacity of the box for the bearish FVGs.
LABELS VISUALS
Bullish FVG labels color: the color for bullish labels.
Bearish FVG labels color: the color for bearish labels.
Labels size: the size of the text displayed in the labels.
Labels position: the position of the label inside the FVGs boxes (right, left or center).
BORDER VISUALS
Border width: the width of the border (the thickness).
Bullish FVG border color: the color and the opacity of the bullish box border.
Bearish FVG border color: the color and the opacity of the bearish box border.
🔵 - How to use the indicator -
Just add the indicator in your chart and click in the settings option to customize it.
Make sure you select the desired timeframes and set the colors and opacity for the FVGs boxes.
This indicator can be used in many trading strategies, such as:
SILVER BULLET
iFVG
iFVG RETEST
These strategies are based on the use of FVGs, this tool can help you analyze the market and make the right decision.
🔵 - How was the indicator designed? -
I have spent a lot of time testing other open source indicators from the community. All of these indicators do a great job, but they have a problem, they not only mitigate FVGs when a candle closes above or below the FVG, they also mitigate FVGs when the candle closes exactly to the tick (not above or below the FVG). This is a problem for many strategies that rely on FVGs mitigation.
What makes this indicator different is that it focuses on just mitigating imbalances at the right time for these strategies.
I have taken ideas and some pieces of code from many community indicator developers, such as:
@twingall
@tflab
@marktools
@nacho-fx
@pmk07
... and many other people, to whom I thank for their valuable work and have allowed me to create this tool by making modifications to their source code.
🔵 - Disclaimer -
This tool is intended solely for informational and educational purposes and should not be regarded as financial, investment, or trading advice. It's not designed to predict market movements or offer specific recommendations. Users should be aware that past performance is not indicative of future results and should not rely on any indicator for financial decisions.

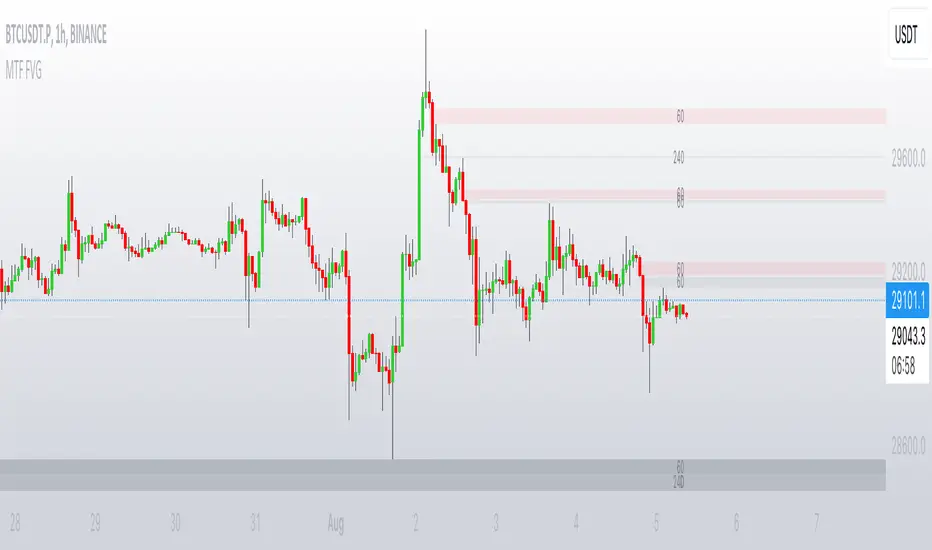
MTF FVGThis script finds Imbalance (Fair Value Gap (FVG)) on multi timeframes.
If needed all TF can be used at once: 1, 3, 5, 15, 30, 45, 60, 120, 180, 240, D, W.
It finds FVG on any desired TF that is greater or equal than TF on the chart.
FVG stands for fair value gap, which is a three-candle structure that indicates an imbalance or inefficiency in the market. An imbalance means that the buying and selling is not equal, and there is a gap between the fair value and the market value of an asset. A bullish FVG shows that the market value is lower than the fair value, and a bearish FVG shows the opposite.
FVG takes place in a series of 3 candles when the middle candle gaps up or down. This signals strong buying or selling pressure in the direction of the gap. When a gap occurs the wicks of the candles do not overlap each other.
POI Zones with Imbalance- Ahmed AwadHighlights Point of Interest (POI) zones on the chart where a significant price imbalance occurs between the candle’s open and close. The indicator draws semi-transparent orange zones to mark potential buy or sell areas, helping traders spot strong price moves and key levels. Adjustable imbalance threshold and transparency for flexibility.

Liquidity Levels/Voids (VP) [LuxAlgo]The Liquidity Levels/Voids (VP) is a script designed to detect liquidity voids & levels by measuring traded volume at all price levels on the market between two swing points and highlighting the distribution of the liquidity voids & levels at specific price levels.
🔶 USAGE
Liquidity is a fundamental market force that shapes the trajectory of assets.
The creation of a liquidity level comes as a result of an initial imbalance of supply/demand, which forms what we know as a swing high or swing low. As more players take positions in the market, these are levels that market participants will use as a historical reference to place their stops. When the levels are then re-tested, a decision will be made. The binary outcome here can be a breakout of the level or a reversal back to the mean.
Liquidity voids are sudden price changes that occur in the market when the price jumps from one level to another with little trading activity (low volume), creating an imbalance in price. The price tends to fill or retest the liquidity voids area, and traders understand at which price level institutional players have been active.
Liquidity voids are a valuable concept in trading, as they provide insights about where many orders were injected, creating this inefficiency in the market. The price tends to restore the balance.
🔶 SETTINGS
The script takes into account user-defined parameters and detects the liquidity voids based on them, where detailed usage for each user-defined input parameter in indicator settings is provided with the related input's tooltip.
🔹 Liquidity Levels / Voids
Liquidity Levels/Voids: Color customization option for Unfilled Liquidity Levels/Voids.
Detection Length: Lookback period used for the calculation of Swing Levels.
Threshold %: Threshold used for the calculation of the Liquidity Levels & Voids.
Sensitivity: Adjusts the number of levels between two swing points, as a result, the height of a level is determined, and then based on the above-given threshold the level is checked if it matches the liquidity level/void conditions.
Filled Liquidity Levels/Voids: Toggles the visibility of the Filled Liquidity Levels/Voids and color customization option for Filled Liquidity Levels/Voids.
🔹 Other Features
Swing Highs/Lows: Toggles the visibility of the Swing Levels, where tooltips present statistical information, such as price, price change, and cumulative volume between the two swing levels detected based on the detection length specified above, Coloring options to customize swing low and swing high label colors, and Size option to adjust the size of the labels.
🔹 Display Options
Mode: Controls the lookback length of detection and visualization.
# Bars: Lookback length customization, in case Mode is set to Present.
🔶 RELATED SCRIPTS
Liquidity-Voids-FVG
Buyside-Sellside-Liquidity
Swing-Volume-Profiles

FVG Sessions [LuxAlgo]The FVG Sessions indicator highlights the first fair value gap of the trading session as well as the session range. Detected fair value gaps extend to the end of the trading session.
Alerts are included on the formation of a session fair value gap, price being within a session fair value gap, mitigations, and price crossing session fair value gaps average.
🔶 USAGE
Trader ICT states that the first fair value gap of the trading session can attract the most significant reaction. Having only one FVG per session allows users to further focus on that precise imbalance as well as external elements.
The mitigation of a fair value gap is clearly indicated on the chart with a more transparent color allowing users to see inverse FVGs.
Extending the fair value gaps allows the imbalance area to provide potential support and resistance.
Do note that this script should be used on intraday charts.
🔶 ALERTS
The script includes the following alerts:
🔹 Bullish/Bearish FVG
Alerts on the formation of the first bullish or bearish FVG of the session.
🔹 Bullish/Bearish FVG Mitigation
Alerts when the first bullish or bearish FVG of the session is mitigated.
🔹 Price Within FVG
Alerts when price is within the first bullish or bearish FVG area of the session.
🔹 Price Cross FVG Average
Alerts when price cross the average level of the first bullish or bearish FVG of the session.

NX - ICT PD ArraysThis Pine Script indicator identifies and visualizes Fair Value Gaps (FVGs) and Order Blocks (OBs) based on refined price action logic.
FVGs are highlighted when price leaves an imbalance between candles, while Order Blocks are detected using ICT methodology—marking the last opposing candle before a displacement move.
The script dynamically tracks and updates these zones, halting box extension once price interacts with them. Customizable colors and lookback settings allow traders to tailor the display to their strategy.

Tape Pressure Proxy — Signals (CVD + Imbalance + VWAP/EMA) v1.1Tape reading: The stack approximates aggressor flow using CVD (cumulative signed volume) and a Z-score “imbalance” of that signed volume. This captures speed/side bias you’d look for on the tape.

FVG Detector [TradingFinder] Fair Value Gap-Imbalance-Mitigated🔵 Introduction
When the market makes a strong move in the form of a "Marubozu" or "Spike" candlestick and consecutive candles move without a retracement, the maximum place where a "FVG" or "Fair Value Gap" is created.
🔵 Definition
To describe this precisely, whenever a move occurs where the current candle does not cover the body of the previous and subsequent candles, a fair value gap is created.
Important : The significant point is that, because there is no equilibrium between buyers and sellers in these conditions, and market power is in the hands of buyers or sellers, the market is likely to move towards these areas.
An example of "FVG" in a price increase where we expect buying on the return to it.
An example of "FVG" in a downward trend where the market will move towards it in a downward direction.
🔵 How to Use
🟣 Bearish FVG
In a downward trend, "orange boxes" are drawn, which are the same and can act as "support" zones along the downward path, and we expect the price to continue its downward trend on return.
🟣 Bullish FVG
In an upward trend, "green boxes" are drawn, which are . They act exactly like support in the upward path, and we expect the price to continue its upward trend on return.
🟣 Auxiliary Definitions
Imbalance : As mentioned above, market power is in the hands of one of the two sides, buyers or sellers, and a non-equilibrium zone is created. It may be completed in whole or in part in subsequent price movements.
Mitigated : If the price returns to the "FVG" area and fills it, we call it "Mitigated," and most "pending" or "profit and loss limits" positions are executed. We will not have a specific reaction on the return of the price.
🔵 Settings
Very Aggressive : In addition to the initial condition, another condition is added. For an upward FVG, the maximum price of the last candle should be larger than the middle candle's maximum price. Similarly, for a downward FVG, the minimum price of the last candle should be smaller than the middle candle's minimum price. In this mode, a very small number of FVGs are eliminated.
Aggressive : In addition to the conditions of the Very Aggressive mode, in this mode, the size of the middle candle should not be small. In this mode, a larger number of FVGs are eliminated.
Defensive : In addition to the conditions of the Very Aggressive mode, in this mode, the size of the middle candle should be relatively large, and the majority of it should be made up of the body. Additionally, to identify upward FVGs, the second and third candles must be positive, and to identify downward FVGs, the second and third candles must be negative. In this mode, a large number of FVGs are eliminated, leaving only those with suitable quality.
Very Defensive : In addition to the conditions of the Defensive mode, the first and third candles should not be very small-bodied doji candles. In this mode, the majority of FVGs are filtered out, leaving only the highest quality ones.
🔵 Features
Show Demand FVG : Displays demand-related boxes, which can be "off" and "on."
Show Supply FVG : Displays supply-related boxes along the path, and can be turned "off" and "on."
🔵 Indicator Advantages
In this indicator, I have implemented 4 types of "filters" that allow you to select one based on the trading symbol, timeframe, etc. From "Very Aggressive" to "Very Defensive" mode, it is possible to select.
In most indicators, all FVGs are displayed, and the chart becomes full of lines. But this unique feature allows the trader to manage the drawing of boxes.

Three Bar Gap (Simple Price Action - with 1 line plot)This script is tailored towards experienced traders who prefer to view raw price charts during live execution. It searches for a three-bar pattern of what is colloquially called "fair value gap", or "imbalance" and uses a single line to plot the results. The goal is to display price in a way that is as simple as possible so that chart readers who don't prefer to add indicators on their screen will still find this indicator as an acceptable option to consider for.
From a code perspective, this script explores a new PineScript feature called UDT (user-defined types). This is an incredible update because it brings developers one step close to having the ability to create abstract data types.
█ What is price action?
Experienced traders will tell you that the chart that they use for live execution is raw, clean, and uses no indicators. They say they execute on price action, so what exactly is price action?
There is no formal definition to it, but one can agree that it implies the process of analyzing price without considering the fundamentals, without needing to know what the news was about, and without needing to know any of the Greeks (except for the desire to “seek alpha” Ha.haa...). This is not to say that price action traders are executing in their own vacuums without the need to know what is happening around the world. Surely fundamentals and financial models can be used beforehand for developing a bias for what is being traded, but it’s price-first at the moment of execution. That said, Factor (A) is Price.
Factor (B) is time-perception, it’s how the trader reads the tape. How the trader perceives price to change with respect to time is valuable information. Interpretation of "time" will be elaborated in the next section that talks about candlestick patterns detected by this script.
Putting this together, price action means the analysis of price movement by only considering (A) price, and (B) time, to predict which direction the market will move. A speculative trader is timing the market with the expectation to make a quick in-and-out profit; she/she is using price action. On the other hand, a long term investor holding a diversified portfolio with a strategy based on modern portfolio theory combined with fundamental analysis (at this point candlesticks are irrelevant) but has one additional criteria of, say, can only go Long on a stock when it has closed Green on Daily; he/she is also considered to be executing on price action.
█ Candlestick patterns
This script calculates the displacement of highs and lows over three consecutive bars.
A) Down move = When High of the recent confirmed bar is lower than the Low of the previous-previous candle
B) Up move = When Low of the recent confirmed bar is higher than the High of the previous-previous candle
(Note that its the confirmed bar that is being talked about, so it does not repaint)
An ATR filter will be applied to reduce the number of lines generated as many times they might just be associated with minor price changes.
Interpretations:
When price moves quickly across three bars, it can be thought that it has gapped. Although the candle in the middle appears to be solid, it’s not from a conceptual perspective. This is because time itself is arbitrary; timeframes don’t necessarily have to be fixed intervals. Take stocks with regular trading hours for example, if price makes a breakaway gap and you bundle the after-hours and pre-market sessions together as one candle, never minding that intervals should be fixed, then you will see the exact three-bar-gap patterns. Similar happens during intraday sessions on lower timeframes, if you zoom-in closer, you’ll see that ticks within the middle candle are sparsely dispersed. This is why it's called a gap.
█ Parameters with fixed inputs & assumptions used:
ATR is used for filtering out minor movements that will likely be deemed as irrelevant by trader for the purpose of live execution. The following inputs are required:
A) ATR lookback period
B) Multiplier
The product of ATR(len=A) and B produces a threshold for minimum distance that price must gap by. Initially, it was proposed to be only based on one ATR, but often an ATR is too wide and using it will filter out too many lines. Because of this observation, a multiplier (Parameter B) has been introduced to allow users to apply fractional ATR as a threshold.
█ Applications:
For trend followers: Follow the direction of the gap. Entering above recent high/low points above/below the first impulse with a stop-limit order is a viable tactic.
For contrarians fading a trend: The mid-point is a good point of reference for predicting potential areas of support/resistance.

Mark FVGsMark FVGs is marking FVG (stands for Fair Value Gap, other name is Imbalance or IMB) on your chart so that you can instantly detect them
It supports:
- marking bullish and bearish partly filled or unfilled FVGs of the current timeframe
- marking bullish and bearish already filled FVGs of the current timeframe
- marking bullish and bearish FVGs of the any 4 timeframes on your current timeframe
technically it re-builds them on the last bar or as soon as new realtime bar is updated. it looks with 1k bars back to find the nearest specific number of FGVs
Adjustments:
- changing the maximum number of FVGs to display.
- changing the color of FVG area
- displaying already filled FVG of the current time frame
- changing the mode of displaying area it can either extended or fixed width
- displaying labels of other time frame FVGs

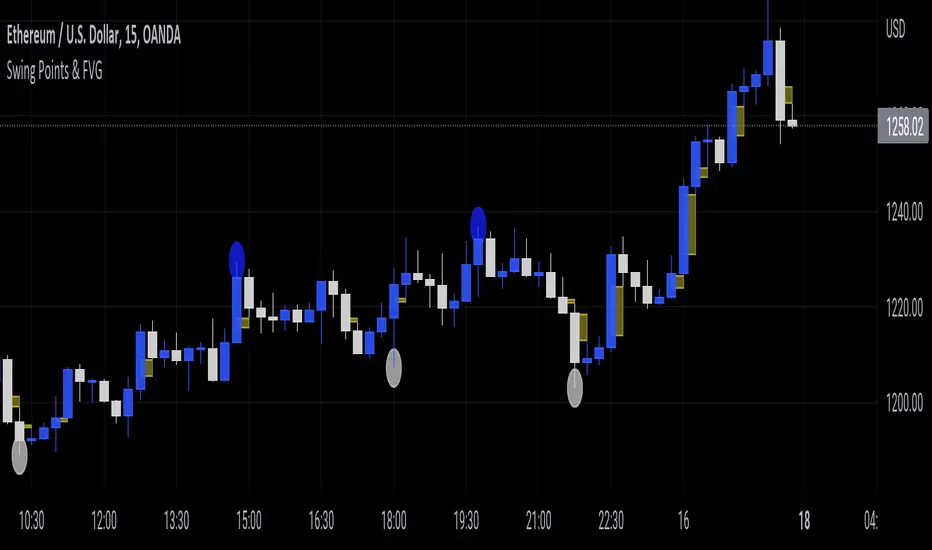
Swing Points & FVGClassic ITH/ITL
Intermediate Term High - High that has short term high on either of it's side.
Intermediate Term Low - Low that has short term low on either of it's side.
FVG
The indicator also marks Fair Value Gaps which is a very important concept in price action trading. FVGs are formed when there is ineffeciency,or imbalance, in the market.
Rebalanced ITH/ITL
Rebalanced ITH - A short term high that rebalanced the ineffeciency in price can be considered as an Intermediate Term High.
Rebalanced ITL - A short term low that rebalanced the ineffeciency in price can be considered as an Intermediate Term Low.
Use the ITH and ITL points marked by the indicator to determine the structure of the market.
Indicator repaints only when it tries to identify the latest ITH/ITL.
Candle ImbalanceIndicator that shows the imbalance between bearish and bullish candles for a given period.

Imb finderThe indicator finds imbalance's zone
Support:
- Two dynamic color
- Hides fulfiled blocks
- Extends last active imabalance's zone

HTF FVG and Wick Fill trackingImbalances in the charts are some of the clearest and most traded price areas. Two of the best and most used are fair value gaps FVGs and large candle wicks. In both of these price appears to move in such a way that most are left behind having 'missed' the move. But in reality price will often come back to these price points to re-balance and absorb the liquidity that was left behind.
This indicator takes these areas and makes viewing and tracking them clearer than ever. It does this, by first allowing the user to overlay a higher timeframe candle on the current chart. This in itself provides an in depth look at a higher timeframe candle both as it forms and in its final form.
Next the indicator identifies either the FVG or large wicks, on the chosen higher timeframe, all while the chart remains on a lower timeframe. As seen here the fair value gaps are clearly highlighted, taken from a 4 hour timeframe, while the actual chart is on 15 minutes. This allows the user even greater accuracy in identifying their key trading areas.
Utilizing the indicators unique feature, these areas can optionally be extended forward to the current timeframe and 'filled' in realtime. Areas that are filled to the users defined level, will be removed from the chart.
With supplementary settings for how much history to show, how large of a wick should be highlighted and complete control over the colour scheme, users will be able to track and understand the filling of imbalances like never before.

Clock&Flow: Elements of Cycle Analysis 2nd partClock&Flow – Elements of Cycle Analysis (ECA) | Complete Suite
Elements of Cycle Analysis (ECA) is an advanced cyclic analysis suite designed to interpret the market through time, structure, strength, and energy, combining cycles, volatility, and participation into a single operational framework.
The suite consists of two complementary modules:
🔹ECA 1 – Cycles, Structure, and Volatility (Overlay: True)
ECA 1 is dedicated to the structural and temporal analysis of the market.
Cyclic SMAs (Cyclic Ratio) Moving averages are calibrated according to nominal cycles and timeframes to monitor multiple cycles simultaneously (from the lower cycle to the upper cycles). Crossovers between fast and slow SMAs certify the closing or transition of the cycle related to the faster SMA. The specific cycle is identified in the Info Table at the bottom right (for 15m - 1h - 2h - 1D timeframes). You can select the number of cycles to observe and the asset type to apply them to:
Index: Standard quotes (e.g., Cash sessions).
Future: Extended quotes (24h).
50-200: Classic institutional references for the medium-long term.
ATR-based Dynamic Cyclic Channels The channels represent a lower cycle and its upper counterpart; their width is determined by the observed timeframe and calculated based on average volatility (ATR). Volatility is not treated as noise but as a structural component of the cycle, essential for contextualizing excesses, compressions, and expansions.
Info Table and Quick Guide Dynamic tables automatically link SMAs, timeframes, and time cycles, providing an immediate reading of the current cyclic context.
Time Bands (Weekly / Daily) Temporal visualization helps identify cyclic pivots and rhythm transitions.
🔹 ECA 2 – Market Excesses, Strength, and Energy
ECA 2 analyzes how the market moves within the cyclic structure.
Excesses and Divergences (Cyclic Stochastic) An oscillator calibrated on the same cyclic ratio as the suite. Crossovers between the lower cycle (blue) and upper cycle (red) signal potential phase changes. In areas of excess, divergences often confirm the closing and restart of a cycle.
Directional Movement System (DMS) The ADX measures the strength of the movement, while +DI and -DI indicate direction. A simultaneous crossover of ADX, +DI, and -DI signals imminent acceleration, even before the strength is fully expressed.
Market Pulse – Real Market Energy The Market Pulse measures the amount of real energy moving through the market by relating three factors:
Price Velocity
Normalized Volume
Volatility (ATR relative to price)
These three factors are combined multiplicatively: if one is missing, the impulse weakens. The zero line represents a state of energy equilibrium; values above or below indicate a real imbalance (bullish or bearish). Note: Market Pulse is not a classic oscillator and should not be interpreted as overbought or oversold; it is used to evaluate the energetic quality of a movement.
Operational Convergence
The maximum operational effectiveness of the ECA suite is achieved when all modules converge on the same market phase.
When cyclic timing, volatility, price structure, trend strength, and movement energy align, the context signals a high-probability operational phase. The system is applicable to any timeframe or asset because it is not bound by dogmatic or subjective interpretations of technical or fundamental analysis; instead, it leverages what is actually happening in the market. Major chart patterns and Volume Profile (technically not includable in this specific suite) provide further confirmation.
Under these conditions, the signal does not originate from a single indicator but from the consistency of the entire system: time, volatility, and energy moving in the same direction.
Entries should always be accompanied by proper risk management.
––––––––––––––––––––––––––––––––––––––––––––––––––––––––––––––––––––––––
Clock&Flow – Elements of Cycle Analysis (ECA) | Suite Completa
Elements of Cycle Analysis (ECA) è una suite avanzata di analisi ciclica progettata per leggere il mercato attraverso tempo, struttura, forza ed energia, combinando cicli, volatilità e partecipazione in un unico framework operativo.
La suite è composta da due moduli complementari:
🔹 ECA 1 – Cicli, Struttura e Volatilità (overlay true)
ECA 1 è dedicato all’analisi strutturale e temporale del mercato.
SMA cicliche (ratio ciclica)
Le medie mobili sono calibrate in funzione dei cicli nominali e del timeframe per monitorare più cicli simultaneamente (dal ciclo inferiore fino ai cicli superiori).
Gli incroci tra SMA veloci e lente certificano la chiusura o transizione del ciclo correlato alla SMA più veloce. Il ciclo in questione è segnalato nella info table in basso a destra (per i time frame 15’ - 1h - 2h - 1D) Puoi selezionare il numero dei cicli da osservare e su quali asset applicarle (Index = quotazioni standard / Future = quotazioni estese / 50-200 i classici riferimenti istituzionali per il medio-lungo periodo
Canali ciclici dinamici basati su ATR
I canali rappresentano un ciclo inferiore e il suo superiore, l’ampiezza è data dal time frame osservato e calcolata sulla volatilità media (ATR).
La volatilità non è trattata come rumore, ma come componente strutturale del ciclo, utile per contestualizzare eccessi, compressioni ed espansioni.
Info Table e Quick Guide
Tabelle dinamiche collegano automaticamente SMA, timeframe e cicli temporali, fornendo una lettura immediata del contesto ciclico in corso.
Time Bands (Weekly / Daily)
La visualizzazione temporale aiuta a individuare pivot ciclici e transizioni di ritmo.
––––––––––––––––––––––––––––––––––––––––––––––––––––––––––––––––––––––
🔹 ECA 2 – Eccessi, Forza ed Energia del Mercato
ECA 2 analizza come il mercato si muove all’interno della struttura ciclica.
Eccessi e divergenze (Stochastic ciclico)
Oscillatore calibrato sulla stessa ratio ciclica della suite.
Gli incroci tra ciclo inferiore (blu) e superiore (rosso) segnalano potenziali cambi di fase; in area di eccesso, le divergenze certificano spesso la chiusura e ripartenza del ciclo.
Directional Movement System (DMS)
L’ADX misura la forza del movimento, mentre +DI e –DI ne indicano la direzione.
L’incrocio simultaneo di ADX, +DI e –DI segnala un’accelerazione imminente, anche in assenza di forza già espressa.
Market Pulse – Energia reale del mercato
Il Market Pulse misura quanta energia reale sta attraversando il mercato mettendo in relazione:
velocità del prezzo
volume normalizzato
volatilità (ATR rapportato al prezzo)
I tre fattori sono combinati in modo moltiplicativo: se uno manca, l’impulso si indebolisce.
La linea dello zero rappresenta una condizione di equilibrio energetico; valori sopra o sotto indicano uno sbilanciamento reale, rialzista o ribassista.
Il Market Pulse non è un oscillatore classico e non va interpretato in termini di ipercomprato o ipervenduto: serve a valutare la qualità energetica del movimento.
La massima efficacia operativa della suite ECA si ottiene quando tutti i moduli convergono sulla stessa fase di mercato.
Quando tempi ciclici, volatilità, struttura del prezzo, forza del trend ed energia del movimento risultano allineati, il contesto segnala una fase ad alta probabilità operativa.
È applicabile su qualunque time frame o asset perché non è vincolato a dogmatiche e soggettive interpretazioni di analisi tecnica - fondamentale ma sfrutta ciò che realmente sta accadendo sul mercato.
I principali pattern grafici e il Volume Profile (in questa suite tecnicamente non inseribili) forniscono ulteriori conferme e/o indicazioni.
In queste condizioni il segnale non nasce da un singolo indicatore, ma dalla coerenza dell’intero sistema: tempo, volatilità ed energia si muovono nella stessa direzione.
Gli ingressi vanno sempre accompagnati da una corretta gestione del rischio.

Clock&Flow: Elements of Cycle Analysis 1st partClock&Flow – Elements of Cycle Analysis (ECA) | Complete Suite
Elements of Cycle Analysis (ECA) is an advanced cyclic analysis suite designed to interpret the market through time, structure, strength, and energy, combining cycles, volatility, and participation into a single operational framework.
The suite consists of two complementary modules:
🔹 ECA 1 – Cycles, Structure, and Volatility (Overlay: True)
ECA 1 is dedicated to the structural and temporal analysis of the market.
Cyclic SMAs (Cyclic Ratio) Moving averages are calibrated according to nominal cycles and timeframes to monitor multiple cycles simultaneously (from the lower cycle to the upper cycles). Crossovers between fast and slow SMAs certify the closing or transition of the cycle related to the faster SMA. The specific cycle is identified in the Info Table at the bottom right (for 15m - 1h - 2h - 1D timeframes). You can select the number of cycles to observe and the asset type to apply them to:
Index: Standard quotes (e.g., Cash sessions).
Future: Extended quotes (24h).
50-200: Classic institutional references for the medium-long term.
ATR-based Dynamic Cyclic Channels The channels represent a lower cycle and its upper counterpart; their width is determined by the observed timeframe and calculated based on average volatility (ATR). Volatility is not treated as noise but as a structural component of the cycle, essential for contextualizing excesses, compressions, and expansions.
Info Table and Quick Guide Dynamic tables automatically link SMAs, timeframes, and time cycles, providing an immediate reading of the current cyclic context.
Time Bands (Weekly / Daily) Temporal visualization helps identify cyclic pivots and rhythm transitions.
🔹 ECA 2 – Market Excesses, Strength, and Energy
ECA 2 analyzes how the market moves within the cyclic structure.
Excesses and Divergences (Cyclic Stochastic) An oscillator calibrated on the same cyclic ratio as the suite. Crossovers between the lower cycle (blue) and upper cycle (red) signal potential phase changes. In areas of excess, divergences often confirm the closing and restart of a cycle.
Directional Movement System (DMS) The ADX measures the strength of the movement, while +DI and -DI indicate direction. A simultaneous crossover of ADX, +DI, and -DI signals imminent acceleration, even before the strength is fully expressed.
Market Pulse – Real Market Energy The Market Pulse measures the amount of real energy moving through the market by relating three factors:
Price Velocity
Normalized Volume
Volatility (ATR relative to price)
These three factors are combined multiplicatively: if one is missing, the impulse weakens. The zero line represents a state of energy equilibrium; values above or below indicate a real imbalance (bullish or bearish). Note: Market Pulse is not a classic oscillator and should not be interpreted as overbought or oversold; it is used to evaluate the energetic quality of a movement.
Operational Convergence
The maximum operational effectiveness of the ECA suite is achieved when all modules converge on the same market phase.
When cyclic timing, volatility, price structure, trend strength, and movement energy align, the context signals a high-probability operational phase. The system is applicable to any timeframe or asset because it is not bound by dogmatic or subjective interpretations of technical or fundamental analysis; instead, it leverages what is actually happening in the market. Major chart patterns and Volume Profile (technically not includable in this specific suite) provide further confirmation.
Under these conditions, the signal does not originate from a single indicator but from the consistency of the entire system: time, volatility, and energy moving in the same direction.
Entries should always be accompanied by proper risk management.
––––––––––––––––––––––––––––––––––––––––––––––––––––––––––––––––––––––––
Clock&Flow – Elements of Cycle Analysis (ECA) | Suite Completa
Elements of Cycle Analysis (ECA) è una suite avanzata di analisi ciclica progettata per leggere il mercato attraverso tempo, struttura, forza ed energia, combinando cicli, volatilità e partecipazione in un unico framework operativo.
La suite è composta da due moduli complementari:
🔹 ECA 1 – Cicli, Struttura e Volatilità (overlay true)
ECA 1 è dedicato all’analisi strutturale e temporale del mercato.
SMA cicliche (ratio ciclica)
Le medie mobili sono calibrate in funzione dei cicli nominali e del timeframe per monitorare più cicli simultaneamente (dal ciclo inferiore fino ai cicli superiori).
Gli incroci tra SMA veloci e lente certificano la chiusura o transizione del ciclo correlato alla SMA più veloce. Il ciclo in questione è segnalato nella info table in basso a destra (per i time frame 15’ - 1h - 2h - 1D) Puoi selezionare il numero dei cicli da osservare e su quali asset applicarle (Index = quotazioni standard / Future = quotazioni estese / 50-200 i classici riferimenti istituzionali per il medio-lungo periodo
Canali ciclici dinamici basati su ATR
I canali rappresentano un ciclo inferiore e il suo superiore, l’ampiezza è data dal time frame osservato e calcolata sulla volatilità media (ATR).
La volatilità non è trattata come rumore, ma come componente strutturale del ciclo, utile per contestualizzare eccessi, compressioni ed espansioni.
Info Table e Quick Guide
Tabelle dinamiche collegano automaticamente SMA, timeframe e cicli temporali, fornendo una lettura immediata del contesto ciclico in corso.
Time Bands (Weekly / Daily)
La visualizzazione temporale aiuta a individuare pivot ciclici e transizioni di ritmo.
––––––––––––––––––––––––––––––––––––––––––––––––––––––––––––––––––––––
🔹 ECA 2 – Eccessi, Forza ed Energia del Mercato
ECA 2 analizza come il mercato si muove all’interno della struttura ciclica.
Eccessi e divergenze (Stochastic ciclico)
Oscillatore calibrato sulla stessa ratio ciclica della suite.
Gli incroci tra ciclo inferiore (blu) e superiore (rosso) segnalano potenziali cambi di fase; in area di eccesso, le divergenze certificano spesso la chiusura e ripartenza del ciclo.
Directional Movement System (DMS)
L’ADX misura la forza del movimento, mentre +DI e –DI ne indicano la direzione.
L’incrocio simultaneo di ADX, +DI e –DI segnala un’accelerazione imminente, anche in assenza di forza già espressa.
Market Pulse – Energia reale del mercato
Il Market Pulse misura quanta energia reale sta attraversando il mercato mettendo in relazione:
velocità del prezzo
volume normalizzato
volatilità (ATR rapportato al prezzo)
I tre fattori sono combinati in modo moltiplicativo: se uno manca, l’impulso si indebolisce.
La linea dello zero rappresenta una condizione di equilibrio energetico; valori sopra o sotto indicano uno sbilanciamento reale, rialzista o ribassista.
Il Market Pulse non è un oscillatore classico e non va interpretato in termini di ipercomprato o ipervenduto: serve a valutare la qualità energetica del movimento.
La massima efficacia operativa della suite ECA si ottiene quando tutti i moduli convergono sulla stessa fase di mercato.
Quando tempi ciclici, volatilità, struttura del prezzo, forza del trend ed energia del movimento risultano allineati, il contesto segnala una fase ad alta probabilità operativa.
È applicabile su qualunque time frame o asset perché non è vincolato a dogmatiche e soggettive interpretazioni di analisi tecnica - fondamentale ma sfrutta ciò che realmente sta accadendo sul mercato.
I principali pattern grafici e il Volume Profile (in questa suite tecnicamente non inseribili) forniscono ulteriori conferme e/o indicazioni.
In queste condizioni il segnale non nasce da un singolo indicatore, ma dalla coerenza dell’intero sistema: tempo, volatilità ed energia si muovono nella stessa direzione.
Gli ingressi vanno sempre accompagnati da una corretta gestione del rischio.

Nef33-Volume Footprint ApproximationDescription of the "Volume Footprint Approximation" Indicator
Purpose
The "Volume Footprint Approximation" indicator is a tool designed to assist traders in analyzing market volume dynamics and anticipating potential trend changes in price. It is inspired by the concept of a volume footprint chart, which visualizes the distribution of trading volume across different price levels. However, since TradingView does not provide detailed intrabar data for all users, this indicator approximates the behavior of a footprint chart by using available volume and price data (open, close, volume) to classify volume as buy or sell, calculate volume delta, detect imbalances, and generate trend change signals.
The indicator is particularly useful for identifying areas of high buying or selling activity, imbalances between supply and demand, delta divergences, and potential reversal points in the market. It provides specific signals for bullish and bearish trend changes, making it suitable for traders looking to trade reversals or confirm trends.
How It Works
The indicator uses volume and price data from each candlestick to perform the following calculations:
Volume Classification:
Classifies the volume of each candlestick as "buy" or "sell" based on price movement:
If the closing price is higher than the opening price (close > open), the volume is classified as "buy."
If the closing price is lower than the opening price (close < open), the volume is classified as "sell."
If the closing price equals the opening price (close == open), it compares with the previous close to determine the direction:
If the current close is higher than the previous close, it is classified as "buy."
If the current close is lower than the previous close, it is classified as "sell."
If the current close equals the previous close, the classification from the previous bar is used.
Delta Calculation:
Calculates the volume delta as the difference between buy volume and sell volume (buyVolume - sellVolume).
A positive delta indicates more buy volume; a negative delta indicates more sell volume.
Imbalance Detection:
Identifies imbalances between buy and sell volume:
A buy imbalance occurs when buy volume exceeds sell volume by a defined percentage (default is 300%).
A sell imbalance occurs when sell volume exceeds buy volume by the same percentage.
Delta Divergence Detection:
Positive Delta Divergence: Occurs when the price is falling (for at least 2 bars) but the delta is increasing or becomes positive, indicating that buyers are entering despite the price decline.
Negative Delta Divergence: Occurs when the price is rising (for at least 2 bars) but the delta is decreasing or becomes negative, indicating that sellers are entering despite the price increase.
Trend Change Signals:
Bullish Signal (trendChangeBullish): Generated when the following conditions are met:
There is a positive delta divergence.
The delta has moved from a negative value (e.g., -500) to a positive value (e.g., +200) over the last 3 bars.
There is a buy imbalance.
The price is near a historical support level (approximated as the lowest low of the last 50 bars).
Bearish Signal (trendChangeBearish): Generated when the following conditions are met:
There is a negative delta divergence.
The delta has moved from a positive value (e.g., +500) to a negative value (e.g., -200) over the last 3 bars.
There is a sell imbalance.
The price is near a historical resistance level (approximated as the highest high of the last 50 bars).
Visual Elements
The indicator is displayed in a separate panel below the price chart (overlay=false) and includes the following elements:
Volume Histograms:
Buy Volume: Represented by a green histogram. Shows the volume classified as "buy."
Sell Volume: Represented by a red histogram. Shows the volume classified as "sell."
Note: The histograms overlap, and the last plotted histogram (red) takes visual precedence, meaning the sell volume may cover the buy volume if it is larger.
Delta Line:
Delta Volume: Represented by a blue line. Shows the difference between buy and sell volume.
A line above zero indicates more buy volume; a line below zero indicates more sell volume.
A dashed gray horizontal line marks the zero level for easier interpretation.
Imbalance Backgrounds:
Buy Imbalance: Light green background when buy volume exceeds sell volume by the defined percentage.
Sell Imbalance: Light red background when sell volume exceeds buy volume by the defined percentage.
Divergence Backgrounds:
Positive Delta Divergence: Lime green background when a positive delta divergence is detected.
Negative Delta Divergence: Fuchsia background when a negative delta divergence is detected.
Trend Change Signals:
Bullish Signal: Green label with the text "Bullish Trend Change" when the conditions for a bullish trend change are met.
Bearish Signal: Red label with the text "Bearish Trend Change" when the conditions for a bearish trend change are met.
Information Labels:
Below each bar, a label displays:
Total Vol: The total volume of the bar.
Delta: The delta volume value.
Alerts
The indicator generates the following alerts:
Positive Delta Divergence: "Positive Delta Divergence Detected! Price is falling, but delta is increasing."
Negative Delta Divergence: "Negative Delta Divergence Detected! Price is rising, but delta is decreasing."
Bullish Trend Change Signal: "Bullish Trend Change Signal! Positive Delta Divergence, Delta Rise, Buy Imbalance, and Near Support."
Bearish Trend Change Signal: "Bearish Trend Change Signal! Negative Delta Divergence, Delta Drop, Sell Imbalance, and Near Resistance."
These alerts can be configured in TradingView to receive real-time notifications.
Adjustable Parameters
The indicator allows customization of the following parameters:
Imbalance Threshold (%): The percentage required to detect an imbalance between buy and sell volume (default is 300%).
Lookback Period for Divergence: Number of bars to look back for detecting price and delta trends (default is 2 bars).
Support/Resistance Lookback Period: Number of bars to look back for identifying historical support and resistance levels (default is 50 bars).
Delta High Threshold (Bearish): Minimum delta value 2 bars ago for the bearish signal (default is +500).
Delta Low Threshold (Bearish): Maximum delta value in the current bar for the bearish signal (default is -200).
Delta Low Threshold (Bullish): Maximum delta value 2 bars ago for the bullish signal (default is -500).
Delta High Threshold (Bullish): Minimum delta value in the current bar for the bullish signal (default is +200).
Practical Use
The indicator is useful for the following purposes:
Identifying Trend Changes:
The trend change signals (trendChangeBullish and trendChangeBearish) indicate potential price reversals. For example, a bullish signal near a support level may be an opportunity to enter a long position.
Detecting Divergences:
Delta divergences (positive and negative) can anticipate trend changes by showing a disagreement between price movement and underlying buying/selling pressure.
Finding Key Levels:
Imbalances (green and red backgrounds) often coincide with support and resistance levels, helping to identify areas where the market might react.
Confirming Trends:
A consistently positive delta in an uptrend or a negative delta in a downtrend can confirm the strength of the trend.
Identifying Failed Auctions:
Although not detected automatically, you can manually identify failed auctions by observing a price move to new highs/lows with decreasing volume in the direction of the move.
Limitations
Intrabar Data: It does not use detailed intrabar data, making it less precise than a native footprint chart.
Approximations: Volume classification and support/resistance detection are approximations, which may lead to false signals.
Volume Dependency: It requires reliable volume data, so it may be less effective on assets with inaccurate volume data (e.g., some forex pairs).
False Signals: Divergences and imbalances do not always indicate a trend change, especially in strongly trending markets.
Recommendations
Combine with Other Indicators: Use tools like RSI, MACD, support/resistance levels, or candlestick patterns to confirm signals.
Trade on Higher Timeframes: Signals are more reliable on higher timeframes like 1-hour or 4-hour charts.
Perform Backtesting: Evaluate the indicator's accuracy on historical data to adjust parameters and improve effectiveness.
Adjust Parameters: Modify thresholds (e.g., imbalanceThreshold or supportResistanceLookback) based on the asset and timeframe you are trading.
Conclusion
The "Volume Footprint Approximation" indicator is a powerful tool for analyzing volume dynamics and anticipating price trend changes. By classifying volume, calculating delta, detecting imbalances and divergences, and generating trend change signals, it provides traders with valuable insights into market buying and selling pressure. While it has limitations due to the lack of intrabar data, it can be highly effective when used in combination with other technical analysis tools and on assets with reliable volume data.

Depth of Market (DOM) [LuxAlgo]The Depth Of Market (DOM) tool allows traders to look under the hood of any market, taking price and volume analysis to the next level. The following features are included: DOM, Time & Sales, Volume Profile, Depth of Market, Imbalances, Buying Pressure, and up to 24 key intraday levels (it really packs a punch).
As a disclaimer, this tool does not use tick data, it is a DOM reconstruction from the provided real-time time series data (price and volume). So the volume you see is from filled orders only, this tool does not show unfilled limit orders.
Traders can enable or disable any of the features at will to avoid being overwhelmed with too much information and to make the tool perform faster.
The features that have the biggest impact on performance are Historical Data Collection, Key Levels (POC & VWAP), Time & Sales, Profile, and Imbalances. Disable these features to improve the indicator computational performance.
🔶 DOM
This is the simplest form of the tool, a simple DOM or ladder that displays the following columns:
PRICE: Price level
BID: Total number of market sell orders filled or limit buy orders filled.
SELL: Sell market orders
BUY: Buy market orders
ASK: Total number of market buy orders filled or limit sell orders filled.
The DOM only collects historical data from the last 24 hours and real-time data.
Traders can select a reset period for the DOM with two options:
DAILY: Resets at the beginning of each trading day
SESSIONS: Resets twice, as DAILY and 15.5 hours later, to coincide with the start of the RTH session for US tickers.
The DOM has two main modes, it can display price levels as ticks or points. The default is automatic based on the current daily volatility, but traders can manually force one mode or the other if they wish.
For convenience, traders have the option to set the number of lines (price levels), and the size of the text and to display only real-time data.
By default, the top price is set to 0 so that the DOM automatically adjusts the price levels to be displayed, but traders can set the top price manually so that the tool displays only the desired price levels in a fixed manner.
🔹 Volume Profile
As additional features to the basic DOM, traders have access to the volume profile histogram and the total volume per price level.
This helps traders identify at a glance key price areas where volume is accumulating (high volume nodes) or areas where volume is lacking (low volume nodes) - these areas are important to some traders who base their decision-making process on them.
🔹 Imbalances
Other added features are imbalances and buying pressure:
Interlevel Imbalance: volume delta between two different price levels
Intralevel Imbalance: delta between buy and sell volume at the same price level
Buying Pressure Percent: percentage of buy volume compared to total volume
Imbalances can help traders identify areas of interest in the price for possible support or resistance.
🔹 Depth
Depth allows traders to see at a glance how much supply is above the current price level or how much demand is below the current price level.
Above the current price level shows the cumulative ask volume (filled sell limit orders) and below the current price level shows the cumulative bid volume (filled buy limit orders).
🔶 KEY LEVELS
The tool includes up to 24 different key intraday levels of particular relevance:
Previous Week Levels
PWH: Previous week high
PWL: Previous week low
PWM: Previous week middle
PWS: Previous week settlement (close)
Previous Day Levels
PDH: Previous day high
PDL: Previous day low
PDM: Previous day middle
PDS: Previous day settlement (close)
Current Day Levels
OPEN: Open of day (or session)
HOD: High of day (or session)
LOD: Low of day (or session)
MOD: Middle of day (or session)
Opening Range
ORH: Open range high
ORL: Open range low
Initial Balance
IBH: Initial balance high
IBL: Initial balance low
VWAP
+3SD: Volume weighted average price plus 3 standard deviations
+2SD: Volume weighted average price plus 2 standard deviations
+1SD: Volume weighted average price plus 1 standard deviation
VWAP: Volume weighted average price
-1SD: Volume weighted average price minus 1 standard deviation
-2SD: Volume weighted average price minus 2 standard deviations
-3SD: Volume weighted average price minus 3 standard deviations
POC: Point of control
Different traders look at different levels, the key levels shown here are objective and specific areas of interest that traders can act on, providing us with potential areas of support or resistance in the price.
🔶 TIME & SALES
The tool also features a full-time and sales panel with time, price, and size columns, a size filter, and the ability to set the timezone to display time in the trader's local time.
The information shown here is what feeds the DOM and it can be useful in several ways, for example in detecting absorption. If a large number of orders are coming into the market but the price is barely moving, this indicates that there is enough liquidity at these levels to absorb all these orders, so if these orders stop coming into the market, the price may turn around.
🔶 SETTINGS
Period: Select the anchoring period to start data collection, DAILY will anchor at the start of the trading day, and SESSIONS will start as DAILY and 15.5 hours later (RTH for US tickers).
Mode: Select between AUTO and MANUAL modes for displaying TICKS or POINTS, in AUTO mode the tool will automatically select TICKS for tickers with a daily average volatility below 5000 ticks and POINTS for the rest of the tickers.
Rows: Select the number of price levels to display
Text Size: Select the text size
🔹 DOM
DOM: Enable/Disable DOM display
Realtime only: Enable/Disable real-time data only, historical data will be collected if disabled
Top Price: Specify the price to be displayed on the top row, set to 0 to enable dynamic DOM
Max updates: Specify how many times the values on the SELL and BUY columns are accumulated until reset.
Profile/Depth size: Maximum size of the histograms on the PROFILE and DEPTH columns.
Profile: Enable/Disable Profile column. High impact on performance.
Volume: Enable/Disable Volume column. Total volume traded at price level.
Interlevel Imbalance: Enable/Disable Interlevel Imbalance column. Total volume delta between the current price level and the price level above. High impact on performance.
Depth: Enable/Disable Depth, showing the cumulative supply above the current price and the cumulative demand below. Impact on performance.
Intralevel Imbalance: Enable/Disable Intralevel Imbalance column. Delta between total buy volume and total sell volume. High impact on performance.
Buying Pressure Percent: Enable/Disable Buy Percent column. Percentage of total buy volume compared to total volume.
Imbalance Threshold %: Threshold for highlighting imbalances. Set to 90 to highlight the top 10% of interlevel imbalances and the top and bottom 10% of intra-level imbalances.
Crypto volume precision: Specify the number of decimals to display on the volume of crypto assets
🔹 Key Levels
Key Levels: Enable/Disable KEY column. Very high performance impact.
Previous Week: Enable/Disable High, Low, Middle, and Close of the previous trading week.
Previous Day: Enable/Disable High, Low, Middle, and Settlement of the previous trading day.
Current Day/Session: Enable/Disable Open, High, Low and Middle of the current period.
Open Range: Enable/Disable High and Low of the first candle of the period.
Initial Balance: Enable/Disable High and Low of the first hour of the period.
VWAP: Enable/Disable Volume-weighted average price of the period with 1, 2, and 3 standard deviations.
POC: Enable/Disable Point of Control (price level with the highest volume traded) of the period.
🔹 Time & Sales
Time & Sales: Enable/Disable time and sales panel.
Timezone offset (hours): Enter your time zone\'s offset (+ or −), including a decimal fraction if needed.
Order Size: Set order size filter. Orders smaller than the value are not displayed.
🔶 THANKS
Hi, I'm makit0 coder of this tool and proud member of the LuxAlgo Opensource team, it's an honor to be part of the LuxAlgo family doing something I love as it's writing opensource code and sharing it with the world. I'd like to thank all of you who use, comment on, and vote for all of our open-source tools, and all of you who give us your support.
And of course thanks to the PineCoders family for all the work in front of and behind the scenes that makes the PineScript community what it is, simply the best.
Peace, Love & PineScript!
