HeikinAshi / MS-Signal (HA-MS)Hello?
Traders, welcome.
If you "Follow", you can always get new information quickly.
Please also click "Boost".
Have a good day.
-------------------------------------
I would like to take the time to explain the indicators needed for trading among the two indicator formulas previously disclosed.
The HA-MS indicator is an indicator created using the Heikin Ashi formula and the MACD formula.
Therefore, the reliability of the indicator is considered to be high.
If you want a comprehensive indicator, you can share the chart being published as an idea and use the MRHAB-T indicator.
The shared indicators can be used without any restrictions if you are a paid member of TradingView.
(Free members have many restrictions on sharing charts.)
The MS-Signal indicator using MACD is an indicator composed of M-Signal and S-Signal lines.
I made it possible to display the M-Signal line of the 1D, 1W, and 1M charts separately so that the trend can be checked on other timeframe charts.
Therefore, by looking at the 15m chart or 1h chart to check the overall trend when trading, we prevented getting caught up in temporary volatility, that is, a whipsaw, and made this M-Signal line to be used as support and resistance.
If you touch these M-Signal lines when a surge or plunge occurs, it means that there is a high possibility of indicating support or resistance.
If the 5EMA line on the 1D chart rises above the 5EMA line enough to be called a soaring moving average, it means that there is a high possibility of a sudden movement.
Therefore, the 5EMA line of the 1D chart is displayed separately so that it can be checked in time frames other than 1D (15m, 1h charts, etc.).
This 5EMA line can also be used as support and resistance like the M-Signal line of the 1D, 1W, and 1M charts described above.
The MS-Signal indicator is for viewing trends.
So, if the price stays above the MS-Signal indicator and the MS-Signal indicator turns into a bullish sign, it means that the uptrend is likely to continue.
Conversely, if the price stays below the MS-Signal indicator and the MS-Signal indicator turns to a bearish sign, then the downtrend is likely to continue.
Therefore, even if it temporarily rises above the MS-Signal indicator, it cannot be said that it will show an uptrend unless it is converted to an uptrend.
So, when the price surges and rises above the MS-Signal indicator, it is important to hold the price until the MS-Signal indicator turns into an uptrend.
If the HA-Low line or HA-High line is passing through these movements, you should respond by looking at whether you are supported or resisted on these lines.
The HA-Low line and the HA-High line are lines created for trading using Heikin Ashi candles.
Therefore, it can be interpreted that if it is supported by the HA-Low or HA-High line, it is highly likely to show an uptrend.
However, since the HA-Low and HA-High lines are calculated together with the RSI indicator, they are displayed on the chart as interactions.
The HA-Low line is a line created near the low point,
The HA-High line is a line created near the high point.
Therefore, if it shows support at the HA-Low line, it is time to buy.
And, if the price rises and rises above the HA-High line, it is likely to show a sharp movement.
Because of this movement, the HA-Low line is called the buy line, and the HA-High line is called the soaring line.
Since the HA-High line is a soaring line, if it is resisted by the HA-High line, it also means that there is a high possibility of a sharp decline.
If you see support at the HA-High line, you can buy it, but as I said, it is a sharp rise line, so you have to respond from a short-term perspective.
The Heikin Ashi body indicator is significant as it marks the first trend reversal.
So, you can see the first reversal move, either when the price first makes a move from a downtrend to an uptrend, or when the price first makes a move from an uptrend to a downtrend.
For example, if the price is in a downtrend and stops falling and moves sideways or rises slightly, the Heikin Ashi body indicator is likely to turn into an uptrend.
If this turns into a bullish sign, aggressive buying is possible.
However, since there is a high possibility that it will not rise higher and fall immediately, it is better to think of a trading strategy when it shows support by rising above the 5EMA line, HA-Low line, and MS-Signal indicator.
Let's assume that from an uptrend in price, the Heikin Ashi body indicator turns to a downtrend.
Then, if you touch the 5EMA line, the HA-High line, and the MS_Signal indicator, I think you can buy some time to think about a selling strategy.
-------------------------------------------------- -
It doesn't matter how you trade and what tools you use.
What matters is whether you can create a trading strategy.
We tend to spend more time on analysis like chart analysis, economic analysis.
Also, many analytical techniques are studied to do this kind of analysis.
I have spent a lot of time studying various analysis techniques and putting a lot of effort into using them in trading.
However, I realized that acquiring all of these things did not make me a good trader.
The indicators released today also do not mean much in reality.
It merely provides minimal information for creating a trading strategy.
I think it is better to put aside the idea of investing a lot of time in chart analysis and economic analysis and proceeding with trading.
Instead, I recommend spending a lot of time thinking about how to buy at the point or section you are trading, how to sell if the price rises, and how to stop loss if the price falls.
Quickly learn that learning difficult analytical techniques doesn't make you profitable on your trades.
I hope you understand.
An analytical technique or tool that allows you to earn a steady income is the best technique.
Creating a trading strategy is not difficult.
It's just that it feels difficult because I haven't organized my thoughts until now.
trading strategy
1. Investment period
2. Investment scale
3. Trading method and profit realization method
You just need to think in order and then start trading.
The most important thing in this trading strategy is the investment period.
The most important thing is whether to trade the coin (token) you want to trade by investing for a period such as the same day, short term, mid term, or long term.
This is because even though this first button is not connected properly, the following fund management and trading methods are all wrong.
I hope the day will come soon when you can play with the movement of the chart and get away from wrestling with the chart.
thank you.
---------------------------------
Wyszukaj w skryptach "ha溢价率"

HeikinAshi_Point (HA-P)Hello?
Traders, welcome.
If you "follow", you can always get new information quickly.
Please also click "Like".
Have a good day.
-------------------------------------
Following the previously published MACD-Total indicator, we are releasing the second indicator.
- index -
1. HA-P Indicator Description
2. Chart interpretation using HA-P indicators
3. More important than indicators is creating a trading strategy
(1. HA-P Indicator Description)
The Heikin Ashi candle chart is a very good way to see trends.
However, it is a pity that the actual price is not known on the chart made of Heikin Ashi candles.
To compensate for this, the body candle part (Open~Close) of the Heikin Ashi candle was filled with the background of the normal candle.
If you see more candles below the bottom of the body candle, you know the strength of the downtrend is high.
Conversely, if more candles are displayed above their body candles equivalent, you can tell that the bullish strength is high.
It can be seen that when the body candle color is displayed in blue, it is more likely to decline, and when it is in yellow, it is more likely to rise.
The Heikin Ashi candle is a trending candle.
Therefore, Heikin Ashi candles cannot be traded on their own.
To complement this, HA-Low and HA-High indicators were created.
The point where the HA-Low and HA-High indicators are leveled serves as support and resistance.
So, the longer the horizontal line, the stronger the support and resistance role.
A typical RSI is usually expressed as Close.
Since the Close of the Heikin Ashi candle is different from the normal Close, we made it to display when the RSI is oversold and overbought as the background of the price chart.
You cannot trade with the RSI indicator and the Heikin Ashi candle.
However, it can be used to detect a change in trend.
This gives you time to react to trend changes.
In order to trade, it is possible to find support and resistance at the HA-Low and HA-High indicators.
------------------------------------------------------------ ------
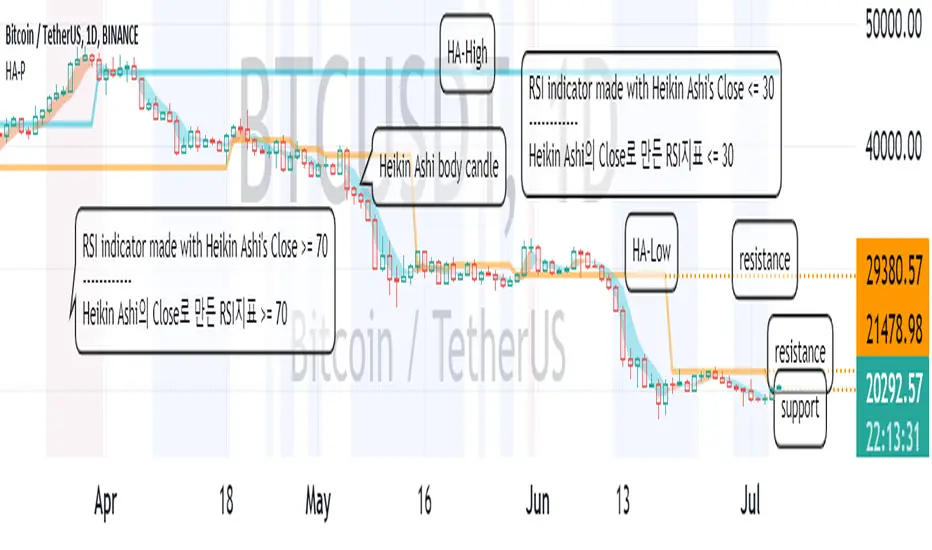
(2. Chart interpretation using HA-P indicator)
Let's interpret the BTCUSDT 1D chart using the HA-P indicator.
Primary resistance: around 21478.98
Secondary resistance: around 29380.57
It moved higher on the 4th of July, breaking out of the RSI oversold zone.
If it rises above the 19946.21 point and finds support, it is expected to lead to further upside.
However, it needs to rise above 21478.98 for support to lead to further upside.
---------------------------------
(3. More important than indicators is creating a trading strategy)
In order to trade using these indicators, you need to invest a lot of time and observe.
Whether you use an indicator or not, the most important thing in trading is whether you have many trading strategies.
No matter how good indicators and signals are, if you do not have a trading strategy, you will not be able to properly trade due to psychological pressure.
Therefore, it is most important to plan a trading strategy in advance before proceeding with a trade.
- How much money to invest
- How to set up a rough plan for buying in installments and selling in installments
- How to set the Stop Loss point
- How long will the investment be (short-term, medium-term, long-term, etc.)
Basically, the above thoughts must be concretely thought out before proceeding with the investment.
Otherwise, if you buy blindly when the price rises, there is a high possibility that you will end up incurring a loss due to psychological anxiety due to the volatility of the price.
----------------------------------
HA Color Change Alerts (fixed v3)📌 Heikin Ashi Color Change Alerts
This indicator notifies you whenever a Heikin Ashi candle changes color (from red → green or green → red).
🔎 Features
Automatic Heikin Ashi calculation
Uses TradingView’s built-in Heikin Ashi source, so you don’t need to switch your chart to HA candles.
Signals on chart
Plots ▲ (green triangle) when HA changes from red → green and ▼ (red triangle) when HA changes from green → red.
Customizable alerts
You can set TradingView alerts for:
“Heikin Ashi Turned GREEN”
“Heikin Ashi Turned RED”
Options
Show/Hide the Heikin Ashi candles on top of your normal chart.
Choose whether alerts trigger only after bar close, or intrabar as soon as the color flips.
Show or hide the signal markers.
🔔 Use cases
Trend following: enter when HA flips to green, exit when it flips back to red.
Early reversal spotting: get notified when the candle momentum shifts.
Works on any symbol and timeframe.

HA Reversal StrategyCertainly! Here's a detailed **description (elaboration)** for the **"HA Candle Test"** (i.e., the Heikin Ashi strategy script I just gave you):
---
### 📌 **Script Name**: HA Candle Test
### 📖 **Description**:
This script visualizes **Heikin Ashi candles** and identifies **trend reversal signals** using classic momentum candle behavior — particularly the appearance of **no-wick candles**, which are known to reflect strong directional pressure in Heikin Ashi charts.
It aims to **capture high-probability trend reversals** with minimal noise, relying on the natural smoothing behavior of Heikin Ashi candles.
---
### ✅ **Buy Signal Conditions**:
* At least **two consecutive red Heikin Ashi candles** (indicating a short-term downtrend).
* Followed by a **green Heikin Ashi candle** that has **no lower wick** (i.e., open == low).
* This suggests that **buyers have taken full control**, with no push from sellers — a potential start of an uptrend.
📍 **Interpreted as**: “Market was selling off, but now buyers stepped in strongly — time to consider buying.”
---
### ✅ **Sell Signal Conditions**:
* At least **two consecutive green Heikin Ashi candles** (short-term uptrend).
* Followed by a **red Heikin Ashi candle** that has **no upper wick** (i.e., open == high).
* This implies **sellers are dominating**, with no attempt from buyers to push higher — possible start of a downtrend.
📍 **Interpreted as**: “Market was rallying, but sellers just took over decisively — time to consider selling.”
---
### 📊 **Visual Aids Included**:
* Plots **Heikin Ashi candles** on your main chart for clarity.
* Uses **Buy** and **Sell** label markers (green & red) at signal points.
* Compatible with any timeframe — higher timeframes typically yield stronger signals.
---
### 💡 **Suggested Use**:
* Combine with **support/resistance**, **volume**, or **trend filters** for more robust setups.
* Works well on **1H, 4H, and Daily charts** in trending markets.
* Can be used manually or turned into an automated strategy for backtesting or alerts.
---
Would you like this script packaged as a **strategy()** for backtesting, or would you like me to add **alerts** so you can get notified in real-time when signals appear?

HA UtilityOften we need to see HA candles along with the regular candles, to stay longer in the momentum trades.
Also the replay feature does not work on HA candles.
This indicator does two things -
1) Prints a configurable number of HA candles on the chart. You can specify where they get printed by specifying a percentage.
2) Shows a green line when a Solid Red candle turns into a Solid Green candle
3) Shows a red line when a Solid Green candle turns into a Solid Red candle

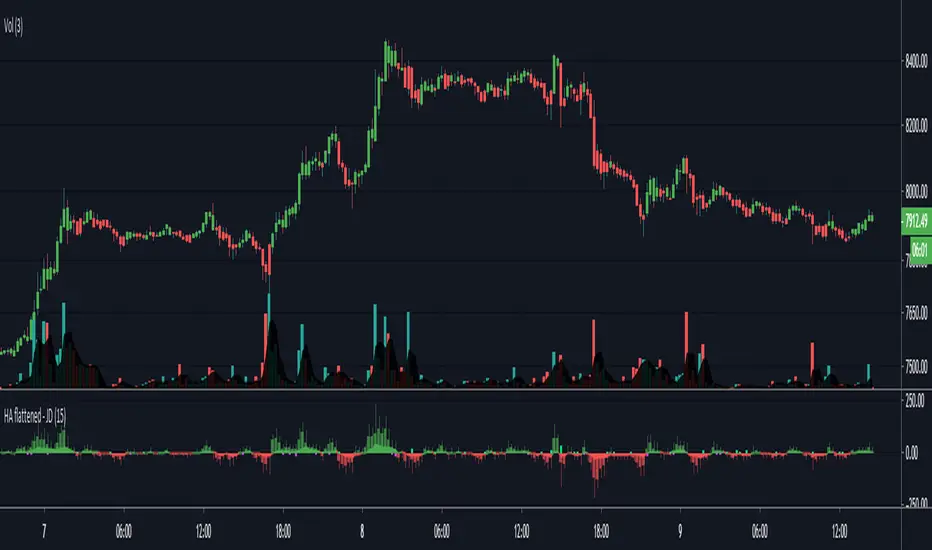
HA flattened - JDThis script gives you an opportunity to see the trend and price impulse information cointained in Heiken Ashi bars
whithout having to sacrifice seeing the raw price action of normal candles or other styles of charts.
I flattened out the HA bars to a straight line so it is easier to see if the candles momentum is picking up of fading
There is a Multi Time Frame option to show Heiken Ashi candles on another Time Frame.
There is the option to color the bars on the chart with the HA information (I use a 3 bar ma the further smooth out the info)
A last option is to add signals when the HA bars have wicks on the wrong side (down wicks on "up" candles an up wicks on "down" candles)
those can indicate price momentum staring to change into possible reversals or pull-backs soon.
JD.
#NotTradingAdvice
#DYOR
I build these indicators for myself and provide them open source, to use for free to use and improve upon,
as I believe the best way to learn is toghether.
[HA] Heikin-Ashi Shadow Candles// For overlaying Heikin Ashi candles over basic charts, or for use in it's own panel as an oscillator.
// Enjoy the visual cues of HA candles, without giving up price action awareness.
// Good for learning and comparison.
// Aug 11 2022
Release Notes: * Bugfix: Candle color was based on classic direction not HA direction (did not update cover photo).
// Aug 12 2022
Release Notes: * Implemented true oscillator mode.
Provided as separate plot (styles tab) or mode switch option (Inputs tab). TV gets spazzy with "styles tab" "default hidden" plots, and will reset them if any variables are modified that affect them (i.e. wick color override). Mode switch should be sufficient for both users.
// Aug 21 2022
Republished because of typo in indicator name prevented search.

HA Countdown Alert🟡 HA Countdown Alert — Heikin Ashi Candle Timing Assistant
Description:
This indicator is designed for traders who use Heikin Ashi candles on the 5-minute timeframe and want to receive a precise alert in the final seconds before the candle closes — when momentum is already defined but the bar hasn’t closed yet.
How it works:
Monitors Heikin Ashi direction (Bullish / Bearish) on a fixed 5-minute timeframe.
Activates a visual and sound alert when the remaining time before candle close is below your chosen countdown.
Displays a yellow marker and a dynamic label on the chart when the condition is active.
Allows you to customize the alert message directly from the input panel.
Inputs:
🟢 Direction: Bullish / Bearish
⏱ Countdown (seconds before close)
💬 Custom alert message
Why it helps:
This tool is perfect for traders who want to prepare for setups before the candle closes, stay focused on timing, and reduce FOMO-driven decisions.
It alerts you exactly when momentum confirms but the candle is still forming — giving you time to act with confidence.


HA smoothed eliminator v2 This script is published to show the difference between Heiken ASHI and Japanese candlesticks. I do not recommend using it in trading. the indicator is taken from here


Heikin Ashi Overlay SuiteHeikin Ashi Overlay Suite is designed to give traders more control and clarity when working with Heikin Ashi candles — whether you're analyzing trend strength, reducing chart noise, or simply improving your visual read of market momentum. It works by layering multiple types of HA overlays and color systems on top of your standard candlestick chart — without switching chart types. With dynamic gradient coloring, smoothing options, and a predictive line tool, this script helps you see not just what the current trend is, but how strong it is, and what it would take to reverse it.
Heikin Ashi candles help reduce noise but this script goes further by:
➡️adding color intelligence that shows trend strength using a streak counter
➡️uses smoothing logic to clean up chop and whipsaws
➡️introduces a predictive close line — a subtle but powerful guide for anticipating trend flips before they happen
Everything is configurable: colors, candle sources, overlays, predictive tools, and line styles. It’s built for traders who want visual speed, but don’t want to sacrifice signal quality.
At its core, the script offers two powerful dropdown controls:
💥HA Color Scheme (Colors Regular Candles) — Applies Heikin Ashi-derived coloring to your regular candles based on trend direction or streak strength. This gives you instant visual context without switching to a separate chart type.
💥HA Candle Overlay Mode — Overlays actual Heikin Ashi-style candles directly on top of your chart, using your preferred source:
➡️Custom HA candles using internal formula logic
➡️TradingView’s built-in Heikin Ashi source with your own colors
➖➖➖➖➖➖➖➖➖➖➖➖➖➖➖➖➖➖➖➖➖➖➖➖➖➖➖➖➖➖➖
🎨 Custom + Gradient HA Coloring🎨
See trend strength at a glance:
➡️1–4 bar streaks → lighter tone
➡️5–8 bars → medium tone
➡️9+ bars → bold tone, ideal for momentum-based entries, exits, or scaling strategies
→ Choose from:
➡️Your own custom color set
➡️A simple 2-color base mode
➡️Or a 3-level gradient for progressive trend analysis (using the streak counter)
🏛️ TradingView Official Heikin Ashi Overlay
Prefer native HA candles but want your own colors?
This mode plots TradingView's Heikin Ashi source, with your personal bullish/bearish color scheme.
➡️Ensures consistency with built-in charts while still leveraging your visual style.
🌊 Smoothed Heikin Ashi Candles — Clarity in Chaos🌊
These aren’t your standard HA candles. Smoothed Heikin Ashi uses a two-step EMA process to transform chaotic price action into a cleaner, slower-moving trend structure:
🔹 First, it smooths the raw OHLC data using EMA — filtering out minor price fluctuations.
🔹 Then, it applies the Heikin Ashi transformation on top of the smoothed data.
🔹 Finally, it applies a second EMA smoothing pass to the HA values — creating ultra-smooth candles.
📈 What You See:
Trends appear more fluid and consistent.
Choppy ranges and fakeouts are visually suppressed.
Minor pullbacks within a trend are de-emphasized, helping you avoid premature exits.
🎯 Best For:
Swing traders looking to stay in positions longer.
Intraday traders dealing with volatile or noisy instruments.
Anyone who wants a "trend map" overlay without the distractions of raw price action.
✅ Reduces whipsaws
✅ Delivers high-contrast trend zones
✅ Makes reversals more visually apparent (but with a slight lag)
📍 Predictive Close Line📍
Shows where the real close must land to flip the current HA candle's color.
✅ Use it like predictive support/resistance
✅ Know if the trend is actually at risk
✅Visualize potential fakeouts or confirmation
Color-coded based on current HA direction (bullish, bearish, or neutral).
📈 Tick by tick & bar-to-bar Plots📈
Provides 2 plot types:
1)1 plot that tracks a bar tick by tick
2)another plot that tracks the close from bar to bar
For the bar to bar plot, you can choose between 2 options:
✅Full Plot — continuous line colored by HA trend
✅Recent Segments — color just the last few bars (configurable) to reduce chart clutter
✅ Customize width, number of bars, and visibility
➖➖➖➖➖➖➖➖➖➖➖➖➖➖➖➖➖➖➖➖➖➖➖➖➖➖➖➖➖➖➖
📘 How to Use this script📘
Imagine you're watching a choppy 15-minute chart on a volatile crypto pair — price action is messy, and it’s hard to tell if a trend is forming or just noise.
Here’s how to cut through the chaos using Heikin Ashi Overlay Suite:
🔹 Step 1: Enable "Smoothed HA Candles"
Start by turning on the smoothed candles. You’ll immediately notice the noise fades, and broader directional moves become easier to follow. It's like switching from static to clean trend zones.
🧠 Why: Smoothed HA uses a double EMA process that filters out small reversals and lets larger moves stand out. Perfect for sideways or jittery charts.
🔹 Step 2: Watch the Color Gradient Build
As the smoothed candles begin to align in one direction, the gradient coloring (1–4, 5–8, 9+ streaks) gives you an at-a-glance visual of how strong the trend is.
✅ If you see 9+ same-colored candles? You’re likely in a mature trend.
✅ If it resets often? You’re in chop — consider staying out.
🔹 Step 3: Use the Predictive Close Line for Anticipation
Now here’s the edge — this line tells you where the candle would have to close to flip colors.
📉 If price is hovering just above it during a bullish run — momentum may be weakening.
📈 If price bounces off it — the trend may be strengthening.
This is excellent for confirming entries, exits, or spotting early warning signs.
🔹 Step 4: Switch Between Candle Modes as Needed
You can flip between:
✅ Custom HA: Gradient candles with your colors
✅ TradingView HA: The official source with your styling
✅ None: Just color regular candles using the HA logic
Use what fits your style — everything is modular.
🔹 Step 5: Tune It to Your Chart
Lastly, tweak streak thresholds (currently only can do this within the source code), smoothing lengths, and line styles to match your timeframe and strategy.
🎯 Tailor The Settings to Fit Your Trading Style🎯
🔹 🧪 Scalper (1–5 min charts)
If you’re trading fast intraday moves, you want quicker responsiveness and less lag.
Try these settings:
🔸Smoothing Lengths: Use lower values (e.g. len = 3, len2 = 5)
🔸Candle Mode: Use Custom HA or TV’s HA for real-time color flips
🔸Predictive Close Line: Great for ultra-fast anticipation of color reversals
🔸Line Mode: Use Recent Segments mode to track short bursts of trend
🔸Colors: Use high-contrast, opaque colors for clarity
✅ These settings help you catch micro-trends and flip signals faster, while still filtering out the worst of the noise.
🔹 🧪 Swing Trader (30m–4h charts and beyond)
If you’re looking for multi-hour or multi-day trend confirmation, prioritize clarity and staying in moves longer.
Recommended setup:
🔸Smoothing Lengths: Medium to high values (e.g. len = 8, len2 = 21)
🔸Candle Mode: Use Smoothed HA Candles to block out intrabar chop
🔸Gradient Colors: Enable to visualize trend maturity and strength
🔸Predictive Close Line: Helps confirm trend continuation or spot early reversals
🔸Line Mode: Use Full Plot Line for clean HA-based trend tracking
✅ These settings give you a calm, clean view of the bigger picture — ideal for holding positions longer and avoiding early exits.
🔧 This script isn’t just a chart overlay — it’s a visual trend engine.🔧
Ideal For:
🔶 Trend-followers who want clean, color-coded confirmation
🔶 Reversal traders spotting exhaustion via predictive flips
🔶 Scalpers filtering noise with lighter smoothing
🔶 Swing traders using smoothed visuals to hold longer
📌 Final Note
Heikin Ashi Overlay Pro is designed to help you see momentum, trend shifts, and market structure with greater clarity — not to predict price on its own. For best results:
✔️ Combine with support/resistance, moving averages, or price action patterns
✔️ Use Predictive Close as a confirmation tool, not a signal generator
✔️ Pair gradient colors with structure to gauge trend maturity
✔️ Always zoom out and check higher timeframes for context
🧠 Use this as part of a layered approach — not a standalone system.
🙏 Credits🙏
⚡HA logic based on SimpleCryptoLife
⚡Smoothed HA concept adapted from a script by Jackvmk
💡💡💡Turn logic into clarity. Structure into trades. And uncertainty into confidence.💡💡💡

Mambo MA & HAMambo MA & HA is a combined trend-view indicator that overlays Heikin Ashi direction markers and up to eight customizable moving averages on any chart.
The goal is to give a clear, uncluttered visual summary of short-term and long-term trend direction using both regular chart data and Heikin Ashi structure.
This indicator displays:
Heikin Ashi (HA) directional markers on the chart timeframe
Optional Heikin Ashi markers from a second, higher timeframe
Up to eight different moving averages (SMA, EMA, SMMA/RMA, WMA, VWMA)
Adjustable colors and transparency for visual layering
Offset controls for HA markers to prevent overlap with price candles
It is designed for visual clarity without altering the underlying price candles.
Heikin Ashi Direction Markers (Chart Timeframe)
The indicator generates HA OHLC values internally and compares the HA open and close:
Green (bullish) HA candle → triangle-up marker plotted above the bar
Red (bearish) HA candle → triangle-down marker plotted above the bar
The triangles use soft pastel colors for minimal obstruction:
Up marker: light green (rgb 204, 232, 204)
Down marker: light red (rgb 255, 204, 204)
The “HA Offset (chart TF ticks)” input lets users shift the triangle vertically in price terms to avoid overlapping the real candles or MAs.
Heikin Ashi Markers from a Second Timeframe
An optional second timeframe (default: 60m) shows additional HA direction:
Green HA (higher timeframe) → tiny triangle-up below the bar
Red HA (higher timeframe) → tiny triangle-down below the bar
This allows a trader to see higher-timeframe HA structure without switching charts.
The offset for the second timeframe is independent (“HA Offset (extra TF ticks)”).
Custom Moving Averages (Up to Eight)
The indicator includes eight individually configurable MAs, each with:
On/off visibility toggle
MA type
SMA
EMA
SMMA / RMA
WMA
VWMA
Source
Length
Color (with preset 70% transparency for visual stacking)
The default MA lengths are: 10, 20, 50, 100, 150, 200, 250, 300.
All MA colors are slightly transparent by design to avoid obscuring price bars and HA markers.
Purpose of the Indicator
This tool provides a simple combined view of:
Immediate trend direction (chart-TF HA markers)
Higher-timeframe HA trend bias (extra-TF markers)
Overall moving-average structure from short to very long periods
It is particularly useful for:
Monitoring trend continuation vs. reversal
Confirming entries with multi-TF Heikin Ashi direction
Identifying pullbacks relative to layered moving averages
Viewing trend context without switching timeframes
There are no signals, alerts, or strategy components.
It is strictly a visual trend-context tool.
Key Features Summary
Two-timeframe Heikin Ashi direction
Separate offsets for HA markers
Eight fully configurable MAs
Clean color scheme with low opacity
Non-intrusive overlays
Compatible with all markets and chart types

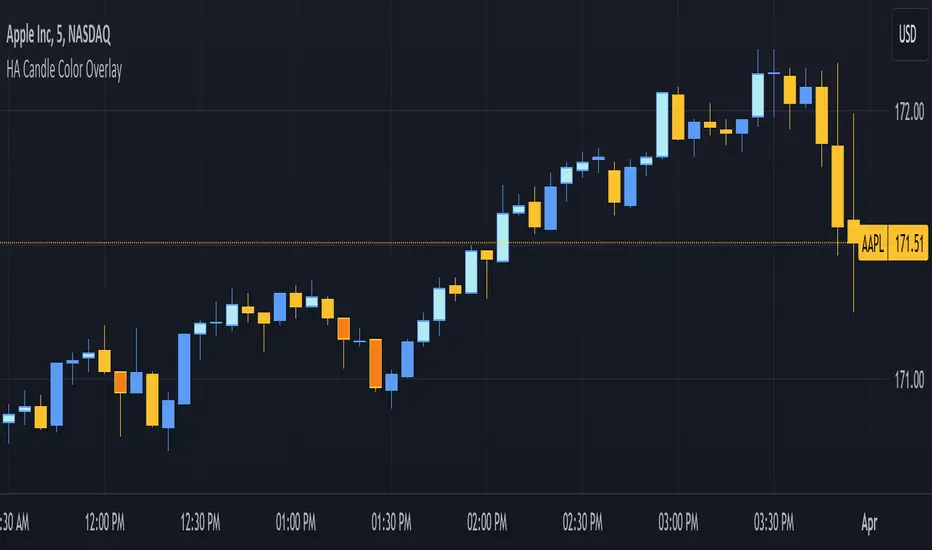
3. [Pufferman] - HA Candle Color OverlayThis indicator is designed for traders who utilize Heikin-Ashi (HA) candles to determine market trend direction and strength but prefer not to clutter their charts with multiple candlestick overlays or constantly switch between chart types. It aims to enhance chart readability by marking significant HA candles directly on the price chart, leveraging the unique characteristics of HA candles to signal trend direction and momentum.
Key Features:
1. Trend Identification through HA Candles: Automatically calculates Heikin-Ashi candles based on standard price data, highlighting significant HA candles that exhibit flat tops or bottoms. These characteristics are indicators of strong trend presence and direction. Highlights are in darker or lighter shade (darker - bearish or light - bullish colors) than the standard candles for easy read.
2. Cleaner Chart Presentation: Offers a streamlined alternative to overlaying HA candles on traditional candlestick charts or toggling between different chart views, keeping the user's interface uncluttered.
3. Selective Highlighting Based on Agreement: Marks traditional candles only when there's a concurrence between the HA candle's trend (bullish or bearish) and the traditional candle's trend. This feature ensures that only the most relevant signals are highlighted for the trader's attention.
Operational Mechanism: The script identifies HA candles with open equal to high (for flat tops) and open equal to low (for flat bottoms), which typically indicate strong trend movements. By marking these on the regular price chart, it provides immediate visual cues about trend strength and direction without needing to switch between HA and traditional candlestick views.
This tool is particularly useful for traders looking for a clean and efficient way to incorporate the insights of Heikin-Ashi candles into their technical analysis without the visual complexity of full HA candlestick overlays.
Cumulative Volume Delta (HA Option)# **📘 Ultimate Guide to Trading With CVD Heikin Ashi (CVD+)**
## **🔍 What This Indicator Shows**
This tool plots **Cumulative Volume Delta (CVD)** as candlesticks—optionally transformed into **Heikin Ashi CVD candles**.
Instead of price, each candle represents the *battle between buyers and sellers* within your chosen timeframe.
**Volume Delta = Buying Volume – Selling Volume**
CVD takes all deltas and stacks them cumulatively, showing who is controlling the auction *over time*.
With Heikin Ashi smoothing layered on top, trend detection becomes cleaner, letting you see the “true pressure” behind price moves.
---
# **💡 Why CVD Is a Game Changer**
Most traders only see price.
Serious traders watch **pressure**.
CVD exposes what price hides:
* Absorption
* Hidden accumulation
* Seller exhaustion
* Fake breakouts
* True reversals
* Momentum strength / weakness
* Smart money footprint
When combined with Heikin-Ashi smoothing, you get delta trends with way less noise and fewer fake flips.
---
# **📈 How to Actually Use It (The Edge)**
## **1. Spot True Trend vs. Fake Trend**
If **price goes up** but **CVD goes down**, that’s:
* Passive sellers absorbing
* A weak rally
* High probability of reversal
If **price pulls back** but **CVD keeps rising**, that’s:
* Secret accumulation
* A continuation setup
* Great dip-buy opportunity
**Rule of thumb:**
🔹 *Follow the CVD trend, not the price noise.*
---
## **2. Catch Reversals Early**
Watch for:
### **🔻 Bearish Reversal Signals**
* CVD makes a **lower high**
* Heikin Ashi CVD prints **red bodies with rising upper shadows**
* Price makes one final push up on low delta
This is classic distribution → the drop usually follows fast.
### **🔹 Bullish Reversal Signals**
* CVD forms a **higher low**
* HA CVD flips from red to green with full bodies
* Price still looks weak = bottom forming
This is exactly how pros catch bottoms early.
---
## **3. Identify Absorption Levels**
If price hits a level multiple times but CVD keeps climbing (or falling), that level is being defended.
Example:
* Price stalls at support
* CVD keeps rising
= **Buyers absorbing sells → high-probability bounce**
Opposite works for resistance.
---
## **4. Validate Breakouts**
A breakout with *weak or negative CVD* is usually a trap.
A breakout with **strong, rising HA CVD** is real.
If CVD diverges from the breakout direction → fade it.
If CVD confirms → ride it.
---
## **5. Use Heikin Ashi to Stay in Trends**
HA smoothing removes the nasty chop of raw delta data.
Look for:
* Consecutive **full-body teal candles = strong buying wave**
* Consecutive **full-body red candles = strong selling wave**
* Small-bodied candles after a trend = momentum dying
This keeps you in winners longer and cuts losers faster.
---
# **🎯 Practical Trading Playbook**
### **A) Long Setup**
1. Price pullback into support
2. CVD stays bullish or makes a higher low
3. HA CVD flips green or prints a strong body
4. Enter long
5. Stop under CVD structural low
### **B) Short Setup**
1. Price pushes into resistance
2. CVD forms bearish divergence
3. HA CVD prints red bodies
4. Enter short
5. Stop above CVD swing high
### **C) Chop Filter**
No clear HA CVD trend = avoid trading → stop donating money to the market.
---
# **🧠 Tips for Mastery**
* Use lower timeframe delta (1m–5m) for scalping entries
* Use a higher anchor timeframe (1D) to define direction
* When price trends but CVD is flat → expect a fakeout
* When CVD trends but price is flat → expect a breakout
* Trade WITH delta, fade AGAINST delta
---
# **⚠️ Important Notes**
* Crypto = full tick-by-tick volume → CVD is extremely accurate
* Stocks = depends on your broker/data vendor
* Futures = best signal-to-noise ratio
* If your symbol has no volume → indicator will warn you
---
# **📥 Recommended Settings**
* **Anchor timeframe**: 1D or 4H
* **Lower timeframe**: 1m, 3m, or 5m
* **Heikin Ashi**: ON for trend filtering, OFF for raw delta
---
# **🔥 Final Word**
Price can lie.
Delta usually doesn’t.
CVD + Heikin Ashi gives you the closest thing to reading the market’s heartbeat in real time.
Use it to confirm breakouts, detect reversals early, identify real trend strength, and avoid getting caught in manipulation.
If you learn to read CVD well…
you stop trading price, and start trading the **intent** behind the price.

CRYPTO HA Strategy money maker long termToday I bring you another amazing strategy.
Its made of 2 EMA in this case 50 and 100.
At the same time, internaly for candles we calculate the candles using the HA system ( while still using in live the normal candles). This way we can assure that even if we use HA candles, we avoid repainting, and its legit.
We first calculate the HA candles based on the EMA 50 values, and after that , we use that candle properties to apply to EMA 100.
Once we have that, for entries we have the next conditions :
sell = o2 > c2 and o2 < c2 and time_cond
buy = o2 < c2 and o2 > c2 and time_cond
For sell : Our open from HA 100 is bigger than Close from ha 100, and the previous open is smaller than previous close
For long : Our open from ha 100 is smaller than close from ha 100 and the previous open is bigger than previous close.
Then we have 2 options :
If we wnat to go only long , which is my prefered version ,or the original one where we go both long and short.
I found that the best results are in general around bigger timeframes, 1h+ , 3h works the best so far on my tests.
For exit we have 2 versions :
1 lets say we had a long signal, as soon as we have a short signal we close the trade. Viceversa for short.
2. Is based on price % movement. In this case I use 7.5% price movement of asset.
We have no TP in use for this system.
For the purpose of this test I use 10.000 $ account. For test I use 100% of it, without any leverage.
I use the SL based on price movement , which is a very risky tool, since it can fluctuate even at 20-30% of our capital.
For comission I used 0.1% for each deal, and a slippage of 5 points.
Be cautious with this system !
If you have any questions , message me.

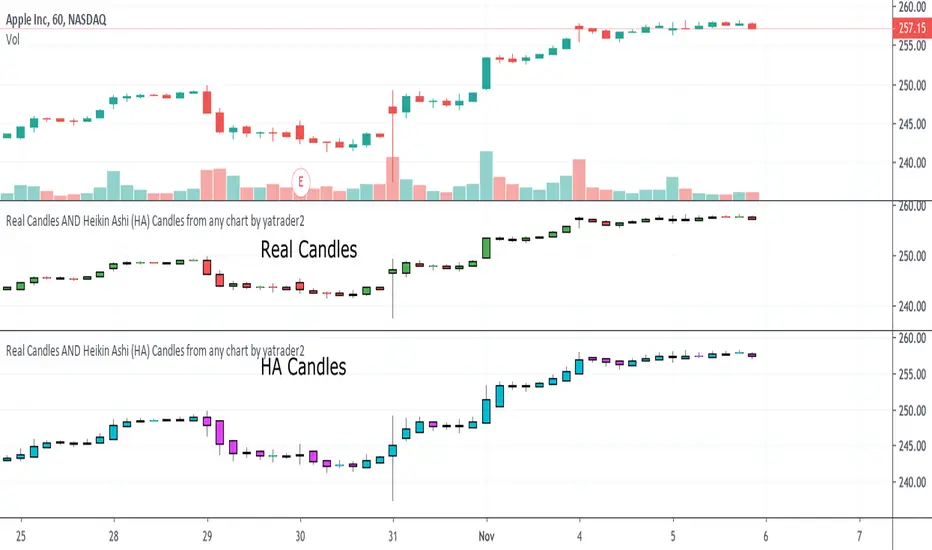
Real Candles Heikin Ashi (HA) Candle functionsThis script plots both real and HA candles regardless or which are used on the chart in TV settings.
(and has the functions for you to use.)
Lots of people seem to misunderstand backtesting (or scam people) based on HA candles.
Backtesting with HA candles leads to impossible trades. ALWAYS backtest with real candles.
That doesn't mean you might not want to look at HA candle values to make trading decisions.
Add the code below to calculate HA candles from real and use that in your HA trading algo,
but test it on real charts.
Real Price for Heikin Ashi ChartsThe indicator is in the top left of the screen! That's all there is, by design.
This is a super simple indicator that allows you to see what the real price of a candle was when using Heikin Ashi charts, while not cluttering up your screen.
HA charts are a great way to help those who can be spooked by the chaos of the markets (I'm one!), but they have a big drawback in that the price you see on a HA candle is often significantly different from the real price that you would trade on. This brings issues of unrealistic expectations of profits/losses, and also makes back testing a strategy very difficult. I still wouldn't recommend ever using TradingView's "strategy" tool when using HA charts, but using this indicator you can do accurate manual back tests.
There's nothing plotted on the screen given that there's no real point in it, but you can make the lines appear if you wish - just go into settings and change the transparency.
The order of the numbers on the indicator match the OHLC (Open, High, Low, Close) format.
There's also settings to turn off one or more of the OHLC values, simply open the settings and go to Inputs. This could be useful for some people, as the High and Low values of HA candles are the same as regular candles. Only the Open and Close are different.
Any queries let me know.
DreamsDefined

I_Heikin Ashi CandleWhen apply a strategy to Heikin Ashi Candle chart (HA candle), the strategy will use the open/close/high/low values of the Heikin Ashi candle to calculate the Profit and Loss, hence also affecting the Percent Profitable, Profit Factor, etc., often resulting a unrealistic high Percent Profitable and Profit Factor, which is misleading. But if you want to use the HA candle's values to calculate your indicator / strategy, but pass the normal candle's open/close/high/low values to the strategy to calculate the Profit / Loss, you can do this:
1) set up the main chart to be a normal candle chart
2) use this indicator script to plot a secondary window with indicator looks exactly like a HA-chart
3) to use the HA-candle's open/close/high/low value to calculate whatever indicator you want (you may need to create a separate script if you want to plot this indicator in a separate indicator window)

Dead Simple Heikin Ashi Candles (HA Candles)Are you looking for a dead simple calculation of the Heikin Ashi candles as they are calculated in tradingview? Here it is!
I was looking through the library and I saw that many have come up with a lot of awesome scripts using heikin ashi candles. But, I can't find anywhere that had the straightforward simple version of how Tradingview calculates them. This was a problem for me because I realized after punching the formula in that TradingView doesn't calculate HA candles in the original way.
You might say they don't calculate them the "right" but, spoiler alert, there is no right in trading. You can only be rational or irrational as you make money or lose money.
This is useful to me for building out some portions of an algo that are not going to be compatible with the built-in function. It happens. So, if you were looking for it too, hopefully it saves you some time.
For reference the original calc of HA candles is:
o = (prev_HA_open + prev_HA_close) / 2
h = math.max(high, ha_open, ha_close)
l = math.min(low, ha_open, ha_close)
c = ohlc4
Trade Well.
Smooth HA Candles MTF v1So this is last version of HA
this one has all MA type to choose from and MTF

Combined MTF Camarilla Pivots (HA + Candles)This is a fairly basic (but hopefully useful) indicator that combines three time-frames of Camarilla pivots into one.
Default time-frames are:
Weekly
Monthly
Yearly
Time-frames can be modified as you wish, they are just set to these as I generally only trade higher intervals (just note that formatting labels will not change - but you can update these as needed).
The Camarilla pivots displayed are as follows:
R3, R4, R5, R6
Pivot line (Middle/Base)
S3, S4, S5, S6
R1/S1 & R2/S2 are excluded to make way for R5/S5 & R6/S6 - as these are more useful for the majority of traders. The formula for levels 5/6 are always up for debate, as no official formula has ever been released. I've used what I consider a mid, or consensus calculation.
By default all historical pivot levels are displayed, as there can be some benefit to mapping these forward once the relevant period has ended. If people find it's too cluttered I'll look into having an option to display the current period only.
Unfortunately, TradingView doesn't allow labels on plots (seems like such a basic feature to be missing, but there you go), so you'll have to learn the colours/linewidths.
Oh, and there's a checkbox to enable pivots to be calculated on Heiken-Ashi prices/candles rather than default prices/candles. This heavily modifies the location of the Camarilla Pivots, but I've found that in certain situations you can get some great results.
Let me know your thoughts/comments/suggestions.
Cheers
DD

Kozlod - Heikin-Ashi Bar Color Change StrategyYou can use this script to backtest Heikin-Ashi bar color change strategy.
You have to apply this script to usual candles and not Heikin-Ashi!!!
Background color indicates HA bar color. On change you'll see green/red arrows and alert will be fired.
Also you can find in the code calculations of all HA OHLC values.
