Smart Money Concepts by WeloTradesThe "Smart Money Concepts by WeloTrades" indicator is designed to offer traders a comprehensive tool that integrates multiple advanced features to aid in market analysis. By combining order blocks, liquidity levels, fair value gaps, trendlines, and market structure analysis, the indicator provides a holistic approach to understanding market dynamics and making informed trading decisions.
Components and Their Integration:
Order Blocks and Breaker Blocks Detection
Functionality: Order blocks represent areas where significant buying or selling occurred, creating potential support or resistance zones. Breaker blocks signal potential reversals.
Integration: By detecting and visualizing these blocks, the indicator helps traders identify key levels where price might react, aiding in entry and exit decisions. The customizable settings allow traders to adjust the visibility and parameters to suit their specific trading strategy.
Liquidity Levels Analysis
Functionality: Liquidity levels indicate zones where significant price movements can occur due to the presence of large orders. These are areas where smart money might be executing trades.
Integration: By tracking these high-probability liquidity areas, traders can anticipate potential price movements. Customizable display limits and mitigation strategies ensure that the information is tailored to the trader’s needs, providing precise and actionable insights.
Fair Value Gaps (FVG)
Functionality: Fair value gaps highlight areas where there is an imbalance between buyers and sellers. These gaps often represent potential trading opportunities.
Integration: The ability to identify and analyze FVGs helps traders spot potential entries based on market inefficiencies. The touch and break detection functionalities provide further refinement, enhancing the precision of trading signals.
Trendlines
Functionality: Trendlines help in identifying the direction of the market and potential reversal points. The additional trendline adds a layer of confirmation for breaks or retests.
Integration: Automatically drawn trendlines assist traders in visualizing market trends and making decisions about potential entries and exits. The additional trendline for stronger confirmation reduces the risk of false signals, providing more reliable trading opportunities.
Market Structure Analysis
Functionality: Understanding market structure is crucial for identifying key support and resistance levels and overall market dynamics. This component displays internal, external, and composite market structures.
Integration: By automatically highlighting shifts in market structure, the indicator helps traders recognize important levels and potential changes in market direction. This analysis is critical for strategic planning and execution in trading.
Customizable Alerts
Functionality: Alerts ensure that traders do not miss significant market events, such as the formation or breach of order blocks, liquidity levels, and trendline interactions.
Integration: Customizable alerts enhance the user experience by providing timely notifications of key events. This feature ensures that traders can act quickly and efficiently, leveraging the insights provided by the indicator.
Interactive Visualization
Functionality: Customizable visual aspects of the indicator allow traders to tailor the display to their preferences and trading style.
Integration: This feature enhances user engagement and usability, making it easier for traders to interpret the data and make informed decisions. Personalization options like colors, styles, and display formats improve the overall effectiveness of the indicator.
How Components Work Together
Comprehensive Market Analysis
Each component of the indicator addresses a different aspect of market analysis. Order blocks and liquidity levels highlight potential support and resistance zones, while fair value gaps and trendlines provide additional context for potential entries and exits. Market structure analysis ties everything together by offering a broad view of market dynamics.
Synergistic Insights
The integration of multiple features allows for cross-validation of trading signals. For instance, an order block coinciding with a high-probability liquidity level and a fair value gap can provide a stronger signal than any of these features alone. This synergy enhances the reliability of the insights and trading signals generated by the indicator.
Enhanced Decision Making
By combining these advanced features into a single tool, traders are equipped with a powerful resource for making informed decisions. The customizable alerts and interactive visualization further support this by ensuring that traders can act quickly on the insights provided.
Order Blocks ( OB) & Breaker Blocks (BB) Visuals:
📝 OB Input Settings
📊 Timeframe #1
TF #1🕑: Enable or disable Timeframe 1.
What it is: A boolean input to toggle the use of the first timeframe.
What it does: Enables or disables Timeframe 1 for the OB settings.
How to use it: Check or uncheck the box to enable or disable.
📊 Timeframe 1 Selection
Timeframe #1🕑: Select the timeframe for Timeframe 1.
What it is: A dropdown to select the desired timeframe.
What it does: Sets the timeframe for Timeframe 1.
How to use it: Choose a timeframe from the dropdown list.
📊 Timeframe #2
TF #2🕑: Enable or disable Timeframe 2.
What it is: A boolean input to toggle the use of the second timeframe.
What it does: Enables or disables Timeframe 2 for the OB settings.
How to use it: Check or uncheck the box to enable or disable.
📊 Timeframe 2 Selection
Timeframe #2🕑: Select the timeframe for Timeframe 2.
What it is: A dropdown to select the desired timeframe.
What it does: Sets the timeframe for Timeframe 2.
How to use it: Choose a timeframe from the dropdown list.
Additional Info: Higher TF Chart & Lower TF Setting / Lower TF Chart & Higher TF Setting.
📏 Show OBs
OB (Length)📏: Toggle the display of Order Blocks.
What it is: A boolean input to enable or disable the display of Order Blocks.
What it does: Shows or hides Order Blocks based on the selected swing length.
How to use it: Check or uncheck the box to enable or disable.
📏 Swing Length Option
Swing Length Option: Select the swing length option.
What it is: A dropdown to choose between SHORT, MID, LONG, or CUSTOM.
What it does: Sets the length of swings for Order Blocks.
How to use it: Choose an option from the dropdown.
Additional Info: Default lengths are SHORT=10, MID=28, LONG=50.
🔧 Custom Swing Length
🔧custom: Specify a custom swing length.
What it is: An integer input for setting a custom swing length.
What it does: Overrides the default swing lengths if set to CUSTOM.
How to use it: Enter a custom integer value (only shown when CUSTOM is selected).
📛 Show BBs
BB (Method)📛: Toggle the display of Breaker Blocks.
What it is: A boolean input to enable or disable the display of Breaker Blocks.
What it does: Shows or hides Breaker Blocks.
How to use it: Check or uncheck the box to enable or disable.
📛 OB End Method
OB End Method: Select the method for determining the end of a Breaker Block.
What it is: A dropdown to choose between Wick and Close.
What it does: Sets the criteria for when a Breaker Block is considered mitigated.
How to use it: Choose an option from the dropdown.
Additional Info: Wicks: OB is mitigated when the price wicks through the OB Level. Close: OB is mitigated when the closing price is within the OB Level.
🔍 Max Bullish Zones
🔍Max Bullish: Set the maximum number of Bullish Order Blocks to display.
What it is: A dropdown to select the maximum number of Bullish Order Blocks.
What it does: Limits the number of Bullish Order Blocks shown on the chart.
How to use it: Choose a value from the dropdown (1-10).
🔍 Max Bearish Zones
🔍Max Bearish: Set the maximum number of Bearish Order Blocks to display.
What it is: A dropdown to select the maximum number of Bearish Order Blocks.
What it does: Limits the number of Bearish Order Blocks shown on the chart.
How to use it: Choose a value from the dropdown (1-10).
🟩 Bullish OB Color
Bullish OB Color: Set the color for Bullish Order Blocks.
What it is: A color picker to set the color of Bullish Order Blocks.
What it does: Changes the color of Bullish Order Blocks on the chart.
How to use it: Select a color from the color picker.
🟥 Bearish OB Color
Bearish OB Color: Set the color for Bearish Order Blocks.
What it is: A color picker to set the color of Bearish Order Blocks.
What it does: Changes the color of Bearish Order Blocks on the chart.
How to use it: Select a color from the color picker.
🔧 OB & BB Range
↔ OB & BB Range: Select the range option for OB and BB.
What it is: A dropdown to choose between RANGE and CUSTOM.
What it does: Sets how far the OB or BB should extend.
How to use it: Choose an option from the dropdown.
Additional Info: RANGE = Current price, CUSTOM = Adjustable Range.
🔧 Custom OB & BB Range
🔧Custom: Specify a custom range for OB and BB.
What it is: An integer input for setting a custom range.
What it does: Defines how far the OB or BB should go, based on a custom value.
How to use it: Enter a custom integer value (range: 1000-500000).
💬 Text Options
💬Text Options: Set text size and color for OB and BB.
What it is: A dropdown to select text size and a color picker to choose text color.
What it does: Changes the size and color of the text displayed for OB and BB.
How to use it: Select a size from the dropdown and a color from the color picker.
💬 Show Timeframe OB
Text: Toggle to display the timeframe of OB.
What it is: A boolean input to show or hide the timeframe text for OB.
What it does: Displays the timeframe information for Order Blocks on the chart.
How to use it: Check or uncheck the box to enable or disable.
💬 Show Volume
Volume: Toggle to display the volume of OB.
What it is: A boolean input to show or hide the volume information for Order Blocks.
What it does: Displays the volume information for Order Blocks on the chart.
How to use it: Check or uncheck the box to enable or disable.
Additional Info:
What it represents: The volume displayed represents the total trading volume that occurred during the formation of the Order Block. This can indicate the level of participation or interest in that price level.
How it's calculated: The volume is the sum of all traded volumes within the candles that form the Order Block.
What it means: Higher volume at an Order Block level may suggest stronger support or resistance. It shows the amount of trading activity and can be an indicator of the potential strength or validity of the Order Block.
Why it's shown: To give traders an idea of the market participation and to help assess the strength of the Order Block.
💬 Show Percentage
%: Toggle to display the percentage of OB.
What it is: A boolean input to show or hide the percentage information for Order Blocks.
What it does: Displays the percentage information for Order Blocks on the chart.
How to use it: Check or uncheck the box to enable or disable.
Additional Info:
What it represents: The percentage displayed usually represents the proportion of price movement relative to the Order Block.
How it's calculated: This can be the percentage move from the start to the end of the Order Block or the retracement level that price has reached relative to the Order Block's range.
What it means: It helps traders understand the extent of price movement within the Order Block and can indicate the significance of the price level.
Why it's shown: To provide a clearer understanding of the price dynamics and the importance of the Order Block within the overall price movement.
Additional Information
Volume Example: If an Order Block forms over three candles with volumes of 100, 150, and 200, the total volume displayed for that Order Block would be 450.
Percentage Example: If the price moves from 100 to 110 within an Order Block, and the total range of the Order Block is from 100 to 120, the percentage shown might be 50% (since the price has moved halfway through the Order Block's range).
Liquidity Levels visuals:
📊 Liquidity Levels Input Settings
📊 Current Timeframe
TF #1🕑: Enable or disable the current timeframe.
What it is: A boolean input to toggle the use of the current timeframe.
What it does: Enables or disables the display of liquidity levels for the current timeframe.
How to use it: Check or uncheck the box to enable or disable.
📊 Higher Timeframe
Higher Timeframe: Select the higher timeframe for liquidity levels.
What it is: A dropdown to select the desired higher timeframe.
What it does: Sets the higher timeframe for liquidity levels.
How to use it: Choose a timeframe from the dropdown list.
📏 Liquidity Length Option
📏Liquidity Length: Select the length for liquidity levels.
What it is: A dropdown to choose between SHORT, MID, LONG, or CUSTOM.
What it does: Sets the length of swings for liquidity levels.
How to use it: Choose an option from the dropdown.
Additional Info: Default lengths are SHORT=10, MID=28, LONG=50.
🔧 Custom Liquidity Length
🔧custom: Specify a custom length for liquidity levels.
What it is: An integer input for setting a custom swing length.
What it does: Overrides the default liquidity lengths if set to CUSTOM.
How to use it: Enter a custom integer value (only shown when CUSTOM is selected).
📛 Mitigation Method
📛Mitigation (Method): Select the method for determining the mitigation of liquidity levels.
What it is: A dropdown to choose between Close and Wick.
What it does: Sets the criteria for when a liquidity level is considered mitigated.
How to use it: Choose an option from the dropdown.
Additional Info:
Wick: Level is mitigated when the price wicks through the level.
Close: Level is mitigated when the closing price is within the level.
📛 Display Mitigated Levels
-: Select to display or hide mitigated levels.
What it is: A dropdown to choose between Remove and Show.
What it does: Displays or hides mitigated liquidity levels.
How to use it: Choose an option from the dropdown.
Additional Info:
Remove: Hide mitigated levels.
Show: Display mitigated levels.
🔍 Max Buy Side Liquidity
🔍Max Buy Side Liquidity: Set the maximum number of Buy Side Liquidity Levels to display.
What it is: An integer input to set the maximum number of Buy Side Liquidity Levels.
What it does: Limits the number of Buy Side Liquidity Levels shown on the chart.
How to use it: Enter a value between 0 and 50.
🟦 Buy Side Liquidity Color
Buy Side Liquidity Color: Set the color for Buy Side Liquidity Levels.
What it is: A color picker to set the color of Buy Side Liquidity Levels.
What it does: Changes the color of Buy Side Liquidity Levels on the chart.
How to use it: Select a color from the color picker.
Additional Info:
Tooltip: Set the maximum number of Buy Side Liquidity Levels to display. Default: 5, Min: 1, Max: 50.
If liquidity levels are not displayed as expected, try increasing the max count.
🔍 Max Sell Side Liquidity
🔍Max Sell Side Liquidity: Set the maximum number of Sell Side Liquidity Levels to display.
What it is: An integer input to set the maximum number of Sell Side Liquidity Levels.
What it does: Limits the number of Sell Side Liquidity Levels shown on the chart.
How to use it: Enter a value between 0 and 50.
🟥 Sell Side Liquidity Color
Sell Side Liquidity Color: Set the color for Sell Side Liquidity Levels.
What it is: A color picker to set the color of Sell Side Liquidity Levels.
What it does: Changes the color of Sell Side Liquidity Levels on the chart.
How to use it: Select a color from the color picker.
Additional Info:
Tooltip: Set the maximum number of Sell Side Liquidity Levels to display. Default: 5, Min: 1, Max: 50.
If liquidity levels are not displayed as expected, try increasing the max count.
✂ Box Style (Height)
✂ Box Style (↕): Set the box height style for liquidity levels.
What it is: A float input to set the height of the boxes.
What it does: Adjusts the height of the boxes displaying liquidity levels.
How to use it: Enter a value between -50 and 50.
Additional Info: Default value is -5.
📏 Box Length
b: Set the box length of liquidity levels.
What it is: An integer input to set the length of the boxes.
What it does: Adjusts the length of the boxes displaying liquidity levels.
How to use it: Enter a value between 0 and 500.
Additional Info: Default value is 20.
⏭ Extend Liquidity Levels
Extend ⏭: Toggle to extend liquidity levels beyond the current range.
What it is: A boolean input to enable or disable the extension of liquidity levels.
What it does: Extends liquidity levels beyond their default range.
How to use it: Check or uncheck the box to enable or disable.
Additional Info: Extend liquidity levels beyond the current range.
💬 Text Options
💬 Text Options: Set text size and color for liquidity levels.
What it is: A dropdown to select text size and a color picker to choose text color.
What it does: Changes the size and color of the text displayed for liquidity levels.
How to use it: Select a size from the dropdown and a color from the color picker.
💬 Show Text
Text: Toggle to display text for liquidity levels.
What it is: A boolean input to show or hide the text for liquidity levels.
What it does: Displays the text information for liquidity levels on the chart.
How to use it: Check or uncheck the box to enable or disable.
💬 Show Volume
Volume: Toggle to display the volume of liquidity levels.
What it is: A boolean input to show or hide the volume information for liquidity levels.
What it does: Displays the volume information for liquidity levels on the chart.
How to use it: Check or uncheck the box to enable or disable.
Additional Info:
What it represents: The volume displayed represents the total trading volume that occurred during the formation of the liquidity level. This can indicate the level of participation or interest in that price level.
How it's calculated: The volume is the sum of all traded volumes within the candles that form the liquidity level.
What it means: Higher volume at a liquidity level may suggest stronger support or resistance. It shows the amount of trading activity and can be an indicator of the potential strength or validity of the liquidity level.
Why it's shown: To give traders an idea of the market participation and to help assess the strength of the liquidity level.
💬 Show Percentage
%: Toggle to display the percentage of liquidity levels.
What it is: A boolean input to show or hide the percentage information for liquidity levels.
What it does: Displays the percentage information for liquidity levels on the chart.
How to use it: Check or uncheck the box to enable or disable.
Additional Info:
What it represents: The percentage displayed usually represents the proportion of price movement relative to the liquidity level.
How it's calculated: This can be the percentage move from the start to the end of the liquidity level or the retracement level that price has reached relative to the liquidity level's range.
What it means: It helps traders understand the extent of price movement within the liquidity level and can indicate the significance of the price level.
Why it's shown: To provide a clearer understanding of the price dynamics and the importance of the liquidity level within the overall price movement.
Fair Value Gaps visuals:
📊 Fair Value Gaps Input Settings
📊 Show FVG
TF #1🕑: Enable or disable Fair Value Gaps for Timeframe 1.
What it is: A boolean input to toggle the display of Fair Value Gaps.
What it does: Shows or hides Fair Value Gaps on the chart.
How to use it: Check or uncheck the box to enable or disable.
📊 Select Timeframe
Timeframe: Select the timeframe for Fair Value Gaps.
What it is: A dropdown to select the desired timeframe.
What it does: Sets the timeframe for Fair Value Gaps.
How to use it: Choose a timeframe from the dropdown list.
Additional Info: Higher TF Chart & Lower TF Setting or Lower TF Chart & Higher TF Setting.
📛 FVG Break Method
📛FVG Break (Method): Select the method for determining when an FVG is mitigated.
What it is: A dropdown to choose between Touch, Wicks, Close, or Average.
What it does: Sets the criteria for when a Fair Value Gap is considered mitigated.
How to use it: Choose an option from the dropdown.
Additional Info:
Touch: FVG is mitigated when the price touches the gap.
Wicks: FVG is mitigated when the price wicks through the gap.
Close: FVG is mitigated when the closing price is within the gap.
Average: FVG is mitigated when the average price (average of high and low) is within the gap.
📛 Show Mitigated FVG
show: Toggle to display mitigated FVGs.
What it is: A boolean input to show or hide mitigated Fair Value Gaps.
What it does: Displays or hides mitigated Fair Value Gaps.
How to use it: Check or uncheck the box to enable or disable.
📛 Fill FVG
Fill: Toggle to fill Fair Value Gaps.
What it is: A boolean input to fill the Fair Value Gaps with color.
What it does: Adds a color fill to the Fair Value Gaps.
How to use it: Check or uncheck the box to enable or disable.
📛 Shade FVG
Shade: Toggle to shade Fair Value Gaps.
What it is: A boolean input to shade the Fair Value Gaps.
What it does: Adds a shade effect to the Fair Value Gaps.
How to use it: Check or uncheck the box to enable or disable.
Additional Info: Select the method to break FVGs and toggle the visibility of FVG Breaks (fill FVG and/or shade FVG).
🔍 Max Bullish FVG
🔍Max Bullish FVG: Set the maximum number of Bullish Fair Value Gaps to display.
What it is: An integer input to set the maximum number of Bullish Fair Value Gaps.
What it does: Limits the number of Bullish Fair Value Gaps shown on the chart.
How to use it: Enter a value between 0 and 50.
🔍 Max Bearish FVG
🔍Max Bearish FVG: Set the maximum number of Bearish Fair Value Gaps to display.
What it is: An integer input to set the maximum number of Bearish Fair Value Gaps.
What it does: Limits the number of Bearish Fair Value Gaps shown on the chart.
How to use it: Enter a value between 0 and 50.
🟥 Bearish FVG Color
Bearish FVG Color: Set the color for Bearish Fair Value Gaps.
What it is: A color picker to set the color of Bearish Fair Value Gaps.
What it does: Changes the color of Bearish Fair Value Gaps on the chart.
How to use it: Select a color from the color picker.
Additional Info:
Tooltip: Set the maximum number of Bearish Fair Value Gaps to display. Default: 5, Min: 1, Max: 50.
If Fair Value Gaps are not displayed as expected, try increasing the max count.
🟦 Bullish FVG Color
Bullish FVG Color: Set the color for Bullish Fair Value Gaps.
What it is: A color picker to set the color of Bullish Fair Value Gaps.
What it does: Changes the color of Bullish Fair Value Gaps on the chart.
How to use it: Select a color from the color picker.
Additional Info:
Tooltip: Set the maximum number of Bullish Fair Value Gaps to display. Default: 5, Min: 1, Max: 50.
If Fair Value Gaps are not displayed as expected, try increasing the max count.
📏 FVG Range
↔ FVG Range: Set the range for Fair Value Gaps.
What it is: An integer input to set the range of the Fair Value Gaps.
What it does: Adjusts the range of the Fair Value Gaps displayed.
How to use it: Enter a value between 0 and 100.
Additional Info: Adjustable length only works when both RANGE & EXTEND display OFF. Range=current price, Extend=Full Range.
⏭ Extend FVG
Extend⏭: Toggle to extend Fair Value Gaps beyond the current range.
What it is: A boolean input to enable or disable the extension of Fair Value Gaps.
What it does: Extends Fair Value Gaps beyond their default range.
How to use it: Check or uncheck the box to enable or disable.
⏯ FVG Range
Range⏯: Toggle the range of Fair Value Gaps.
What it is: A boolean input to enable or disable the range display for Fair Value Gaps.
What it does: Sets the range of Fair Value Gaps displayed.
How to use it: Check or uncheck the box to enable or disable.
↕ Max Width
↕ Max Width: Set the maximum width of Fair Value Gaps.
What it is: A float input to set the maximum width of Fair Value Gaps.
What it does: Limits the width of Fair Value Gaps as a percentage of the price range.
How to use it: Enter a value between 0 and 5.0.
Additional Info: FVGs wider than this value will be ignored.
♻ Filter FVG
Filter FVG ♻: Toggle to filter out small Fair Value Gaps.
What it is: A boolean input to filter out small Fair Value Gaps.
What it does: Ignores Fair Value Gaps smaller than the specified max width.
How to use it: Check or uncheck the box to enable or disable.
➖ Mid Line Style
➖Mid Line Style: Select the style of the mid line for Fair Value Gaps.
What it is: A dropdown to choose between Solid, Dashed, or Dotted.
What it does: Sets the style of the mid line within Fair Value Gaps.
How to use it: Choose an option from the dropdown.
🎨 Mid Line Color
Mid Line Color: Set the color for the mid line within Fair Value Gaps.
What it is: A color picker to set the color of the mid line.
What it does: Changes the color of the mid line within Fair Value Gaps.
How to use it: Select a color from the color picker.
Additional Information
Mitigation Methods: Each method (Touch, Wicks, Close, Average) provides different criteria for when a Fair Value Gap is considered mitigated, helping traders to understand the dynamics of price movements within gaps.
Volume and Percentage: Displaying volume and percentage information for Fair Value Gaps helps traders gauge the strength and significance of these gaps in relation to trading activity and price movements.
Trendlines visuals:
📊 Trendlines Input Settings
📊 Show Trendlines
Trendlines & Trendlines Difference(%) ↕: Enable or disable trendlines and set the percentage difference from the first trendline.
What it is: A boolean input to toggle the display of trendlines.
What it does: Shows or hides trendlines on the chart and allows setting a percentage difference from the first trendline.
How to use it: Check or uncheck the box to enable or disable.
Additional Info: The percentage difference determines the distance of the second trendline from the first one.
📏 Trendline Length Option
📏Trendline Length: Select the length for trendlines.
What it is: A dropdown to choose between SHORT, MID, LONG, or CUSTOM.
What it does: Sets the length of trendlines.
How to use it: Choose an option from the dropdown.
Additional Info: Default lengths are SHORT=50, MID=100, LONG=200.
🔧 Custom Trendline Length
🔧custom: Specify a custom length for trendlines.
What it is: An integer input for setting a custom trendline length.
What it does: Overrides the default trendline lengths if set to CUSTOM.
How to use it: Enter a custom integer value (only shown when CUSTOM is selected).
🔍 Max Bearish Trendlines
🔍Max Trendlines Bearish: Set the maximum number of bearish trendlines to display.
What it is: A dropdown to select the maximum number of bearish trendlines.
What it does: Limits the number of bearish trendlines shown on the chart.
How to use it: Choose a value from the dropdown (2-20).
🟩 Bearish Trendline Color
Bearish Trendline Color: Set the color for bearish trendlines.
What it is: A color picker to set the color of bearish trendlines.
What it does: Changes the color of bearish trendlines on the chart.
How to use it: Select a color from the color picker.
Additional Info: Adjust to control how many bearish trendlines are displayed.
🔍 Max Bullish Trendlines
🔍Max Trendlines Bullish: Set the maximum number of bullish trendlines to display.
What it is: A dropdown to select the maximum number of bullish trendlines.
What it does: Limits the number of bullish trendlines shown on the chart.
How to use it: Choose a value from the dropdown (2-20).
🟥 Bullish Trendline Color
Bullish Trendline Color: Set the color for bullish trendlines.
What it is: A color picker to set the color of bullish trendlines.
What it does: Changes the color of bullish trendlines on the chart.
How to use it: Select a color from the color picker.
Additional Info: Adjust to control how many bullish trendlines are displayed.
📐 Degrees Text
📐Degrees ° (💬 Size): Enable or disable degrees text and set its size and color.
What it is: A boolean input to show or hide the degrees text for trendlines.
What it does: Displays the degrees text for trendlines.
How to use it: Check or uncheck the box to enable or disable.
📏 Text Size for Degrees
Text Size: Set the text size for degrees on trendlines.
What it is: A dropdown to select the size of the degrees text.
What it does: Changes the size of the degrees text displayed for trendlines.
How to use it: Choose a size from the dropdown (XS, S, M, L, XL).
🎨 Degrees Text Color
Degrees Text Color: Set the color for the degrees text on trendlines.
What it is: A color picker to set the color of the degrees text.
What it does: Changes the color of the degrees text on the chart.
How to use it: Select a color from the color picker.
♻ Filter Degrees
♻ Filter Degrees °: Enable or disable angle filtering and set the angle range.
What it is: A boolean input to filter trendlines by their angle.
What it does: Shows only trendlines within a specified angle range.
How to use it: Check or uncheck the box to enable or disable.
Additional Info: Angles outside this range will be filtered out.
🔢 Angle Range
Angle Range: Set the angle range for filtering trendlines.
What it is: Two float inputs to set the minimum and maximum angle for trendlines.
What it does: Defines the range of angles for which trendlines will be shown.
How to use it: Enter values for the minimum and maximum angles.
➖ Line Style
➖Style #1 & #2: Select the style of the primary and secondary trendlines.
What it is: Two dropdowns to choose between Solid, Dashed, or Dotted for the trendlines.
What it does: Sets the style of the primary and secondary trendlines.
How to use it: Choose a style from each dropdown.
📏 Line Thickness
: Set the thickness for the trendlines.
What it is: An integer input to set the thickness of the trendlines.
What it does: Adjusts the thickness of the trendlines displayed on the chart.
How to use it: Enter a value between 1 and 5.
Additional Information
Trendline Percentage Difference: Setting a percentage difference helps in analyzing the relative position and angle of trendlines.
Filtering by Angle: This feature allows focusing on trendlines within a specific angle range, enhancing the clarity of trend analysis.
BOS & CHOCH Market Structure visuals:
📊 BOS & CHOCH Market Structure Input Settings
📏 Market Structure Length Option
📏Market Structure: Select the market structure length option.
What it is: A dropdown to choose between INTERNAL, EXTERNAL, ALL, CUSTOM, or NONE.
What it does: Sets the type of market structure to be displayed.
How to use it: Choose an option from the dropdown.
Additional Info:
INTERNAL: Only internal structure.
EXTERNAL: Only external structure.
ALL: Both internal and external structures.
CUSTOM: Custom lengths.
NONE: No structure.
🔧 Custom Internal Length
🔧Custom Internal: Specify a custom length for internal market structure.
What it is: An integer input for setting a custom internal length.
What it does: Defines the length of internal market structures if CUSTOM is selected.
How to use it: Enter a custom integer value (only shown when CUSTOM is selected).
💬 Internal Label Size
💬Internal Label Size: Set the label size for internal market structures.
What it is: A dropdown to select the size of the labels.
What it does: Changes the size of the labels for internal market structures.
How to use it: Choose a size from the dropdown (XS, S, M, L, XL).
🟩 Internal Bullish Color
Internal Bullish Color: Set the color for bullish internal market structures.
What it is: A color picker to set the color of bullish internal market structures.
What it does: Changes the color of bullish internal market structures on the chart.
How to use it: Select a color from the color picker.
🟥 Internal Bearish Color
Internal Bearish Color: Set the color for bearish internal market structures.
What it is: A color picker to set the color of bearish internal market structures.
What it does: Changes the color of bearish internal market structures on the chart.
How to use it: Select a color from the color picker.
🔧 Custom External Length
🔧Custom External: Specify a custom length for external market structure.
What it is: An integer input for setting a custom external length.
What it does: Defines the length of external market structures if CUSTOM is selected.
How to use it: Enter a custom integer value (only shown when CUSTOM is selected).
💬 External Label Size
💬External Label Size: Set the label size for external market structures.
What it is: A dropdown to select the size of the labels.
What it does: Changes the size of the labels for external market structures.
How to use it: Choose a size from the dropdown (XS, S, M, L, XL).
🟩 External Bullish Color
External Bullish Color: Set the color for bullish external market structures.
What it is: A color picker to set the color of bullish external market structures.
What it does: Changes the color of bullish external market structures on the chart.
How to use it: Select a color from the color picker.
🟥 External Bearish Color
External Bearish Color: Set the color for bearish external market structures.
What it is: A color picker to set the color of bearish external market structures.
What it does: Changes the color of bearish external market structures on the chart.
How to use it: Select a color from the color picker.
📐 Show Equal Highs and Lows
EQL & EQH📐: Toggle visibility for equal highs and lows.
What it is: A boolean input to show or hide equal highs and lows.
What it does: Displays or hides equal highs and lows on the chart.
How to use it: Check or uncheck the box to enable or disable.
📏 Equal Highs and Lows Threshold
Equal Highs and Lows Threshold: Set the threshold for equal highs and lows.
What it is: A float input to set the threshold for equal highs and lows.
What it does: Defines the range within which highs and lows are considered equal.
How to use it: Enter a value between 0 and 10.
💬 Label Size for Equal Highs and Lows
💬Label Size for Equal Highs and Lows: Set the label size for equal highs and lows.
What it is: A dropdown to select the size of the labels.
What it does: Changes the size of the labels for equal highs and lows.
How to use it: Choose a size from the dropdown (XS, S, M, L, XL).
🟩 Bullish Color for Equal Highs and Lows
Bullish Color for Equal Highs and Lows: Set the color for bullish equal highs and lows.
What it is: A color picker to set the color of bullish equal highs and lows.
What it does: Changes the color of bullish equal highs and lows on the chart.
How to use it: Select a color from the color picker.
🟥 Bearish Color for Equal Highs and Lows
Bearish Color for Equal Highs and Lows: Set the color for bearish equal highs and lows.
What it is: A color picker to set the color of bearish equal highs and lows.
What it does: Changes the color of bearish equal highs and lows on the chart.
How to use it: Select a color from the color picker.
📏 Show Swing Points
Swing Points📏: Toggle visibility for swing points.
What it is: A boolean input to show or hide swing points.
What it does: Displays or hides swing points on the chart.
How to use it: Check or uncheck the box to enable or disable.
📏 Swing Points Length Option
Swing Points Length Option: Select the length for swing points.
What it is: A dropdown to choose between SHORT, MID, LONG, or CUSTOM.
What it does: Sets the length of swing points.
How to use it: Choose an option from the dropdown.
Additional Info: Default lengths are SHORT=10, MID=28, LONG=50.
💬 Swing Points Label Size
💬Swing Points Label Size: Set the label size for swing points.
What it is: A dropdown to select the size of the labels.
What it does: Changes the size of the labels for swing points.
How to use it: Choose a size from the dropdown (XS, S, M, L, XL).
🎨 Swing Points Color
Swing Points Color: Set the color for swing points.
What it is: A color picker to set the color of swing points.
What it does: Changes the color of swing points on the chart.
How to use it: Select a color from the color picker.
🔧 Custom Swing Points Length
🔧Custom Swings: Specify a custom length for swing points.
What it is: An integer input for setting a custom length for swing points.
What it does: Defines the length of swing points if CUSTOM is selected.
How to use it: Enter a custom integer value (only shown when CUSTOM is selected).
Additional Information
Market Structure Types: Understanding internal and external structures helps in analyzing different market behaviors.
Equal Highs and Lows: This feature identifies areas where price action is balanced, which can be significant for trading strategies.
Swing Points: Highlighting swing points aids in recognizing significant market reversals or continuations.
Benefits
Enhance your trading strategy by visualizing smart money's influence on price movements.
Make informed decisions with real-time data on significant market structures.
Reduce manual analysis with automated detection of key trading signals.
Ideal For
Traders looking for an edge in forex, equities, and cryptocurrency markets by understanding the underlying forces driving market dynamics.
Acknowledgements
Special thanks to these amazing creators for inspiration and their creations:
I want to thank these amazing creators for creating there amazing indicators , that inspired me and also gave me a head start by making this indicator! Without their amazing indicators it wouldn't be possible!
Flux Charts: Volumized Order Blocks
LuxAlgo: Trend Lines
UAlgo: Fair Value Gaps (FVG)
By Leviathan: Market Structure
Sonarlab: Liquidity Levels
Note
Remember to always backtest the indicator first before integrating it into your strategy! For any questions about the indicator, please feel free to ask for assistance.
Wyszukaj w skryptach "fvg"

SMC Analysis - Fair Value Gaps (Enhanced)SMC Analysis - Fair Value Gaps (Enhanced) Script Summary
Overview
The "SMC Analysis - Fair Value Gaps (Enhanced)" script, written in Pine Script (version 6), is a technical analysis indicator designed for TradingView to identify and visualize Fair Value Gaps (FVGs) on a price chart. It supports both the main timeframe and multiple higher timeframes (MTF) for comprehensive market analysis. FVGs are price gaps formed by a three-candle pattern, indicating potential areas of market inefficiency where price may return to fill the gap.
Key Features
FVG Detection:
Identifies bullish FVGs: Occur when the high of a candle two bars prior is lower than the low of the current candle, with the middle candle being bullish (close > open).
Identifies bearish FVGs: Occur when the low of a candle two bars prior is higher than the high of the current candle, with the middle candle being bearish (close < open).
Visualizes FVGs as colored boxes on the chart (green for bullish, red for bearish).
Mitigation Tracking:
Tracks when FVGs are touched (price overlaps the gap range) or mitigated (price fully closes the gap).
Strict Mode: Marks an FVG as mitigated when price touches the gap range.
Normal Mode: Requires a full breakthrough (price crossing the gap’s bottom for bullish FVGs or top for bearish FVGs) for mitigation.
Optionally converts FVG box borders to dashed lines and increases transparency when partially touched.
Multi-Timeframe (MTF) Support:
Analyzes FVGs on three user-defined higher timeframes (default: 15m, 60m, 240m).
Displays MTF FVGs with distinct labels and slightly more transparent colors.
Ensures no duplicate processing of MTF bars to maintain performance.
Customization Options:
FVG Length: Adjustable duration for how long FVGs are displayed (default: 20 bars).
Show/Hide FVGs: Toggle visibility for main timeframe and each MTF.
Color Customization: User-defined colors for bullish and bearish FVGs (default: green and red).
Display Options: Toggle for showing dashed lines after partial touches and strict mitigation mode.
Performance Optimization:
Limits the number of displayed boxes (50 for main timeframe, 20 per MTF) to prevent performance issues.
Automatically removes older boxes to maintain a clean chart.
Functionality
Visualization: Draws boxes around detected FVGs, with customizable colors and text labels ("FVG" for main timeframe, "FVG " for MTF).
Dynamic Updates: Extends or terminates FVG boxes based on mitigation status and user settings.
Efficient Storage: Uses arrays to manage FVG data (boxes, tops, bottoms, indices, mitigation status, and touch status) separately for main and MTF analyses.
Use Case
This indicator is designed for traders using Smart Money Concepts (SMC) to identify areas of market inefficiency (FVGs) for potential price reversals or continuations. The MTF support allows analysis across different timeframes, aiding in confirming trends or spotting higher-timeframe support/resistance zones.

D3m4h GIFVGDescription
D3m4h GIFVG is an indicator designed to automatically detect market imbalances—often referred to as FVGs (Fair Value Gaps)—and potential pivot-based shifts in market structure. It offers a dynamic approach to visualizing supply/demand inefficiencies and pivot-based trend changes. Key features include:
1. Pivot-Based Bullish/Bearish Detection
The indicator identifies higher-high/lower-low pivot logic as well as “outside bar” pivots.
It tracks when the market transitions from bullish to bearish ranges, or vice versa, by using multiple checks:
Pivot low/high detection
Break-of-structure (when price crosses the last pivot)
Opposing FVG detection to confirm an intraday pivot shift
2. FVG (Fair Value Gap) Detection
The script automatically scans for bullish or bearish FVG conditions:
Bullish FVG: Candle at position (bar_index - 2) has a high below the current candle’s low.
Bearish FVG: Candle at position (bar_index - 2) has a low above the current candle’s high.
When it detects an FVG, it draws a box on the chart to highlight the price gap (yellow boxes by default).
3. Pivot Range FVG
If an FVG forms while the market is in a bullish pivot range, the script can paint a special “blue” FVG to underscore its significance. The same logic applies if a newly formed FVG appears in a bearish pivot range.
4. Filled Gap Cleanup
You can optionally hide standard FVG boxes once they’re filled. For example, if the candle’s body (or candle range) covers that gap, the box is removed to keep your chart clean.
5. Pivot-Range FVG “Raided” Cleanup
If the pivot-based FVG is later filled from the opposing direction, it turns green and can optionally remove itself after a set number of bars.
6. Informative Table
A small table on the chart optionally displays whether or not the pivot-based FVG has been “raided”. You can toggle this table on/off in the settings.
How It Works
1. Pivot Shifts
The script tracks the last pivot high/low using a combination of candle-based pivot detection and break-of-structure checks (when price crosses the last pivot in the opposite direction).
When a shift is detected, the pivot range ID increments—this helps the script know when to remove old pivot-based FVGs or draw new ones.
2. FVG Formation
Each new bar checks if a bullish or bearish FVG formed (comparing the high of bar two bars ago to the current low, or the low of bar two bars ago to the current high).
If one is found, a box is drawn to highlight the imbalance. Its color and extension depend on script settings.
3. Imbalance or Pivot FVG
Standard imbalance boxes appear in yellow.
If the new imbalance coincides with a bullish or bearish pivot range, a special “pivot imbalance” box in blue is drawn.
3. Hide Filled
If a newly formed candle’s body fully covers the FVG, the box is considered filled. If Hide Filled Gaps is enabled, the box is deleted once it’s covered.
4. Raid Status
For the pivot-based (blue) FVG, once price invalidates it from the opposite side, it changes color to green and gets removed after a user-defined number of bars.
How to Use
1. Look for FVGs
Observe yellow boxes to identify potential intraday imbalances. Watch for price returning to fill these zones.
If you see a “blue” box, it signifies a pivot-based FVG in line with a recognized shift in structure—arguably a higher-probability zone.
2. “Hide Filled Gaps”
Turn this on if you only want to see currently active or partially filled imbalances. The script cleans up old, fully covered boxes to keep your chart neat.
3. Pivot Shifts
Note the script’s internal pivot logic. Each new pivot re-defines bullish or bearish states. Use these states to gauge the short-term trend shifts.
4. Toggle the Table
You can show or hide the chart table by enabling/disabling “Show Table” from the inputs. This table indicates if the pivot-based “GIFVG” has been “raided” or not.
5. Extend Count
Adjust the extendCount in the code if you want FVG boxes to extend further or shorter in time.
Underlying Concepts
Fair Value Gaps
Market inefficiencies that occur when price jumps, leaving a “gap” from the candle 2 bars ago to the current candle. They can act like mini supply/demand zones where price may revisit for balance.
Pivot Ranges
The script tries to maintain an internal sense of whether the market is in a bullish or bearish pivot range. When it sees a contrary FVG or break-of-structure, it flips the pivot state.
Outside Bars
A candle that has both a higher high and a lower low than the previous bar. The script uses these to mark significant pivot shifts.
By combining pivot-based logic with FVG detection, the D3m4h GIFVG indicator helps highlight potential areas of liquidity or unfilled value. Traders can use these zones to plan entries/exits or to confirm short-term trend shifts.

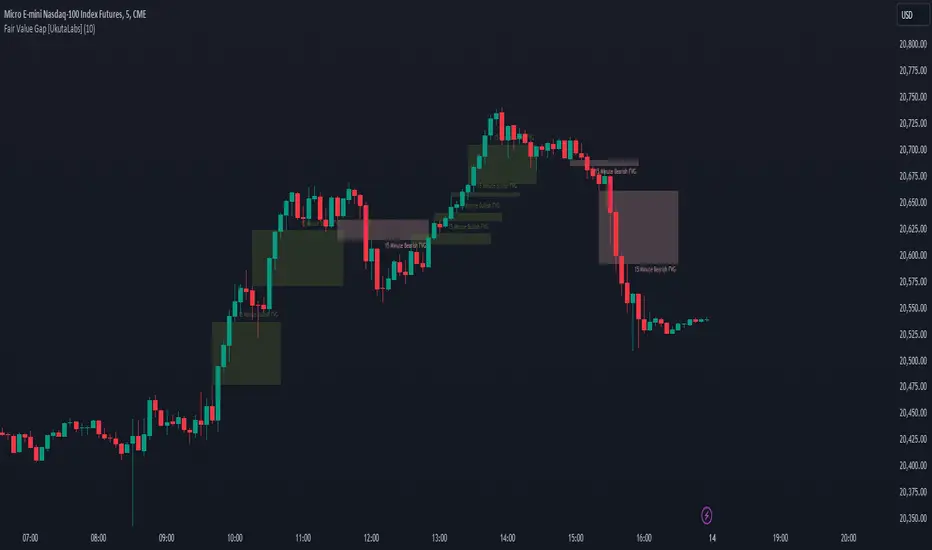
Fair Value Gap [UkutaLabs]█ OVERVIEW
Fair Value Gaps are price jumps caused by the imbalance buying and selling pressures in trading and are most commonly used amongst price action traders. Fair Value Gaps are formed via a three-candle sequence in which a large candle’s neighbouring candles’ upper and lower wicks do not fully overlap the large candle.
The Fair Value Gaps Indicator also supports Multi Time Frame Plotting, allowing you to plot the Fair Value Gaps from higher time frames onto lower time frame charts.
The Fair Value Gaps Indicator is a powerful trading toolkit that provides users with more information than they would typically have available to them by allowing them to configure several charts worth of information onto one single chart.
█ USAGE
The script automatically identifies imbalances between buying and selling pressure in the market in real time, offering traders valuable insight into current market sentiment. These gaps are considered to be levels where the supply and demand of a commodity are imbalanced, and the price tends to return to fill these gaps (But are not guaranteed to).
The Fair Value Gaps Indicator also allows gaps from higher time frames to be drawn on lower time frame charts, providing traders with more information than they would typically have access to to further simplify the decision making process.
█ SETTINGS
Configuration
• Show Labels: Determines whether labels that identify which time frame a FVG is calculated from.
• Max FVG Display: Determines the limit to the number of FVGs that can be drawn from all time frames. Set this value to 0 to remove this limit.
Current Time Frame
• Display: Determines whether or not FVGs from the current time frame will be drawn on the chart.
• Bullish Color: Determines the color of Bullish FVGs calculated from the current time frame.
• Bearish Color: Determines the color of Bearish FVGs calculated from the current time frame.
5 Minute (Higher Time Frame)
• Display: Determines whether or not FVGs from the 5 minute time frame will be drawn on the chart.
• Bullish Color: Determines the color of Bullish FVGs calculated from the 5 minute time frame.
• Bearish Color: Determines the color of Bearish FVGs calculated from the 5 minute time frame.
15 Minute (Higher Time Frame)
• Display: Determines whether or not FVGs from the 15 minute time frame will be drawn on the chart.
• Bullish Color: Determines the color of Bullish FVGs calculated from the 15 minute time frame.
• Bearish Color: Determines the color of Bearish FVGs calculated from the 15 minute time frame.
30 Minute (Higher Time Frame)
• Display: Determines whether or not FVGs from the 30 minute time frame will be drawn on the chart.
• Bullish Color: Determines the color of Bullish FVGs calculated from the 30 minute time frame.
• Bearish Color: Determines the color of Bearish FVGs calculated from the 30 minute time frame.
60 Minute (Higher Time Frame)
• Display: Determines whether or not FVGs from the 60 minute time frame will be drawn on the chart.
• Bullish Color: Determines the color of Bullish FVGs calculated from the 60 minute time frame.
• Bearish Color: Determines the color of Bearish FVGs calculated from the 60 minute time frame.
240 Minute (Higher Time Frame)
• Display: Determines whether or not FVGs from the 240 minute time frame will be drawn on the chart.
• Bullish Color: Determines the color of Bullish FVGs calculated from the 240 minute time frame.
• Bearish Color: Determines the color of Bearish FVGs calculated from the 240 minute time frame.
Daily (Higher Time Frame)
• Display: Determines whether or not FVGs from the daily time frame will be drawn on the chart.
• Bullish Color: Determines the color of Bullish FVGs calculated from the daily time frame.
• Bearish Color: Determines the color of Bearish FVGs calculated from the daily time frame.
ICT Silver Bullet with signals
The "ICT Silver Bullet with signals" indicator (inspired from the lectures of "The Inner Circle Trader" (ICT)),
goes a step further than the ICT Silver Bullet publication, which I made for LuxAlgo :
• uses HTF candles
• instant drawing of Support & Resistance (S/R) lines when price retraces into FVG
• NWOG - NDOG S/R lines
• signals
The Silver Bullet (SB) window which is a specific 1-hour interval where a Fair Value Gap (FVG) pattern can be formed.
When price goes back to the FVG, without breaking it, Support & Resistance lines will be drawn immediately.
There are 3 different Silver Bullet windows (New York local time):
The London Open Silver Bullet (03 AM — 04 AM ~ 03:00 — 04:00)
The AM Session Silver Bullet (10 AM — 11 AM ~ 10:00 — 11:00)
The PM Session Silver Bullet (02 PM — 03 PM ~ 14:00 — 15:00)
🔶 USAGE
This technique can visualise potential support/resistance lines, which can be used as targets.
The script contains 2 main components:
• forming of a Fair Value Gap (FVG)
• drawing support/resistance (S/R) lines
🔹 Forming of FVG
When HTF candles forms an FVG, the FVG will be drawn at the end (close) of the last HTF candle.
To make it easier to visualise the 2 HTF candles that form the FVG, you can enable
• SHOW -> HTF candles
During the SB session, when a FVG is broken, the FVG will be removed, together with its S/R lines.
The same goes if price did not retrace into FVG at the last bar of the SB session
Only exception is when "Remove broken FVG's" is disabled.
In this case a FVG can be broken, as long as price bounces back before the end of the SB session, it will remain to be visible:
🔹 Drawing support/resistance lines
S/R target lines are drawn immediately when price retraces into the FVG.
They will remain updated until they are broken (target hit)
Potential S/R lines are formed by:
• previous swings (swing settings (left-right)
• New Week Opening Gap (NWOG): close on Friday - weekly open
• New Day Opening Gap (NWOG): close previous day - current daily open
Only non-broken lines are included.
Broken =
• minimum of open and close below potential S/R line
• maximum of open and close above potential S/R line
NDOG lines are coloured fuchsia (as in the ICT lectures), NWOG are coloured white (darkmode) or black (lightmode ~ ICT lectures)
Swing line colour can be set as desired.
Here S/R includes NDOG lines:
The same situation, with "Extend Target-lines to their source" enabled:
Here with NWOG lines:
This publication contains a "Minimum Trade Framework (mTFW)", which represents the best-case expected price delivery, this is not your actual trade entry - exit range.
• 40 ticks for index futures or indices
• 15 pips for Forex pairs
The minimum distance (if applicable) can be shown by enabling "Show" - "Minimum Trade Framework" -> blue arrow from close to mTFW
Potential S/R lines needs to be higher (bullish) or lower (bearish) than mTFW.
🔶 SETTINGS
(check USAGE for deeper insights and explanation)
🔹 Only last x bars: when enabled, the script will do most of the calculations at these last x candles, potentially this can speeds calculations.
🔹 Swing settings (left-right): Sets the length, which will set the lookback period/sensitivity of the ZigZag patterns (which directs the trend and points for S/R lines)
🔹 FVG
HTF (minutes): 1-15 minutes.
• When the chart TF is equal of higher, calculations are based on current TF.
• Chart TF > 15 minutes will give the warning: "Please use a timeframe <= 15 minutes".
Remove broken FVG's: when enabled the script will remove FVG (+ associated S/R lines) immediately when FVG is broken at opposite direction.
FVG's still will be automatically removed at the end of the SB session, when there is no retrace, together with associated S/R lines,...
~ trend: Only include FVG in the same direction as the current trend
Note -> when set 'right' (swing setting) rather high ( > 3), he trend change will be delayed as well (default 'right' max 5)
Extend: extend FVG to max right side of SB session
🔹 Targets – support/resistance
Extend Target-lines to their source: extend lines to their origin
Colours (Swing S/R lines)
🔹 Show
SB session: show lines and labels of SB session (+ colour)
• Labels can be disabled separately in the 'Style' section, colour is set at the 'Inputs' section
Trend : Show trend (ZigZag, coloured ~ trend)
HTF candles: Show the 2 HTF candles that form the FVG
Minimum Trade Framework: blue arrow (if applicable)
🔶 ALERTS
There are 4 signals provided (bullish/bearish):
FVG Formed
FVG Retrace
Target reached
FVG cancelled
You can choose between dynamic alerts - only 1 alert needs to be set for all signals, or you can set specific alerts as desired.
💜 PURPLE BARS 😈
• Since TradingView has chosen to give away our precious Purple coloured Wizard Badge, bars are coloured purple 😊😉

Volumatic Fair Value Gaps [BigBeluga]🔵 OVERVIEW
The Volumatic Fair Value Gaps indicator detects and plots size-filtered Fair Value Gaps (FVGs) and immediately analyzes the bullish vs. bearish volume composition inside each gap. When an FVG forms, the tool samples volume from a 10× lower timeframe , splits it into Buy and Sell components, and overlays two compact bars whose percentages always sum to 100%. Each gap also shows its total traded volume . A live dashboard (top-right) summarizes how many bullish and bearish FVGs are currently active and their cumulative volumes—offering a quick read on directional participation and trend pressure.
🔵 CONCEPTS
FVGs (Fair Value Gaps) : Imbalance zones between three consecutive candles where price “skips” trading. The script plots bullish and bearish gaps and extends them until mitigated.
Size Filtering : Only significant gaps (by relative size percentile) are drawn, reducing noise and emphasizing meaningful imbalances.
// Gap Filters
float diff = close > open ? (low - high ) / low * 100 : (low - high) / high *100
float sizeFVG = diff / ta.percentile_nearest_rank(diff, 1000, 100) * 100
bool filterFVG = sizeFVG > 15
Volume Decomposition : For each FVG, the indicator inspects a 10× lower timeframe and aggregates volume of bullish vs. bearish candles inside the gap’s span.
100% Split Bars : Two inline bars per FVG display the % Bull and % Bear shares; their total is always 100%.
Total Gap Volume : A numeric label at the right edge of the FVG shows the total traded volume associated with that gap.
Mitigation Logic : Gaps are removed when price closes through (or touches via high/low—user-selectable) the opposite boundary.
Dashboard Summary : Counts and sums the active bullish/bearish FVGs and their total volumes to gauge directional dominance.
🔵 FEATURES
Bullish & Bearish FVG plotting with independent color controls and visibility toggles.
Adaptive size filter (percentile-based) to keep only impactful gaps.
Lower-TF volume sampling at 10× faster resolution for more granular Buy/Sell breakdown.
Per-FVG volume bars : two horizontal bars showing Bull % and Bear % (sum = 100%).
Per-FVG total volume label displayed at the right end of the gap’s body.
Mitigation source option : choose close or high/low for removing/invalidating gaps.
Overlap control : older overlapped gaps are cleaned to avoid clutter.
Auto-extension : active gaps extend right until mitigated.
Dashboard : shows count of bullish/bearish gaps on chart and cumulative volume totals for each side.
Performance safeguards : caps the number of active FVG boxes to maintain responsiveness.
🔵 HOW TO USE
Turn on/off FVG types : Enable Bullish FVG and/or Bearish FVG depending on your focus.
Tune the filter : The script already filters by relative size; if you need fewer (stronger) signals, increase the percentile threshold in code or reduce the number of displayed boxes.
Choose mitigation source :
close — stricter; gap is removed when a closing price crosses the boundary.
high/low — more sensitive; a wick through the boundary mitigates the gap.
Read the per-FVG bars :
A higher Bull % inside a bullish gap suggests constructive demand backing the imbalance.
A higher Bear % inside a bearish gap suggests supply is enforcing the imbalance.
Use total gap volume : Larger totals imply more meaningful interest at that imbalance; confluence with structure/HTF levels increases relevance.
Watch the dashboard : If bullish counts and cumulative volume exceed bearish, market pressure is likely skewed upward (and vice versa). Combine with trend tools or market structure for entries/exits.
Optional: hide volume bars : Disable Volume Bars when you want a cleaner FVG map while keeping total volume labels and the dashboard.
🔵 CONCLUSION
Volumatic Fair Value Gaps blends precise FVG detection with lower-timeframe volume analytics to show not only where imbalances exist but also who powers them. The per-gap Bull/Bear % bars, total volume labels, and the cumulative dashboard together provide a fast, high-signal read on directional participation. Use the tool to prioritize higher-quality gaps, align with trend bias, and time mitigations or continuations with greater confidence.

GEEKSDOBYTE IFVG w/ Buy/Sell Signals1. Inputs & Configuration
Swing Lookback (swingLen)
Controls how many bars on each side are checked to mark a swing high or swing low (default = 5).
Booleans to Toggle Plotting
showSwings – Show small triangle markers at swing highs/lows
showFVG – Show Fair Value Gap zones
showSignals – Show “BUY”/“SELL” labels when price inverts an FVG
showDDLine – Show a yellow “DD” line at the close of the inversion bar
showCE – Show an orange dashed “CE” line at the midpoint of the gap area
2. Swing High / Low Detection
isSwingHigh = ta.pivothigh(high, swingLen, swingLen)
Marks a bar as a swing high if its high is higher than the highs of the previous swingLen bars and the next swingLen bars.
isSwingLow = ta.pivotlow(low, swingLen, swingLen)
Marks a bar as a swing low if its low is lower than the lows of the previous and next swingLen bars.
Plotting
If showSwings is true, small red downward triangles appear above swing highs, and green upward triangles below swing lows.
3. Fair Value Gap (3‐Bar) Identification
A Fair Value Gap (FVG) is defined here using a simple three‐bar logic (sometimes called an “inefficiency” in price):
Bullish FVG (bullFVG)
Checks if, two bars ago, the low of that bar (low ) is strictly greater than the current bar’s high (high).
In other words:
bullFVG = low > high
Bearish FVG (bearFVG)
Checks if, two bars ago, the high of that bar (high ) is strictly less than the current bar’s low (low).
In other words:
bearFVG = high < low
When either condition is true, it identifies a three‐bar “gap” or unfilled imbalance in the market.
4. Drawing FVG Zones
If showFVG is enabled, each time a bullish or bearish FVG is detected:
Bullish FVG Zone
Draws a semi‐transparent green box from the bar two bars ago (where the gap began) at low up to the current bar’s high.
Bearish FVG Zone
Draws a semi‐transparent red box from the bar two bars ago at high down to the current bar’s low.
These colored boxes visually highlight the “fair value imbalance” area on the chart.
5. Inversion (Fill) Detection & Entry Signals
An inversion is defined as the price “closing through” that previously drawn FVG:
Bullish Inversion (bullInversion)
Occurs when a bullish FVG was identified on bar-2 (bullFVG), and on the current bar the close is greater than that old bar-2 low:
bullInversion = bullFVG and close > low
Bearish Inversion (bearInversion)
Occurs when a bearish FVG was identified on bar-2 (bearFVG), and on the current bar the close is lower than that old bar-2 high:
bearInversion = bearFVG and close < high
When an inversion is true, the indicator optionally draws two lines and a label (depending on input toggles):
Draw “DD” Line (yellow, solid)
Plots a horizontal yellow line from the current bar’s close price extending five bars forward (bar_index + 5). This is often referred to as a “Demand/Daily Demand” line, marking where price inverted the gap.
Draw “CE” Line (orange, dashed)
Calculates the midpoint (ce) of the original FVG zone.
For a bullish inversion:
ce = (low + high) / 2
For a bearish inversion:
ce = (high + low) / 2
Plots a horizontal dashed orange line at that midpoint for five bars forward.
Plot Label (“BUY” / “SELL”)
If showSignals is true, a green “BUY” label is placed at the low of the current bar when a bullish inversion occurs.
Likewise, a red “SELL” label at the high of the current bar when a bearish inversion happens.
6. Putting It All Together
Swing Markers (Optional):
Visually confirm recent swing highs and swing lows with small triangles.
FVG Zones (Optional):
Highlight areas where price left a 3-bar gap (bullish in green, bearish in red).
Inversion Confirmation:
Wait for price to close beyond the old FVG boundary.
Once that happens, draw the yellow “DD” line at the close, the orange dashed “CE” line at the zone’s midpoint, and place a “BUY” or “SELL” label exactly on that bar.
User Controls:
All of the above elements can be individually toggled on/off (showSwings, showFVG, showSignals, showDDLine, showCE).
In Practice
A bullish FVG forms whenever a strong drop leaves a gap in liquidity (three bars ago low > current high).
When price later “fills” that gap by closing above the old low, the script signals a potential long entry (BUY), draws a demand line at the closing price, and marks the midpoint of that gap.
Conversely, a bearish FVG marks a potential short zone (three bars ago high < current low). When price closes below that gap’s high, it signals a SELL, with similar lines drawn.
By combining these elements, the indicator helps users visually identify inefficiencies (FVGs), confirm when price inverts/fills them, and place straightforward buy/sell labels alongside reference lines for trade management.

cd_full_poi_CxOverview
This indicator tracks the price in 16 different time frames (optional) in order to answer the question of where the current price has reacted or will react.
It appears on the chart and in the report table when the price approaches or touches the fvg or mitigations (order block / supply-demand), the rules of which will be explained below.
In summary, it follows the fvg and mitigations in the higher timeframe than the lower timeframe.
Many traders see fvg or mitigates as an point of interest and see the high, low swept in those zones as a trading opportunity. Key levels, Session high/lows and Equal high and lows also point of interest.
If we summarise the description of the point of interest ;
1- Fair value gaps (FVG) (16 time frames)
2- Mitigation zones (16 time frames)
3- Previous week, day, H4, H1 high and low levels
4- Sessions zones (Asia, London and New York)
5- Equal high and low levels are in indicator display.
Details:
1- Fair Value Gaps : It is simply described as a price gap and consists of a series of 3 candles. The reaction of the price to the gap between the 1st and 3rd candle wicks is observed.
The indicator offers 3 options for marking. These are :
1-1- ‘Colours are unimportant’: candle colours are not considered for marking. Fvg formation is sufficient.(Classical)
1-2- ‘First candle opposite colour’ : when a price gap occurs, the first candle of a series of 3 candles must be opposite.
For bullish fvg : bearish - bullish - free
For Bearish fvg : bullish - bearish - free
1-3- ‘All same colour’ : all candles in a series of 3 candles must be the same direction.
For bullish fvg: bullish - bullish - bullish
For bearish fvg : bearish - bearish – bearish
Examples:
2- Mitigation zones: Opposite candles with a fvg in front of them or candles higher/lower than the previous and next candle and with the same colour as the fvg series are marked.
Examples :
3- Previous week, day, H4, H1 high and low levels
4- Sessions regions (Asia, London and New York)
5- Equal high and low levels:
Annotation: Many traders want to see a liquidity grab on the poi, then try to enter the trade with the appropriate method.
Among the indicators, there is also the indication of grabs/swepts that occur at swing points. It is also indicated when the area previously marked as equal high/low is violated (grab).
At the end, sample setups will be shown to give an idea about the use of the indicator.
Settings:
- The options to be displayed from the menu are selected by ticking.
- 1m, 2m, 3m, 5m, 5m, 10m, 15m, 30m, h1, h4, h4, h6, h8, h12, daily, weekly, monthly and quarterly, 16 time zones in total can be displayed.
- The ‘Collapse when the price touches mitigate’ tab controls whether to collapse the box as the price moves into the inner region of the mitigate. If not selected, the size of the mitigate does not change.
- ‘Approach limit =(ATR / n)’ tab controls how close the price is to the fvg or mitigate. Instant ATR(10) value is calculated by dividing by the entered ‘n’ value.
- All boxes and lines are automatically removed from the screen when the beyond is closed.
- Colour selections, table, text features are controlled from the menu.
- Sessions hours are set as standard hours, the user can select special time zones. Timezone is set to GMT-4.
- On the candle when the price touches fvg or mitigate, the timeframe information of the POI is shown in the report table together with the graphical representation.
The benefits and differences :
1- We can evaluate the factors we use for setup together.
2- We are aware of what awaits us in the high time frame in the following candles.
3- It offers the user the opportunity to be selective with different candle selection options in fvg selection.
4- Mitige areas are actually unmitige areas because they have a price gap in front of them. The market likes to retest these areas.
5- Equal high/low zones are the levels that the price creates to accumulate liquidity or fails to go beyond (especially during high volume hours). Failure or crossing of the level may give a reversal or continuation prediction.
Sample setup 1:
Sample setup 2:
Sample setup 3:
Cheerful trades…
Enjoy…

IFVG ExtendedThis indicator identifies and visualizes "Imbalance Fair Value Gaps" (IFVGs) on a price chart. It highlights these gaps, tracks their evolution, and signals when they are "filled" or "invalidated" by price action. The script is quite advanced, using custom types, arrays, and dynamic drawing.
1. Types and Variables
Custom Types:
lab: Stores label information (x, y, direction).
fvg: Stores Fair Value Gap data, including its boundaries, direction, state, labels, and other properties.
Arrays:
Four arrays track bullish and bearish FVGs, and their "invalidated" (filled) versions.
Signals:
Boolean variables to store if a bullish or bearish signal is triggered.
2. User Inputs and Parameters
Display Settings:
How many recent FVGs to show, signal preference (close or wick), ATR multiplier for gap size filtering, and colors for bullish/bearish/midline.
3. Chart Data
Price Data:
Open, high, low, close, and ATR (Average True Range) are stored for use in calculations.
4. Functions
label_maker:
Draws an up or down arrow label at a given point, colored for bullish or bearish.
fvg_manage:
Checks if any FVGs in the array have been "invalidated" (i.e., price has crossed their boundary). If so, moves them to the invalidated array.
inv_manage:
Manages invalidated FVGs, checking if a signal should be fired (i.e., price has reacted to the gap). Also removes old FVGs.
send_it:
Draws the FVGs and their labels on the chart, using boxes and lines for visualization.
5. Main Logic and Visualization
FVG Detection:
On each bar, checks for new bullish or bearish FVGs based on price action and ATR filter.
Adds new FVGs to the appropriate array.
FVG Management:
Updates the arrays, moves invalidated FVGs, and checks for signals.
Drawing:
On the last bar, clears all previous drawings and redraws the current FVGs and their labels.
6. Alerts
Alert Conditions:
Sets up alerts for when a bullish or bearish IFVG signal is triggered, so users can be notified.
Summary
In short:
This script automatically finds and tracks "Imbalance Fair Value Gaps" on your chart, highlights them, and alerts you when price interacts with them in a significant way. It uses advanced Pine Script features to manage and visualize these zones dynamically, helping traders spot potential reversal or continuation points based on gap theory

Fair Value Gap DetectorHow this indicator works:
It detects two types of FVGs:
Bullish FVG: Occurs when the low of the current candle is higher than the high of the candle from 2 bars ago (creates an upward gap)
Bearish FVG: Occurs when the high of the current candle is lower than the low of the candle from 2 bars ago (creates a downward gap)
Features:
Allows users to toggle both bullish and bearish FVG detection independently
Customizable colors for both bullish (default green) and bearish (default red) FVGs
Visualizes FVGs using:
Boxes that highlight the gap area (with 80% transparency)
Labels that mark each FVG ("Bull FVG" or "Bear FVG")
Visual representation:
Bullish FVGs are marked with green boxes and downward-pointing labels
Bearish FVGs are marked with red boxes and upward-pointing labels
This indicator can be useful for :
Identifying potential areas where price might return to
Finding potential support and resistance zones
Understanding market structure and momentum shifts

Inversion Fair Value Gap Screener | Flux Charts💎 GENERAL OVERVIEW
Introducing our new Inverse Fair Value Gap Screener! This screener can provide information about the latest Inverse Fair Value Gaps in up to 5 tickers. You can also customize the algorithm that finds the Inverse Fair Value Gaps and the styling of the screener.
Features of the new Inverse Fair Value Gap (IFVG) Screener :
Find Latest Inverse Fair Value Gaps Across 5 Tickers
Shows Their Information Of :
Latest Status
Number Of Retests
Consumption Percent
Volume
Customizable Algorithm / Styling
📌 HOW DOES IT WORK ?
A Fair Value Gap generally occur when there is an imbalance in the market. They can be detected by specific formations within the chart. An Inverse Fair Value Gap is when a FVG becomes invalidated, thus reversing the direction of the FVG.
IFVGs get consumed when a Close / Wick enters the IFVG zone. Check this example:
This screener then finds Fair Value Gaps across 5 different tickers, and shows the latest information about them.
Status ->
Far -> The current price is far away from the IFVG.
Approaching ⬆️/⬇️ -> The current price is approaching the IFVG, and the direction it's approaching from.
Inside -> The price is currently inside the IFVG.
Retests -> Retest means the price tried to invalidate the IFVG, but failed to do so. Here you can see how many times the price retested the IFVG.
Consumed -> IFVGs get consumed when a Close / Wick enters the IFVG zone. For example, if the price hits the middle of the IFVG zone, the zone is considered 50% consumed.
Volume -> Volume of a IFVG is essentially the volume of the bar that broke the original FVG that formed it.
🚩UNIQUENESS
This screener can detect latest Inverse Fair Value Gaps and give information about them for up to 5 tickers. This saves the user time by showing them all in a dashboard at the same time. The screener also uniquely shows information about the number of retests and the consumed percent of the IFVG, as well as it's volume. We believe that this extra information will help you spot reliable IFVGs easier.
⚙️SETTINGS
1. Tickers
You can set up to 5 tickers for the screener to scan Fair Value Gaps here. You can also enable / disable them and set their individual timeframes.
2. General Configuration
FVG Zone Invalidation -> Select between Wick & Close price for FVG Zone Invalidation.
IFVG Zone Invalidation -> Select between Wick & Close price for IFVG Zone Invalidation. This setting also switches the type for IFVG consumption.
Zone Filtering -> With "Average Range" selected, algorithm will find FVG zones in comparison with average range of last bars in the chart. With the "Volume Threshold" option, you may select a Volume Threshold % to spot FVGs with a larger total volume than average.
FVG Detection -> With the "Same Type" option, all 3 bars that formed the FVG should be the same type. (Bullish / Bearish). If the "All" option is selected, bar types may vary between Bullish / Bearish.
Detection Sensitivity -> You may select between Low, Normal or High FVG detection sensitivity. This will essentially determine the size of the spotted FVGs, with lower sensitivities resulting in spotting bigger FVGs, and higher sensitivities resulting in spotting all sizes of FVGs.

ICT iFVG Detector and Alert [by ote618]Description
This script detects ICT - fair value gaps (FVG) formed by price gaps between Candle 1 and Candle 3, then monitors the next 5 candles for an inverse fair value gap (iFVG).
What It Detects
Bullish FVG: When Candle 1 high is below Candle 3 low (BISI)
Bearish FVG: When Candle 1 low is above Candle 3 high (SIBI)
Once an FVG is detected, the script checks the next 5 candles:
A Bullish FVG becomes a Bearish IFVG if price closes below Candle 1 high
A Bearish FVG becomes a Bullish IFVG if price closes above Candle 1 low
Only the first bar that validates the FVG triggers the transition to an IFVG.
Visual Output
A shaded rectangle is plotted to mark the original FVG zone (from Candle 1 to Candle 3)
Color-coded:
Red for Bearish IFVG (validated Bullish IG)
Green for Bullish IFVG (validated Bearish IG)
The rectangle extends from Candle 1 to the validating bar
Alerts
You can receive alerts when an FVG becomes an IFVG:
Configurable to fire only on selected timeframes (1m, 5m, 15m, 60m)
Alerts include the direction and the chart timeframe
Settings
Enable Alerts For Timeframe: Choose which timeframe(s) trigger alerts
This tool helps traders identify inverse FVGs (iFVG), a useful ICT concept.

ICT HTF Liquidity Levels /w Alert [MsF]Japanese below / 日本語説明は英文の後にあります。
-------------------------
*This indicator is based on sbtnc's "HTF Liquidity Levels". It's a very cool indicator. thank you.
It has 3 functions: visualization of HTF liquidity (with alert), candle color change when displacement occurs, and MSB (market structure break) line display.
=== Function description ===
1. HTF liquidity (with alert)
Lines visualize the liquidity pools on the HTF bars. Alerts can be set for each TF's line.
Once the price reaches the line, the line is repaint.
To put it plainly, the old line disappears and a new line appears. The line that disappeared remains as a purged line. (It is also possible to hide the purged line with a parameter)
The alert will be triggered at the moment the line disappears. An alert will be issued when you touch the HTF's liquid pools where the loss is accumulated, so you can notice the stop hunting with the alert.
This alert is an original feature of this indicator.
The timeframe of the HTF can't modify. You can get Monthly, weekly, daily and H1 and H4.
Each timeframe displays the 3 most recent lines. By narrowing it down to 3, it is devised to make it easier to see visually. (This indicator original)
2. Displacement
Change the color display of the candlesticks when a bullish candle stick or bearish candle stick is attached. Furthermore, by enabling the "Require FVG" option, you can easily discover the FVG (Fair Value Gap). It is a very useful function for ICT trading.
3. MSB (market structure break)
Displays High/Low lines for the period specified by the parameter. It is useful for discovering BoS & CHoCH/MSS, which are important in ICT trading.
=== Parameter description ===
- HTF LIQUIDITY
- Daily … Daily line display settings (color, line width)
- Weekly … Weekly line display settings (color, line width)
- Monthly … Monthly line display settings (color, line width)
- INTRADAY LIQUIDITY
- 1H … 1H line display settings (color, line width)
- 4H … 4H line display settings (color, line width)
- PURGED LIQUIDITY … Display setting of the line once the candle reaches
- Show Purge Daily … Daily purged line display/non-display setting
- Show Purge Weekly … Weekly purged line display/non-display setting
- Show Purge Monthly … Monthly purged line display/non-display setting
- Show Purge 1H … 1H purged line display/non-display setting
- Show Purge 4H … 4H purged line display/non-display setting
- MARKET STRUCTURE BREAK - MBS
- Loopback … Period for searching High/Low
- DISPLACEMENT FOR FVG
- Require FVG … Draw only when FVG occurs
- Displacement Type … Displacement from open to close? or from high to low?
- Displacement Length … Period over which to calculate the standard deviation
- Displacement Strength … The larger the number, the stronger the displacement detected
-------------------------
このインジケータはsbtncさんの"HTF Liquidity Levels"をベースに作成しています。
上位足流動性の可視化(アラート付き)、変位発生時のローソク色変更、MSB(market structure break)ライン表示の3つの機能を有します。
<機能説明>
■上位足流動性の可視化
上位足の流動性の吹き溜まり(ストップが溜まっているところ)をラインで可視化します。ラインにはアラートを設定することが可能です。
一度価格がラインに到達するとそのラインは再描画されます。
平たく言うと、今までのラインが消えて新しいラインが出現する。という事です。
消えたラインはpurgeラインとして残ります。(パラメータでpurgeラインを非表示にすることも可能です)
アラートはラインが消える瞬間に発報します。上位足の損切り溜まってるところにタッチするとアラートを発報するので、アラートにてストップ狩りに気づくことができます。
このアラート発報については本インジケータオリジナルの機能となります。
表示可能な上位足のタイムフレームは固定です。月足、週足、日足およびH1とH4を表示することができます。
各タイムフレーム、直近から3つのラインを表示します。3つに絞ることで視覚的に見やすく工夫しています。(本インジケータオリジナル)
■変位発生時のローソク色変更
大きな陽線、陰線を付けた場合に、そのローソク足をカラー表示を変更します。
さらに"Require FVG"オプションを有効にすることで、FVG(Fair Value Gap)を容易に発見することができます。ICTトレードにを行うにあたり大変有用な機能となっています。
■MSB(market structure break)ライン表示
パラメータで指定した期間のHigh/Lowをライン表示します。ICTトレードで重要視しているBoS & CHoCH/MSSの発見に役立ちます。
<パラメータ説明>
- HTF LIQUIDITY
- Daily … 日足ライン表示設定(色、線幅)
- Weekly … 週足ライン表示設定(色、線幅)
- Monthly … 月足ライン表示設定(色、線幅)
- INTRADAY LIQUIDITY
- 1H … 1時間足ライン表示設定(色、線幅)
- 4H … 4時間足ライン表示設定(色、線幅)
- PURGED LIQUIDITY … 一度到達したラインの表示設定
- Show Purge Daily … 日足ライン表示/非表示設定
- Show Purge Weekly … 週足ライン表示/非表示設定
- Show Purge Monthly … 月足ライン表示/非表示設定
- Show Purge 1H … 1時間足ライン表示/非表示設定
- Show Purge 4H … 4時間足ライン表示/非表示設定
- MARKET STRUCTURE BREAK - MBS
- Loopback … High/Lowを探索する期間
- DISPLACEMENT FOR FVG
- Require FVG … FVG発生時のみ描画する
- Displacement Type … openからcloseまでの変位か?highからlowまでの変位か?
- Displacement Length … 標準偏差を計算する期間
- Displacement Strength … 変位の強さ(数字が大きいほど強い変位を検出)

PumpC PAC & MAsPumpC – PAC & MAs (Open Source)
A complete Price Action Candles (PAC) toolkit combining classical price action patterns (Fair Value Gaps, Inside Bars, Hammers, Inverted Hammers, and Volume Imbalances) with a flexible Moving Averages (MAs) module and an advanced bar-coloring system.
This script highlights supply/demand inefficiencies and micro-patterns with forward-extending boxes, recolors zones when mitigated, qualifies patterns with a global High-Volume filter, and ships with ready-to-use alerts. It works across intraday through swing trading on any market (e.g., NASDAQ:QQQ , $CME:ES1!, FX:EURUSD , BITSTAMP:BTCUSD ).
This is an open-source script. The description is detailed so users understand what the script does, how it works, and how to use it. It makes no performance claims and does not provide trade advice.
Acknowledgment & Credits
This script originates from the structural and box-handling logic found in the Super OrderBlock / FVG / BoS Tools by makuchaku & eFe. Their pioneering framework provided the base methods for managing arrays of boxes, extending zones forward, and recoloring once mitigated.
Building on that foundation, I have substantially expanded and adapted the code to create a unified Price Action Candles toolkit . This includes Al Brooks–inspired PAC logic, additional patterns like Inside Bars, Hammers, Inverted Hammers, and the new Volume Imbalance module, along with strong-bar coloring, close-threshold detection, a flexible global High-Volume filter, and a multi-timeframe Moving Averages system.
What it does
Fair Value Gaps (FVG) : Detects 3-bar displacement gaps, plots forward-extending boxes, and optionally recolors them once mitigated.
Inside Bars (IB) : Highlights bars fully contained within the prior candle’s range, with optional high-volume filter.
Hammers (H) & Inverted Hammers (IH) : Identifies rejection candles using configurable body/upper/lower wick thresholds. High-volume qualification optional.
Volume Imbalances (VI) : Detects inter-body gaps where one candle’s body does not overlap the prior candle’s body. Boxes extend forward until wick-based mitigation occurs (only after the two-bar formation completes). Alerts available for creation and mitigation.
Mitigation Recolor : Each pattern can flip to a mitigated color once price trades back through its vertical zone.
Moving Averages (MAs) : Four configurable EMAs/SMAs, with per-MA timeframe, length, color, and clutter-free plotting rules.
Strong Bar Coloring : Highlights bullish/bearish engulfing reversals with different colors for high-volume vs low-volume cases.
Close Threshold Bars : Marks candles that close in the top or bottom portion of their range, even if the body is small. Helps spot continuation pressure before a full trend bar forms.
Alerts : Notifications available for FVG+, FVG−, IB, H, IH, VI creation, and VI mitigation.
Connection to Al Brooks’ PAC teachings
This script reflects Al Brooks’ Price Action Candle methodology. PAC patterns like Inside Bars, Hammers, and Inverted Hammers are not trade signals on their own—they gain meaning in context of trend, failed breakouts, and effort vs. result.
By layering in volume imbalances, strong-bar reversals, and volume filters, this script focuses attention on the PACs that show true participation and conviction, aligning with Brooks’ emphasis on reading crowd psychology through price action.
Why the High-Volume filter matters
Volume is a key proxy for conviction. A PAC or VI formed on light volume can be misleading noise; one formed on above-average volume carries more weight.
Elevates Inside Bars that show absorption/compression with heavy activity.
Distinguishes Hammers that reject price aggressively vs. weak drifts.
Filters Inverted Hammers to emphasize true supply pressure.
Highlights VI zones where institutional order flow left inefficiencies.
Differentiates strong engulfing reversals from weaker, low-participation moves.
Inputs & Customization
Inputs are grouped logically for fast configuration:
High-Volume Filter : Global lookback & multiple, per-pattern toggles.
FVG : Visibility, mitigated recolor, box style/transparency, label controls.
IB : Visibility, require high volume, mitigated recolor, colors, label settings.
Hammer / IH : Visibility, require high volume, mitigated recolor, wick/body thresholds.
VI : Visibility, require high volume, mitigated recolor, box style, labels, mitigation alerts.
Strong Bars : Enable/disable, separate colors for high-volume and low-volume outcomes.
Close Threshold Bars : Customizable close thresholds, labels, optional count markers.
MAs : EMA/SMA type, per-MA toggle, length, timeframe, color.
Alerts
New Bullish FVG (+)
New Bearish FVG (−)
New Inside Bar (IB)
New Hammer (H)
New Inverted Hammer (IH)
New Volume Imbalance (VI)
VI Mitigated
Strong Bullish Engulfing / Bearish Engulfing (high- and low-volume variants)
Suggested workflow
Choose your market & timeframe (script works across equities, futures, FX, crypto).
Toggle only the PACs you actually trade. Assign distinct colors for clarity.
Use MAs for directional bias and higher timeframe structure.
Enable High-Volume filters when you want to emphasize conviction.
Watch mitigation recolors to see which levels/zones have been interacted with.
Use alerts selectively for setups aligned with your plan.
Originality
Builds upon Super OrderBlock / FVG / BoS Tools (makuchaku & eFe) for FVG/box framework.
Expanded into a unified PAC toolkit including IB, H, IH, and VI patterns.
Brooks-inspired design: Patterns contextualized with volume and trend, not isolated.
Flexible high-volume gating with per-pattern toggles.
New VI integration with wick-based mitigation.
Strong Bar Coloring differentiates conviction vs weak reversals.
MTF-aware MAs prevent clutter while providing structure.
Open-source: Transparent for learning, editing, and extension.
Disclaimer
For educational and informational purposes only. This script is not financial advice. Trading carries risk—always test thoroughly before live use.

[TehThomas] - Fair Value GapsThis script is designed to automatically detect and visualize Fair Value Gaps (FVGs) on your chart in a clean, intuitive, and highly responsive way. It’s built with active traders in mind, offering both dynamic updates and customization options that help you stay focused on price action without being distracted by outdated or irrelevant information.
What Are Fair Value Gaps?
Fair Value Gaps are areas on a chart where there’s an inefficiency in price, typically formed when price moves aggressively in one direction, leaving a gap between the wicks of consecutive candles. These gaps represent imbalanced price action where not all buy or sell orders were efficiently matched. As a result, they often become magnet zones where price returns later to "fill" the imbalance before continuing in its intended direction. Many traders use them as points of interest for entries, re-entries, or anticipating reversals and consolidations.
This concept is frequently used in Smart Money and ICT-based trading models, where understanding how price seeks efficiency is crucial to anticipating future moves. When combined with concepts like liquidity, displacement, and market structure, FVGs become powerful tools for technical decision-making.
Script Features & Functionality
1. Live Updating Gaps (Dynamic Shrinking)
One of the core features of this script is its ability to track and dynamically shrink Fair Value Gaps as price trades into them. Instead of leaving a static zone on your chart, the gap will adjust in real-time, reflecting the portion that has been filled. This gives you a much more accurate picture of remaining imbalance and avoids misleading zones.
2. Automatic Cleanup After Fill
Once price fully fills an FVG, the script automatically removes it from the chart. This helps keep your workspace clean and focused only on relevant price zones. There’s no need to manually manage your gaps, everything is handled behind the scenes to reduce clutter and distraction.
3. Static Mode Option
While dynamic updating is the default, some traders may prefer to keep the original size of the gap visible even after partial fills. For that reason, the script includes a toggle to switch from live-updating (shrinking) mode to static mode. In static mode, FVGs stay fixed from the moment they are drawn, giving you a more traditional visual reference point.
4. Multi-Timeframe Support (MTF)
You can now view higher timeframe FVGs, such as those from the 1H or 4H chart, while analyzing lower timeframes like the 5-minute. This allows you to see key imbalances from broader market context without having to flip between charts. FVGs from higher timeframes will be drawn distinctly so you can differentiate them at a glance.
5. Cleaner Visualization
The script is designed with clarity in mind. All drawings are streamlined, and filled gaps are removed to maintain a minimal, distraction-free chart. This makes it easier to combine this tool with other indicators or price-action-based strategies without overloading your workspace.
6. Suitable for All Market Types
This script can be used on any asset that displays candlestick-based price action — including crypto, forex, indices, and stocks. Whether you're scalping low-timeframe setups or swing trading with a higher timeframe bias, FVGs remain a useful concept and this script adapts to your trading style.
Use Case Examples
On a 5-minute chart, display 1-hour FVGs to catch major imbalance zones during intraday trading.
Combine the FVGs with liquidity levels and inducement patterns to build ICT-style trade setups.
Use live-updating gaps to monitor in-progress fills and evaluate whether a zone still holds validity.
Set the script to static mode to perform backtesting or visual replay with historical setups.
Final Notes
Fair Value Gaps are not a standalone trading signal, but when used with market structure, liquidity, displacement, and order flow concepts, they provide high-probability trade locations that align with institutional-style trading models. This script simplifies the visualization of those zones so you can react faster, stay focused on clean setups, and eliminate unnecessary distractions.
Whether you’re trading high volatility breakouts or patiently waiting for retracements into unfilled imbalances, this tool is designed to support your edge with precision and flexibility.

SMC+The "SMC+" indicator is a comprehensive tool designed to overlay key Smart Money Concepts (SMC) levels, support/resistance zones, order blocks (OB), fair value gaps (FVG), and trap detection on your TradingView chart. It aims to assist traders in identifying potential areas of interest based on price action, swing structures, and volume dynamics across multiple timeframes. This indicator is fully customizable, allowing users to adjust lookback periods, colors, opacity, and sensitivity to suit their trading style.
Key Components and Functionality
1. Key Levels (Support and Resistance)
This section plots horizontal lines representing support and resistance levels based on highs and lows over three distinct lookback periods, plus daily nearest levels.
Short-Term Lookback Period (Default: 20 bars)
Plots the highest high (short_high) and lowest low (short_low) over the specified period.
Visualized as dotted lines with customizable colors (Short-Term Resistance Color, Short-Term Support Color) and opacity (Short-Term Resistance Opacity, Short-Term Support Opacity).
Adjustment Tip: Increase the lookback (e.g., to 30-50) for less frequent but stronger levels on higher timeframes, or decrease (e.g., to 10-15) for scalping on lower timeframes.
Long-Term Lookback Period (Default: 50 bars)
Plots broader support (long_low) and resistance (long_high) levels using a solid line style.
Customizable via Long-Term Resistance Color, Long-Term Support Color, and their respective opacity settings.
Adjustment Tip: Extend to 100-200 bars for swing trading or major trend analysis on daily/weekly charts.
Extra-Long Lookback Period (Default: 100 bars)
Identifies significant historical highs (extra_long_high) and lows (extra_long_low) with dashed lines.
Configurable with Extra-Long Resistance Color, Extra-Long Support Color, and opacity settings.
Adjustment Tip: Use 200-500 bars for monthly charts to capture macro-level key zones.
Daily Nearest Resistance and Support Levels
Dynamically calculates the nearest resistance (daily_res_level) and support (daily_sup_level) based on the current day’s price action relative to historical highs and lows.
Displayed with Daily Resistance Color and Daily Support Color (with opacity options).
Adjustment Tip: Works best on intraday charts (e.g., 15m, 1h) to track daily pivots; combine with volume profile for confirmation.
How It Works: These levels update dynamically as new highs/lows form, providing a visual guide to potential reversal or breakout zones.
2. SMC Inputs (Smart Money Concepts)
This section identifies swing structures, order blocks, fair value gaps, and entry signals based on SMC principles.
SMC Swing Lookback Period (Default: 12 bars)
Defines the period for detecting swing highs (smc_swing_high) and lows (smc_swing_low).
Adjustment Tip: Increase to 20-30 for smoother swings on higher timeframes; reduce to 5-10 for faster signals on lower timeframes.
Minimum Swing Size (%) (Default: 0.5%)
Filters out minor price movements to focus on significant swings.
Adjustment Tip: Raise to 1-2% for volatile markets (e.g., crypto) to avoid noise; lower to 0.2-0.3% for forex pairs with tight ranges.
Order Block Sensitivity (Default: 1.0)
Scales the size of detected order blocks (OBs) for bullish reversal (smc_ob_bull), bearish reversal (smc_ob_bear), and continuation (smc_cont_ob).
Visuals include customizable colors, opacity, border thickness, and blinking effects (e.g., SMC Bullish Reversal OB Color, SMC Bearish Reversal OB Blink Thickness).
Adjustment Tip: Increase to 1.5-2.0 for wider OBs in choppy markets; keep at 1.0 for precision in trending conditions.
Minimum FVG Size (%) (Default: 0.3%)
Sets the minimum gap size for Fair Value Gaps (fvg_high, fvg_low), displayed as boxes with Fair Value Gap Color and FVG Opacity.
Adjustment Tip: Increase to 0.5-1% for larger, more reliable gaps; decrease to 0.1-0.2% for scalping smaller inefficiencies.
How It Works:
Bullish Reversal OB: Detects a bearish candle followed by a bullish break, marking a potential demand zone.
Bearish Reversal OB: Identifies a bullish candle followed by a bearish break, marking a supply zone.
Continuation OB: Spots strong bullish momentum after a prior high, indicating a continuation zone.
FVG: Highlights bullish gaps where price may retrace to fill.
Entry Signals: Plots triangles (SMC Long Entry) when price retests an OB with a liquidity sweep or break of structure (BOS).
3. Trap Inputs
This section detects potential bull and bear traps based on price action, volume, and key level rejections.
Min Down Move for Bear Trap (%) (Default: 1.0%)
Sets the minimum drop required after a bearish OB to qualify as a trap.
Visualized with Bear Trap Color, Bear Trap Opacity, and blinking borders.
Adjustment Tip: Increase to 2-3% for stronger traps in trending markets; lower to 0.5% for ranging conditions.
Min Up Move for Bull Trap (%) (Default: 1.0%)
Sets the minimum rise required after a bullish OB to flag a trap.
Customizable with Bull Trap Color, Bull Trap Border Thickness, etc.
Adjustment Tip: Adjust similarly to bear traps based on market volatility.
Volume Lookback for Traps (Default: 5 bars)
Compares current volume to a moving average (avg_volume) to filter low-volume traps.
Adjustment Tip: Increase to 10-20 for confirmation on higher timeframes; reduce to 3 for intraday sensitivity.
How It Works:
Bear Trap: Triggers when price drops significantly after a bearish OB but reverses up with low volume or support rejection.
Bull Trap: Activates when price rises after a bullish OB but fails with low volume or resistance rejection.
Boxes highlight trap zones, resetting when price breaks out.
4. Visual Customization
Line Width (Default: 2)
Adjusts thickness of support/resistance lines.
Tip: Increase to 3-4 for visibility on cluttered charts.
Blink On (Default: Close)
Sets whether OB/FVG borders blink based on Open or Close price interaction.
Tip: Use "Open" for intraday precision; "Close" for confirmed reactions.
Colors and Opacity: Each element (OBs, FVGs, traps, key levels) has customizable colors, opacity (0-100), border thickness (1-5 or 1-7), and blink effects for dynamic visualization.
How to Use SMC+
Setup: Apply the indicator to any chart and adjust inputs based on your timeframe and market.
Key Levels: Watch for price reactions at short, long, extra-long, or daily levels for potential reversals or breakouts.
SMC Signals: Look for entry signals (triangles) near OBs or FVGs, confirmed by liquidity sweeps or BOS.
Traps: Avoid false breakouts by monitoring trap boxes, especially near key levels with low volume.
Notes:
This indicator is a visual aid and does not guarantee trading success. Combine it with other analysis tools and risk management strategies.
Performance may vary across markets and timeframes; test settings thoroughly before use.
For optimal results, experiment with lookback periods and sensitivity settings to match your trading style.
The default settings are optimal for 1 minute and 10 second time frames for small cap low float stocks.
Continuation OB are Blue.
Bullish Reversal OB color is Green
Bearish Reversal OB color is Red
FVG color is purple
Bear Trap OB is red with a green border and often appears with a Bearish Reversal OB signaling caution to a short position.
Bull trap OB is green with a Red border signaling caution to a long position.
All active OB area are highlighted and solid in color while other non active OB area are dimmed.
My personal favorite setups are when we have an active bullish reversal with an active FVG along with an active Continuation OB.
Another personal favorite is the Bearish reversal OB signaling an end to a recent uptrend.
The Trap OB detection are also a unique and Original helpful source of information.
The OB have a white boarder by default that are colored black giving a simulated blinking effect when price is acting in that zone.
The Trap OB border are colored with respect to direction of intended trap, all of which can be customized to personal style.
All vaild OB zones are shown compact in size ,a unique and original view until its no longer valid.

Force Volume GradientThis Pine Script is a technical indicator designed for trading platforms, specifically TradingView. It plots the Force Volume Gradient (FVG) and generates buy/sell signals based on the crossover of the FVG line and a signal line.
Key Components:
Force Index: Calculates the exponential moving average (EMA) of the product of the close price and volume.
Force Volume Gradient (FVG): Calculates the EMA of the Force Index.
Signal Line: A simple moving average (SMA) of the FVG.
Buy/Sell Signals: Generated when the FVG line crosses above/below the signal line.
How it Works:
The script calculates the Force Index, which measures the amount of energy or "force" behind price movements.
The FVG is then calculated by applying an EMA to the Force Index, smoothing out the values.
The signal line is a SMA of the FVG, providing a benchmark for buy/sell signals.
When the FVG line crosses above the signal line, a buy signal is generated. Conversely, when the FVG line crosses below the signal line, a sell signal is generated.
Trading Strategy:
This script can be used as a momentum indicator to identify potential buying or selling opportunities. Traders can use the buy/sell signals as entry/exit points, or combine the FVG with other indicators to create a more comprehensive trading strategy.
Customization:
Users can adjust the input parameters, such as the length of the Force Index and signal line, to suit their individual trading preferences.

Price Action Analyst [OmegaTools]Price Action Analyst (PAA) is an advanced trading tool designed to assist traders in identifying key price action structures such as order blocks, market structure shifts, liquidity grabs, and imbalances. With its fully customizable settings, the script offers both novice and experienced traders insights into potential market movements by visually highlighting premium/discount zones, breakout signals, and significant price levels.
This script utilizes complex logic to determine significant price action patterns and provides dynamic tools to spot strong market trends, liquidity pools, and imbalances across different timeframes. It also integrates an internal backtesting function to evaluate win rates based on price interactions with supply and demand zones.
The script combines multiple analysis techniques, including market structure shifts, order block detection, fair value gaps (FVG), and ICT bias detection, to provide a comprehensive and holistic market view.
Key Features:
Order Block Detection: Automatically detects order blocks based on price action and strength analysis, highlighting potential support/resistance zones.
Market Structure Analysis: Tracks internal and external market structure changes with gradient color-coded visuals.
Liquidity Grabs & Breakouts: Detects potential liquidity grab and breakout areas with volume confirmation.
Fair Value Gaps (FVG): Identifies bullish and bearish FVGs based on historical price action and threshold calculations.
ICT Bias: Integrates ICT bias analysis, dynamically adjusting based on higher-timeframe analysis.
Supply and Demand Zones: Highlights supply and demand zones using customizable colors and thresholds, adjusting dynamically based on market conditions.
Trend Lines: Automatically draws trend lines based on significant price pivots, extending them dynamically over time.
Backtesting: Internal backtesting engine to calculate the win rate of signals generated within supply and demand zones.
Percentile-Based Pricing: Plots key percentile price levels to visualize premium, fair, and discount pricing zones.
High Customizability: Offers extensive user input options for adjusting zone detection, color schemes, and structure analysis.
User Guide:
Order Blocks: Order blocks are significant support or resistance zones where strong buyers or sellers previously entered the market. These zones are detected based on pivot points and engulfing price action. The strength of each block is determined by momentum, volume, and liquidity confirmations.
Demand Zones: Displayed in shades of blue based on their strength. The darker the color, the stronger the zone.
Supply Zones: Displayed in shades of red based on their strength. These zones highlight potential resistance areas.
The zones will dynamically extend as long as they remain valid. Users can set a maximum number of order blocks to be displayed.
Market Structure: Market structure is classified into internal and external shifts. A bullish or bearish market structure break (MSB) occurs when the price moves past a previous high or low. This script tracks these breaks and plots them using a gradient color scheme:
Internal Structure: Short-term market structure, highlighting smaller movements.
External Structure: Long-term market shifts, typically more significant.
Users can choose how they want the structure to be visualized through the "Market Structure" setting, choosing from different visual methods.
Liquidity Grabs: The script identifies liquidity grabs (false breakouts designed to trap traders) by monitoring price action around highs and lows of previous bars. These are represented by diamond shapes:
Liquidity Buy: Displayed below bars when a liquidity grab occurs near a low.
Liquidity Sell: Displayed above bars when a liquidity grab occurs near a high.
Breakouts: Breakouts are detected based on strong price momentum beyond key levels:
Breakout Buy: Triggered when the price closes above the highest point of the past 20 bars with confirmation from volume and range expansion.
Breakout Sell: Triggered when the price closes below the lowest point of the past 20 bars, again with volume and range confirmation.
Fair Value Gaps (FVG): Fair value gaps (FVGs) are periods where the price moves too quickly, leaving an unbalanced market condition. The script identifies these gaps:
Bullish FVG: When there is a gap between the low of two previous bars and the high of a recent bar.
Bearish FVG: When a gap occurs between the high of two previous bars and the low of the recent bar.
FVGs are color-coded and can be filtered by their size to focus on more significant gaps.
ICT Bias: The script integrates the ICT methodology by offering an auto-calculated higher-timeframe bias:
Long Bias: Suggests the market is in an uptrend based on higher timeframe analysis.
Short Bias: Indicates a downtrend.
Neutral Bias: Suggests no clear directional bias.
Trend Lines: Automatic trend lines are drawn based on significant pivot highs and lows. These lines will dynamically adjust based on price movement. Users can control the number of trend lines displayed and extend them over time to track developing trends.
Percentile Pricing: The script also plots the 25th percentile (discount zone), 75th percentile (premium zone), and a fair value price. This helps identify whether the current price is overbought (premium) or oversold (discount).
Customization:
Zone Strength Filter: Users can set a minimum strength threshold for order blocks to be displayed.
Color Customization: Users can choose colors for demand and supply zones, market structure, breakouts, and FVGs.
Dynamic Zone Management: The script allows zones to be deleted after a certain number of bars or dynamically adjusts zones based on recent price action.
Max Zone Count: Limits the number of supply and demand zones shown on the chart to maintain clarity.
Backtesting & Win Rate: The script includes a backtesting engine to calculate the percentage of respect on the interaction between price and demand/supply zones. Results are displayed in a table at the bottom of the chart, showing the percentage rating for both long and short zones. Please note that this is not a win rate of a simulated strategy, it simply is a measure to understand if the current assets tends to respect more supply or demand zones.
How to Use:
Load the script onto your chart. The default settings are optimized for identifying key price action zones and structure on intraday charts of liquid assets.
Customize the settings according to your strategy. For example, adjust the "Max Orderblocks" and "Strength Filter" to focus on more significant price action areas.
Monitor the liquidity grabs, breakouts, and FVGs for potential trade opportunities.
Use the bias and market structure analysis to align your trades with the prevailing market trend.
Refer to the backtesting win rates to evaluate the effectiveness of the zones in your trading.
Terms & Conditions:
By using this script, you agree to the following terms:
Educational Purposes Only: This script is provided for informational and educational purposes and does not constitute financial advice. Use at your own risk.
No Warranty: The script is provided "as-is" without any guarantees or warranties regarding its accuracy or completeness. The creator is not responsible for any losses incurred from the use of this tool.
Open-Source License: This script is open-source and may be modified or redistributed in accordance with the TradingView open-source license. Proper credit to the original creator, OmegaTools, must be maintained in any derivative works.

Fair Value Gaps
Introducing the Fair Value Gaps (FVG) Indicator by OmegaTools, a distinctive and analytical tool designed for TradingView. This script meticulously identifies and visualizes fair value gaps within the market, offering traders a nuanced understanding of potential price movement areas that are not immediately apparent through traditional analysis.
Concept and Methodology:
Fair Value Gaps are identified as areas on a chart where the price has skipped over, leaving a 'gap' that has not been filled. These gaps often occur due to sudden market movements triggered by news events, changes in market sentiment, or large orders that move the price significantly. The FVG Indicator detects these gaps by analyzing price action and identifying discrepancies between high and low prices over a specified period. This approach is rooted in the belief that markets tend to return to these unfilled spaces, providing potential opportunities for traders.
How It Works:
The indicator scans the chart for gaps between the high of one session and the low of the next (or vice versa), marking these gaps visually for easy identification.
Users can customize the lookback period to adjust the sensitivity of the indicator to recent versus historical data.
The FVG Indicator employs color-coding to distinguish between bullish and bearish gaps, allowing traders to quickly gauge market sentiment around these gaps.
Using the FVG Indicator:
Apply the indicator to any chart on TradingView and adjust the input settings, including the extension of FVGs and aesthetic preferences like color, to suit your analysis style.
Use the visual cues provided by the FVG Indicator to identify potential areas where the market may move to fill the gaps.
Combine the insights from the FVG Indicator with other technical analysis tools or fundamental analysis to validate potential trading opportunities.
Originality and Usefulness:
The FVG Indicator stands out due to its focused approach to identifying and visualizing fair value gaps, a concept that is often overlooked in conventional market analysis. By providing a clear visual representation of these gaps, the indicator adds depth to market analysis, aiding in the identification of potential price reversal zones or continuation signals.
Disclaimer and Responsible Use:
The financial markets are complex and unpredictable. The FVG Indicator is designed to offer analytical insights and should be used as part of a comprehensive trading strategy. It does not guarantee profits or predict market movements with absolute certainty. Traders are encouraged to use this tool judiciously, alongside proper risk management practices. Remember, past performance does not guarantee future results, and trading involves risks, including the potential loss of investment.
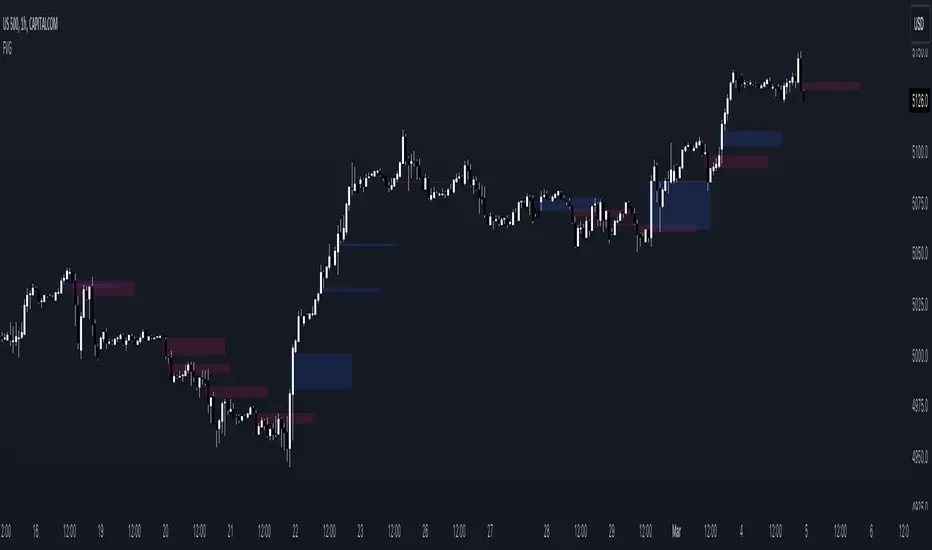
TrendFriendOverview
TrendFriend (TF) combines various technical analysis components, including trend calculations, moving averages, RSI signals, and Fair Value Gaps (FVG) detection to determine trend reversal and continuation points. The FVG feature identifies potential consolidation periods and displays mitigation levels.
Features
Trend Analysis: Utilizes short and long-term Running Moving Averages (RMA) to identify trends.
Average True Range (ATR): Plots ATR to depict market volatility.
RSI Signals: Calculates RSI and provides buy/sell signals based on RSI conditions.
Fair Value Gaps (FVG): Detects FVG patterns and offers options for customization, including dynamic FVG, mitigation levels, and auto threshold.
Usage
Buy Signals: Generated based on pullback conditions, contra-buy signals, and crossovers of specified moving averages.
Sell Signals: Generated based on pullback conditions, contra-sell signals, and crossunders of specified moving averages.
Visualization: FVG areas are visually represented on the chart, and unmitigated levels can be displayed.
Configuration
Adjustable parameters for trend periods, ATR length, RSI settings, FVG threshold, and display preferences.
Dynamic FVG detection and mitigation level visualization can be enabled/disabled.
Usage Example
Trend Analysis: Identify trends with short and long-term moving averages.
RSI Signals: Interpret RSI signals for potential reversals.
FVG Detection: Visualize Fair Value Gaps and mitigation levels on the chart.
Buy/Sell Signals: Receive alerts for buy/sell signals based on specified conditions.
Disclaimer
This Pine Script code is subject to the terms of the Mozilla Public License 2.0. Use this code at your own risk, and always conduct additional analysis before making trading decisions.
Author
Author: devoperator84
License: Mozilla Public License 2.0
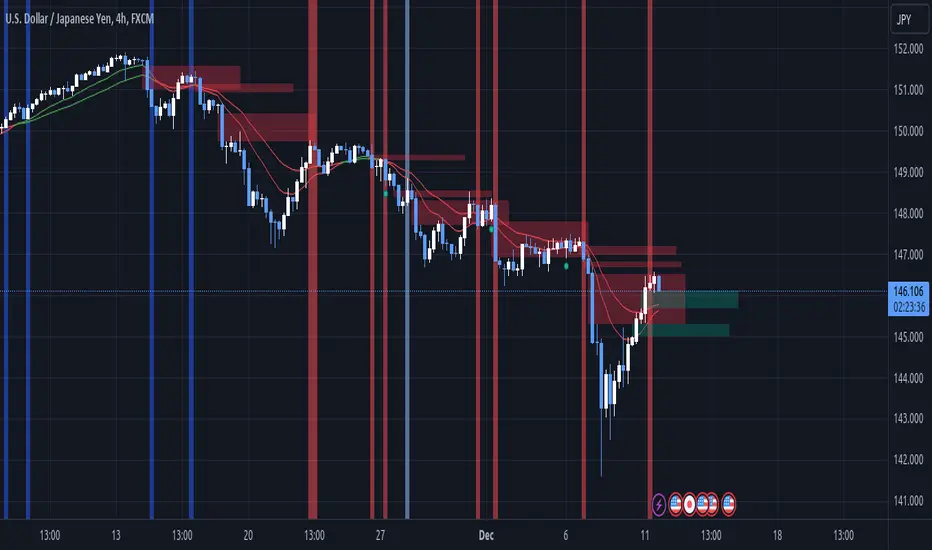
Liquidity Engulfing & Displacement [MsF]Japanese below / 日本語説明は英文の後にあります。
-------------------------
*This indicator is based on upslidedown's "Liquidity Engulfing Candles ". It's a very cool indicator. thank you.
It has 2 functions: show the Liquidity Engulfing on HTF and candle color change when displacement occurs.
=== Function description ===
1. Liquidity Engulfing on HTF
This indicator gives Liquidity Engulfing signals not only for the current candle, but also for H4 and H1 on HTF.
You can use that a bullish engulfing on H1 is a BOS on m5 and on H4 is a BOS on m15. It uses the theory of stop hunt from ICT.
Also, It's possible to fire alert.
2. Displacement
Change the color display of the candlesticks when a bullish candleStick or bearish candleStick is attached. Furthermore, by enabling the "Require FVG" option, you can easily discover the FVG (Fair Value Gap). It is a very useful function for ICT trading.
When H1 candle takes liquidity from one side and moves with an explosive move to the other side of the previous candle (displacement), it creates break of market structure on M5. Entry on discount FVG or OTE with stop loss at or below the stop hunt wick.
=== Parameter description ===
- Liquidity engulfing candles(LEC) SETTING
- Show H1 LEC … Whether to show LEC for H1
- Show H4 LEC … Whether to show LEC for H4
- Show Current LEC … Whether to show LEC for current timeframe
- Apply Stop Hunt Wick Filter … Require candle wick into prior candle retracement zone
- Apply Close Filter … Require LL/HH on candle in order to print a valid engulfing signal
- DISPLACEMENT SETTING
- Require FVG … Draw only when FVG occurs
- Displacement Type … Displacement from open to close? or from high to low?
- Displacement Length … Period over which to calculate the standard deviation
- Displacement Strength … The larger the number, the stronger the displacement detected
-------------------------
2つの機能があります: 上位足のLiquidity engulfing(流動性獲得)を表示することと、大きな変位が発生したときにローソク足の色を変更することです。
=== 機能説明 ===
1. 上位足のLiquidity engulfing
このインジケーターは、現在のローソク足だけでなく、上位足の H4 および H1 に対してもLiquidity engulfingシグナルを提供します。
H1はm5、H4はm15での使用を推奨します。これはICTのストップハント理論を活用しています。また、アラートを発することも可能です。
2. 変位(DISPLACEMENT)
大きな陽線、陰線を付けた場合に、そのローソク足をカラー表示を変更します。
さらに"Require FVG"オプションを有効にすることで、FVG(Fair Value Gap)を容易に発見することができます。ICTトレードにを行うにあたり大変有用な機能となっています。
=== パラメータの説明 ===
- Liquidity engulfing candles(LEC) SETTING
- Show H1 LEC … H1のLECを表示するかどうか
- Show H4 LEC … H4のLECを表示するかどうか
- Show Current LEC … 現在の期間の LEC を表示するかどうか
- Apply Stop Hunt Wick Filter … ハラミ足、もしくは包み足になっている場合のみに検知させる
- Apply Close Filter … 1つ前のローソクよりも終値で超えていた場合のみに検知させる
- DISPLACEMENT SETTING
- Require FVG … FVG発生時のみ描画する
- Displacement Type … openからcloseまでの変位か?highからlowまでの変位か?
- Displacement Length … 標準偏差を計算する期間
- Displacement Strength … 変位の強さ(数字が大きいほど強い変位を検出)

ICT Concepts [LuxAlgo]The ICT Concepts indicator regroups core concepts highlighted by trader and educator "The Inner Circle Trader" (ICT) into an all-in-one toolkit. Features include Market Structure (MSS & BOS), Order Blocks, Imbalances, Buyside/Sellside Liquidity, Displacements, ICT Killzones, and New Week/Day Opening Gaps.
🔶 SETTINGS
🔹 Mode
When Present is selected, only data of the latest 500 bars are used/visualized, except for NWOG/NDOG
🔹 Market Structure
Enable/disable Market Structure.
Length: will set the lookback period/sensitivity.
In Present Mode only the latest Market Structure trend will be shown, while in Historical Mode, previous trends will be shown as well:
You can toggle MSS/BOS separately and change the colors:
🔹 Displacement
Enable/disable Displacement.
🔹 Volume Imbalance
Enable/disable Volume Imbalance.
# Visible VI's: sets the amount of visible Volume Imbalances (max 100), color setting is placed at the side.
🔹 Order Blocks
Enable/disable Order Blocks.
Swing Lookback: Lookback period used for the detection of the swing points used to create order blocks.
Show Last Bullish OB: Number of the most recent bullish order/breaker blocks to display on the chart.
Show Last Bearish OB: Number of the most recent bearish order/breaker blocks to display on the chart.
Color settings.
Show Historical Polarity Changes: Allows users to see labels indicating where a swing high/low previously occurred within a breaker block.
Use Candle Body: Allows users to use candle bodies as order block areas instead of the full candle range.
Change in Order Blocks style:
🔹 Liquidity
Enable/disable Liquidity.
Margin: sets the sensitivity, 2 points are fairly equal when:
'point 1' < 'point 2' + (10 bar Average True Range / (10 / margin)) and
'point 1' > 'point 2' - (10 bar Average True Range / (10 / margin))
# Visible Liq. boxes: sets the amount of visible Liquidity boxes (max 50), this amount is for Sellside and Buyside boxes separately.
Colour settings.
Change in Liquidity style:
🔹 Fair Value Gaps
Enable/disable FVG's.
Balance Price Range: this is the overlap of latest bullish and bearish Fair Value Gaps.
By disabling Balance Price Range only FVGs will be shown.
Options: Choose whether you wish to see FVG or Implied Fair Value Gaps (this will impact Balance Price Range as well)
# Visible FVG's: sets the amount of visible FVG's (max 20, in the same direction).
Color settings.
Change in FVG style:
🔹 NWOG/NDOG
Enable/disable NWOG; color settings; amount of NWOG shown (max 50).
Enable/disable NDOG ; color settings; amount of NDOG shown (max 50).
🔹 Fibonacci
This tool connects the 2 most recent bullish/bearish (if applicable) features of your choice, provided they are enabled.
3 examples (FVG, BPR, OB):
Extend lines -> Enabled (example OB):
🔹 Killzones
Enable/disable all or the ones you need.
Time settings are coded in the corresponding time zones.
🔶 USAGE
By default, the indicator displays each feature relevant to the most recent price variations in order to avoid clutter on the chart & to provide a very similar experience to how a user would contruct ICT Concepts by hand.
Users can use the historical mode in the settings to see historical market structure/imbalances. The ICT Concepts indicator has various use cases, below we outline many examples of how a trader could find usage of the features together.
In the above image we can see price took out Sellside liquidity, filled two bearish FVGs, a market structure shift, which then led to a clean retest of a bullish FVG as a clean setup to target the order block above.
Price then fills the OB which creates a breaker level as seen in yellow.
Broken OBs can be useful for a trader using the ICT Concepts indicator as it marks a level where orders have now been filled, indicating a solidified level that has proved itself as an area of liquidity. In the image above we can see a trade setup using a broken bearish OB as a potential entry level.
We can see the New Week Opening Gap (NWOG) above was an optimal level to target considering price may tend to fill / react off of these levels according to ICT.
In the next image above, we have another example of various use cases where the ICT Concepts indicator hypothetically allow traders to find key levels & find optimal entry points using market structure.
In the image above we can see a bearish Market Structure Shift (MSS) is confirmed, indicating a potential trade setup for targeting the Balanced Price Range imbalance (BPR) below with a stop loss above the buyside liquidity.
Although what we are demonstrating here is a hindsight example, it shows the potential usage this toolkit gives you for creating trading plans based on ICT Concepts.
Same chart but playing out the history further we can see directly after price came down to the Sellside liquidity & swept below it...
Then by enabling IFVGs in the settings, we can see the IFVG retests alongside the Sellside & Buyside liquidity acting in confluence.
Which allows us to see a great bullish structure in the market with various key levels for potential entries.
Here we can see a potential bullish setup as price has taken out a previous Sellside liquidity zone and is now retesting a NWOG + Volume Imbalance.
Users also have the option to display Fibonacci retracements based on market structure, order blocks, and imbalance areas, which can help place limit/stop orders more effectively as well as finding optimal points of interest beyond what the primary ICT Concepts features can generate for a trader.
In the above image we can see the Fibonacci extension was selected to be based on the NWOG giving us some upside levels above the buyside liquidity.
🔶 DETAILS
Each feature within the ICT Concepts indicator is described in the sub sections below.
🔹 Market Structure
Market structure labels are constructed from price breaking a prior swing point. This allows a user to determine the current market trend based on the price action.
There are two types of Market Structure labels included:
Market Structure Shift (MSS)
Break Of Structure (BOS)
A MSS occurs when price breaks a swing low in an uptrend or a swing high in a downtrend, highlighting a potential reversal. This is often labeled as "CHoCH", but ICT specifies it as MSS.
On the other hand, BOS labels occur when price breaks a swing high in an uptrend or a swing low in a downtrend. The occurrence of these particular swing points is caused by retracements (inducements) that highlights liquidity hunting in lower timeframes.
🔹 Order Blocks
More significant market participants (institutions) with the ability of placing large orders in the market will generally place a sequence of individual trades spread out in time. This is referred as executing what is called a "meta-order".
Order blocks highlight the area where potential meta-orders are executed. Bullish order blocks are located near local bottoms in an uptrend while bearish order blocks are located near local tops in a downtrend.
When price mitigates (breaks out) an order block, a breaker block is confirmed. We can eventually expect price to trade back to this breaker block offering a new trade opportunity.
🔹 Buyside & Sellside Liquidity
Buyside / Sellside liquidity levels highlight price levels where market participants might place limit/stop orders.
Buyside liquidity levels will regroup the stoploss orders of short traders as well as limit orders of long traders, while Sellside liquidity levels will regroup the stoploss orders of long traders as well as limit orders of short traders.
These levels can play different roles. More informed market participants might view these levels as source of liquidity, and once liquidity over a specific level is reduced it will be found in another area.
🔹 Imbalances
Imbalances highlight disparities between the bid/ask, these can also be defined as inefficiencies, which would suggest that not all available information is reflected by the price and would as such provide potential trading opportunities.
It is common for price to "rebalance" and seek to come back to a previous imbalance area.
ICT highlights multiple imbalance formations:
Fair Value Gaps: A three candle formation where the candle shadows adjacent to the central candle do not overlap, this highlights a gap area.
Implied Fair Value Gaps: Unlike the fair value gap the implied fair value gap has candle shadows adjacent to the central candle overlapping. The gap area is constructed from the average between the respective shadow and the nearest extremity of their candle body.
Balanced Price Range: Balanced price ranges occur when a fair value gap overlaps a previous fair value gap, with the overlapping area resulting in the imbalance area.
Volume Imbalance: Volume imbalances highlight gaps between the opening price and closing price with existing trading activity (the low/high overlap the previous high/low).
Opening Gap: Unlike volume imbalances opening gaps highlight areas with no trading activity. The low/high does not reach previous high/low, highlighting a "void" area.
🔹 Displacement
Displacements are scenarios where price forms successive candles of the same sentiment (bullish/bearish) with large bodies and short shadows.
These can more technically be identified by positive auto correlation (a close to open change is more likely to be followed by a change of the same sign) as well as volatility clustering (large changes are followed by large changes).
Displacements can be the cause for the formation of imbalances as well as market structure, these can be caused by the full execution of a meta order.
🔹 Kill Zones
Killzones represent different time intervals that aims at offering optimal trade entries. Killzones include:
- New York Killzone (7:9 ET)
- London Open Killzone (2:5 ET)
- London Close Killzone (10:12 ET)
- Asian Killzone (20:00 ET)
🔶 Conclusion & Supplementary Material
This script aims to emulate how a trader would draw each of the covered features on their chart in the most precise representation to how it's actually taught by ICT directly.
There are many parallels between ICT Concepts and Smart Money Concepts that we released in 2022 which has a more general & simpler usage:
ICT Concepts, however, is more specifically aligned toward the community's interpretation of how to analyze price 'based on ICT', rather than displaying features to have a more classic interpretation for a technical analyst.

TRI - Smart Zones============================================================================
# TRI - SMART ZONES v2.0
## Professional Smart Money Concepts Indicator for Pine Script v6
============================================================================
## 📊 OVERVIEW
**TRI - Smart Zones** is a comprehensive Smart Money Concepts indicator that
combines multiple institutional trading concepts into a single, powerful tool.
Built with Pine Script v6 for optimal performance and reliability.
## 🎯 CORE FEATURES
### **Fair Value Gaps (FVG)**
- **Detection**: Automatic identification of price imbalances
- **Types**: Bullish and Bearish Fair Value Gaps
- **Threshold**: Customizable gap size requirements (0.1% default)
- **Extension**: Configurable zone projection length
- **Mitigation**: Real-time tracking of gap fills
### **Order Blocks (OB)**
- **Detection**: Volume-based institutional footprint identification
- **Types**: Bullish and Bearish Order Blocks
- **Method**: Pivot-based volume analysis with configurable lookback
- **Validation**: Market structure confirmation required
- **Extension**: Adjustable zone projection
### **BSL/SSL Liquidity Levels**
- **Multi-Timeframe**: Automatic higher timeframe reference
- **Dynamic**: Real-time level updates and extensions
- **Visual**: Clear line markings with timeframe labels
- **Smart**: Adaptive timeframe selection based on current chart
### **Fibonacci Extensions**
- **ZigZag Integration**: Advanced pivot point detection
- **Levels**: Customizable Fibonacci ratios (38.2%, 61.8%, 100%, 161.8%)
- **Projection**: Dynamic extension from swing points
- **Visual**: Subtle dashed lines with level/price labels
### **Smart Dashboard**
- **Zone Statistics**: Real-time FVG and OB counts
- **Success Rates**: Mitigation percentages for each zone type
- **Market Bias**: Intelligent bullish/bearish/neutral assessment
- **Positioning**: Customizable location and size
### **Zone Analysis Engine**
- **Technical Confluence**: RSI, ADX, ATR, Volume analysis
- **VWAP Integration**: Institutional price reference
- **Confidence Scoring**: High/Mid/Low signal classification
- **Signal Arrows**: Visual trade direction indicators
## 🔔 ALERT SYSTEM
### **Market Structure Alerts**
- `Market Bias Changed` - Shift in overall market sentiment
- `BSL Touched` - Buy Side Liquidity level reached
- `SSL Touched` - Sell Side Liquidity level reached
### **Zone Touch Alerts**
- `OB Touched` - Any Order Block interaction
- `Bullish OB Touched` - Bullish Order Block touch
- `Bearish OB Touched` - Bearish Order Block touch
- `FVG Touched` - Any Fair Value Gap interaction
- `Bullish FVG Touched` - Bullish FVG touch
- `Bearish FVG Touched` - Bearish FVG touch
- `Zone Touched` - Any Smart Zone interaction
- `Bullish Zone Touched` - Any bullish zone touch
- `Bearish Zone Touched` - Any bearish zone touch
## ⚙️ CONFIGURATION
### **Zone Detection**
- Enable/disable FVG and OB detection independently
- Maximum zones per type (3-15, default: 8)
- Zone-specific threshold and extension settings
### **Visual Customization**
- Individual color schemes for each zone type
- Adjustable transparency levels
- Configurable line styles and widths
- Dashboard positioning and sizing options
### **Technical Analysis**
- RSI, ADX, ATR period customization
- Volume threshold multipliers
- Confidence level color coding
- Signal display toggle
## 🚀 PINE SCRIPT v6 OPTIMIZATIONS
- **User-Defined Types**: Structured data for zones and statistics
- **Methods**: Type-specific operations for better code organization
- **Enhanced Arrays**: Optimized memory management
- **Switch Statements**: Improved performance for zone classification
- **Error Handling**: Robust input validation and edge case management
- **Performance**: Efficient algorithms for real-time analysis
## 📈 TRADING APPLICATIONS
### **Entry Strategies**
- Zone confluence for high-probability setups
- Multi-timeframe confirmation via BSL/SSL
- Fibonacci extension targets
- Signal arrows for directional bias
### **Risk Management**
- Zone mitigation for stop-loss placement
- Market bias for position sizing
- Dashboard statistics for strategy validation
### **Market Analysis**
- Institutional footprint identification
- Liquidity level mapping
- Market structure assessment
- Trend continuation vs reversal analysis
## 🔧 TECHNICAL SPECIFICATIONS
- **Version**: Pine Script v6
- **Overlay**: True (draws on price chart)
- **Max Objects**: 100 boxes, 100 lines, 50 labels
- **Performance**: Optimized for real-time analysis
- **Compatibility**: All TradingView chart types and timeframes
