Simple FVGSimple FVG - Fair Value Gap Indicator
Overview:
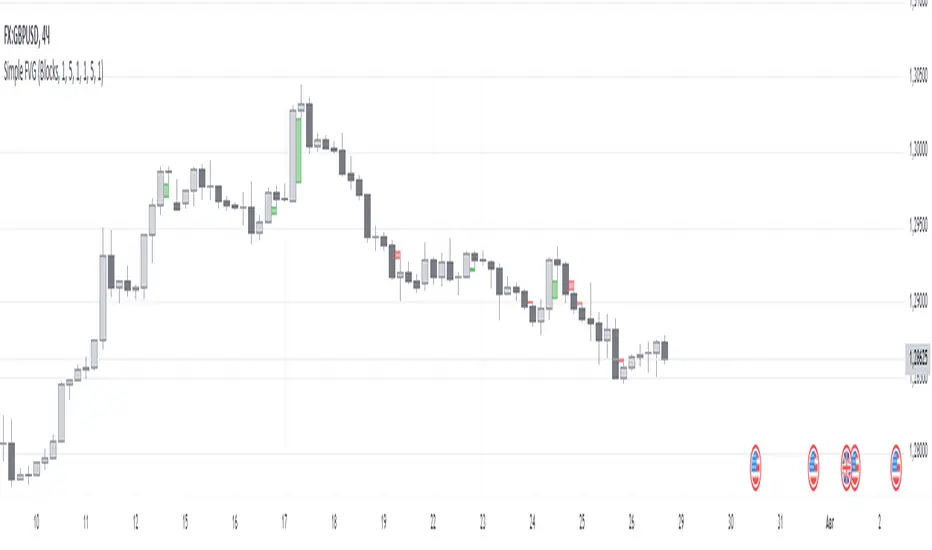
The "Simple FVG" script is designed for use with TradingView to identify and visually display Fair Value Gaps (FVG) on a trading chart. This indicator highlights both bullish and bearish imbalances based on specific candlestick patterns, helping traders to quickly identify potential trading opportunities.
Key Features:
Bullish and Bearish Imbalances:
Bullish Imbalances: This script identifies bullish imbalances where the price exhibits a gap upward. The conditions for detecting a bullish imbalance are:
The high of the second candle is greater than the high of the first candle.
The low of the third candle is greater than the high of the first candle.
Bearish Imbalances: This script identifies bearish imbalances where the price exhibits a gap downward. The conditions for detecting a bearish imbalance are:
The low of the second candle is less than the low of the first candle.
The high of the third candle is less than the low of the first candle.
Customizable Display:
Bullish Blocks: Users can toggle the display of bullish imbalance blocks with customizable colors and border settings.
Bearish Blocks: Users can toggle the display of bearish imbalance blocks with customizable colors and border settings.
Color and Border Settings: Adjust the color, border color, and border width of the blocks for both bullish and bearish imbalances according to user preferences.
Visual Representation:
Drawing Blocks: The script draws filled boxes on the chart to represent identified imbalances. These blocks span from the start of the first candlestick to the end of the third candlestick, providing a clear visual indicator of the price gap.
How It Works:
Identification Logic:
The script analyzes three consecutive candles to determine if an imbalance exists.
It compares the highs and lows of these candles to establish bullish or bearish conditions.
Drawing Mechanism:
Once an imbalance condition is met, the script calculates the top and bottom levels of the imbalance block based on the high of the first candle and the low of the third candle for bullish imbalances, and vice versa for bearish imbalances.
It then draws these blocks on the chart using the specified colors and border settings.
Usage Instructions:
Add the Indicator:
Apply the "Simple FVG" indicator to your TradingView chart.
Customize Settings:
Use the input options to enable or disable the display of bullish and bearish blocks.
Adjust the colors and border settings for the imbalance blocks as needed.
Interpret Imbalances:
Look for the drawn blocks to identify potential areas where price imbalances have occurred.
Use this information to inform your trading decisions.
Originality and Value:
The "Simple FVG" script offers a unique approach to visualizing Fair Value Gaps by focusing on specific candlestick patterns. It provides traders with a tool to easily identify and analyze price imbalances, enhancing chart analysis and trading strategy development.
Chart Information:
Ensure to show the complete symbol, timeframe, and script name information on your chart for clarity and reference.
For further details and usage guidelines, refer to the TradingView House Rules.
Note: This script adheres to TradingView's guidelines for originality and usefulness, offering a practical tool for traders seeking to enhance their chart analysis.
This description adheres to TradingView's requirements by providing a detailed explanation of the script's functionality, how it works, and how users can benefit from it.
Wskaźnik Pine Script®