EMA 5 Alert Candle ShortThe 5 EMA (Exponential Moving Average) Strategy is a simple yet effective trading strategy that helps traders identify short-term trends and potential entry and exit points. This strategy is widely used in intraday and swing trading, particularly in forex, stocks, and crypto markets.
Components of the 5 EMA Strategy
5 EMA: A fast-moving average that reacts quickly to price movements.
15-minute or 1-hour timeframe (commonly used, but adaptable to other timeframes).
Candlestick Patterns: To confirm entry signals.
How the 5 EMA Strategy Works
Buy (Long) Setup:
Price Above the 5 EMA: The price should be trading above the 5 EMA.
Pullback to the 5 EMA: A minor retracement or consolidation near the 5 EMA.
Bullish Candlestick Confirmation: A bullish candle (e.g., engulfing or pin bar) forms near the 5 EMA.
Entry: Enter a long trade at the close of the bullish candle.
Stop Loss: Place below the recent swing low or 5-10 pips below the 5 EMA.
Take Profit: Aim for a risk-reward ratio of at least 1:2 or trail the stop using a higher EMA (e.g., 10 or 20 EMA).
Sell (Short) Setup:
Price Below the 5 EMA: The price should be trading below the 5 EMA.
Pullback to the 5 EMA: A small retracement towards the 5 EMA.
Bearish Candlestick Confirmation: A bearish candle (e.g., engulfing or pin bar) near the 5 EMA.
Entry: Enter a short trade at the close of the bearish candle.
Stop Loss: Place above the recent swing high or 5-10 pips above the 5 EMA.
Take Profit: Aim for a 1:2 risk-reward ratio or use a trailing stop.
Additional Filters for Better Accuracy
Higher Timeframe Confirmation: Check the trend on a higher timeframe (e.g., 1-hour or 4-hour).
Volume Confirmation: Enter trades when volume is increasing.
Avoid Sideways Market: Use the strategy only when the market is trending.
Advantages of the 5 EMA Strategy
✔️ Simple and easy to use.
✔️ Works well in trending markets.
✔️ Helps traders capture short-term momentum.
Disadvantages
❌ Less effective in choppy or sideways markets.
❌ Requires discipline in following stop-loss rules.
Wyszukaj w skryptach "entry"

SMA Strategy Builder: Create & Prove Profitability📄 Pine Script Strategy Description (For Publishing on TradingView)
🎯 Strategy Title:
SMA Strategy Builder: Create & Prove Profitability
✨ Description:
This tool is designed for traders who want to build, customize, and prove their own SMA-based trading strategies. The strategy tracks capital growth in real-time, providing clear evidence of profitability after each trade. Users can adjust key parameters such as SMA period, take profit levels, and initial capital, making it a flexible solution for backtesting and strategy validation.
🔍 Key Features:
✅ SMA-Based Logic:
Core trading logic revolves around the Simple Moving Average (SMA).
SMA period is fully adjustable to suit various trading styles.
🎯 Customizable Take Profit (TP):
User-defined TP percentages per position.
TP line displayed as a Step Line with Breaks for clear segmentation.
Visual 🎯TP label for quick identification of profit targets.
💵 Capital Tracking (Proof of Profitability):
Initial capital is user-defined.
Capital balance updates after each closed trade.
Shows both absolute profit/loss and percentage changes for every position.
Darker green profit labels for better readability and dark red for losses.
📈 Capital Curve (Performance Visualization):
Capital growth curve available (hidden by default, can be enabled via settings).
📏 Dynamic Label Positioning:
Label positions adjust dynamically based on the price range.
Ensures consistent visibility across low and high-priced assets.
⚡ How It Works:
Long Entry:
Triggered when the price crosses above the SMA.
TP level is calculated as a user-defined percentage above the entry price.
Short Entry:
Triggered when the price crosses below the SMA.
TP level is calculated as a user-defined percentage below the entry price.
TP Execution:
Positions close immediately once the TP level is reached (no candle close confirmation needed).
🔔 Alerts:
🟩 Long Signal Alert: When the price crosses above the SMA.
🟥 Short Signal Alert: When the price crosses below the SMA.
🎯 TP Alert: When the TP target is reached.
⚙️ Customization Options:
📅 SMA Period: Choose the moving average period that best fits your strategy.
🎯 Take Profit (%): Adjust TP percentages for flexible risk management.
💵 Initial Capital: Set the starting capital for realistic backtesting.
📈 Capital Curve Toggle: Enable or disable the capital curve to track overall performance.
🌟 Why Use This Tool?
🔧 Flexible Strategy Creation: Adjust core parameters and create tailored SMA-based strategies.
📈 Performance Proof: Capital tracking acts as real proof of profitability after each trade.
🎯 Immediate TP Execution: No waiting for candle closures; profits lock in as soon as targets are hit.
💹 Comprehensive Performance Insights: Percentage-based and absolute capital tracking with dynamic visualization.
🏦 Clean Visual Indicators: Strategy insights made clear with dynamic labeling and adjustable visuals.
⚠️ Disclaimer:
This script is provided for educational and informational purposes only. Trading financial instruments carries risk, and past performance does not guarantee future results. Always perform your own due diligence before making any trading decisions.

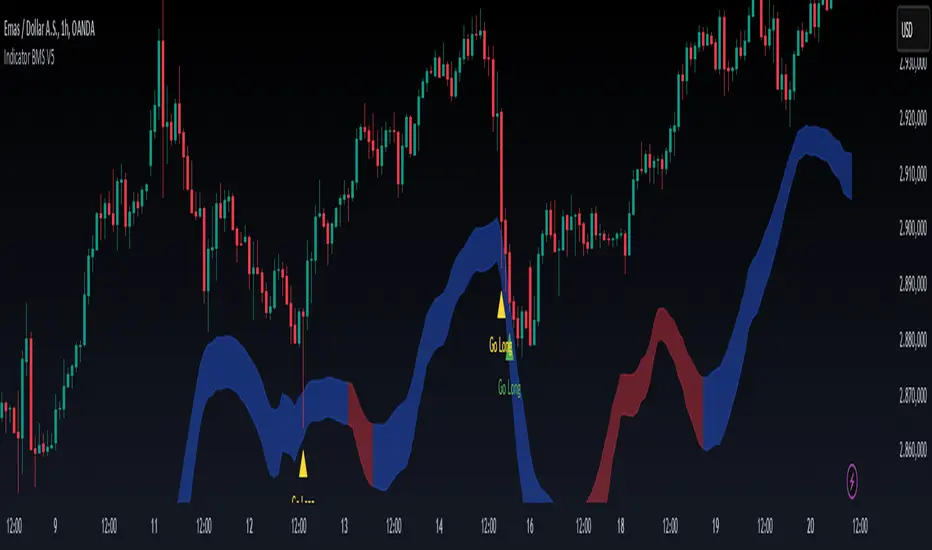
Indicator BMS V5 [Traderhood]Introducing BMS (Base Market Strategy)
Overview
Base Market Strategy (BMS) is a trend-following and oscillator indicator designed to detect market trends with high accuracy while providing clear entry signals. BMS utilizes four Exponential Moving Averages (EMA) to filter trends across multiple timeframes and Bollinger Bands (BB) to identify overbought and oversold zones. This approach makes BMS highly suitable for scalping strategies in lower timeframes with a high win rate potential.
Key Features
📈 Multi-EMA Trend Filtering
Uses 4 EMAs to confirm the dominant trend.
Separates trend detection between lower timeframes and H1 for additional validation.
🎯 Dynamic Overbought & Oversold Detection
Sell signal occurs when the price touches the Bollinger Bands Upper.
Buy signal occurs when the price touches the Bollinger Bands Lower.
🔥 High Win Rate Scalping Strategy
Designed to capture quick price movements in trending markets.
Ideal for traders looking for fast executions with controlled risk.
🎨 Customizable Visual Enhancements
Users can adjust indicator colors to match their personal preferences.
How It Works
1️⃣ EMA-Based Trend Identification
The indicator applies 4 EMAs to determine short-term and medium-term trends.
If the price is above all EMAs → Bullish trend.
If the price is below all EMAs → Bearish trend.
2️⃣ Bollinger Bands Signal Generation
Sell Entry: When the price touches Bollinger Bands Upper, indicating an overbought area.
Buy Entry: When the price touches Bollinger Bands Lower, indicating an oversold area.
3️⃣ Scalping Execution
Entries are executed only on lower timeframes with trend confirmation from H1 EMA.
Profit targets are adjusted based on volatility, while stop loss is placed outside the Bollinger Bands.
4️⃣ Visual Customization
Indicator colors can be modified for better visibility.
Practical Applications
✅ Scalping Strategy – Uses Bollinger Bands and EMA filtering for fast trades.
✅ Trend Confirmation – Multi-timeframe EMA validation ensures precise entries.
✅ Dynamic Support & Resistance – Bollinger Bands help identify potential reversals.
✅ Noise Reduction – EMA filtering removes minor price fluctuations for clearer signals.
🛠 Settings
EMA Periods: 4 EMAs for trend filtering.
Bollinger Bands Length: 20 (default), adjustable.
Bollinger Bands Deviation: 2 (default).
Color Customization: Users can personalize indicator colors as needed.
📌 Conclusion
Base Market Strategy (BMS) is a high win-rate scalping indicator, combining trend-following EMA filtering with momentum reversal detection from Bollinger Bands. With a dynamic and adaptive approach, this indicator provides precise entry signals while reducing noise from insignificant price movements.
Key Takeaways:
✔ High Accuracy – A combination of EMA and Bollinger Bands provides clear signals.
✔ Scalping Optimization – Works best on lower timeframes with H1 validation.
✔ Visual Customization – Users can adjust the indicator colors to their preference.
✔ Simple Yet Powerful – Easy to use but highly effective in capturing market opportunities.
🔹 Disclaimer: Trading carries high risks. Always backtest and optimize settings to align with your risk tolerance before live trading.
PRC-ALMA | QuantEdgeBIntroducing PRC-ALMA by QuantEdgeB
Overview
The PRC-ALMA (Percentile Adaptive ALMA) is an advanced dynamic trend and volatility filtering indicator that leverages the Arnaud Legoux Moving Average (ALMA) combined with Percentile Rank Filtering and Median Absolute Deviation (MAD) Bands. It is designed to enhance market structure clarity, detect breakout zones, and provide trade signals by dynamically adjusting its filtering based on recent price action.
____
Key Features
1. 📈 Adaptive ALMA Smoothing:
- Uses ALMA for smoothing price action while reducing lag.
- Provides a more responsive moving average than traditional EMAs and SMAs.
2. 📊 Percentile Rank-Based Thresholds:
- Determines upper and lower regions using 75th and 25th percentile ranks.
- Allows for adaptive thresholding based on historical price movements.
3. 🎯 Median Absolute Deviation (MAD) Volatility Filtering:
- Filters out noise using robust statistical deviation measures.
- MAD Bands dynamically adjust based on volatility expansion and contraction.
4. 🔄 Dynamic Trade Signals:
- Generates long signals when price exceeds the upper threshold.
- Generates short signals when price drops below the lower threshold.
5. 🎨 Customizable Color Modes & Visual Enhancements:
- Choose between multiple color schemes to match trading preferences.
- Optional candlestick coloring to indicate market sentiment shifts.
____
How It Works
1. ALMA Calculation:
- The indicator starts by computing the ALMA (Arnaud Legoux Moving Average) with a customizable length, offset, and sigma.
2. Percentile Rank Filtering:
- It then calculates the 75th and 25th percentile ranks over a selected period, determining dynamic levels for trend identification.
3. Volatility Adjustment Using Median Absolute Deviation (MAD):
- MAD is applied to filter noise and adapt the upper/lower bands based on market volatility.
- The higher the MAD multiplier, the wider the bands, allowing more price fluctuations before a signal triggers.
4. Entry & Exit Conditions:
- Long Entry: When price crosses above the upper percentile band + MAD filter.
- Short Entry: When price crosses below the lower percentile band - MAD filter.
5. Visual Enhancements:
- Dynamic band plotting with shading between percentile ranks.
- Candlestick coloring to visually indicate long/short sentiment shifts.
____
Practical Applications
✅ Trend Following & Momentum Trading – Uses ALMA for trend smoothing and percentile-based breakouts.
✅ Mean Reversion Strategies – Adaptive MAD filtering ensures only significant deviations trigger signals.
✅ Multi-Timeframe Trading – Works on intraday, daily, and weekly timeframes based on user customization.
✅ Noise Reduction – Eliminates minor fluctuations while capturing meaningful market moves.
____
🛠 Settings
-ALMA Length: 24 – Defines the smoothing period for the Arnaud Legoux Moving Average.
-ALMA Offset: 0.7 – Adjusts the shift factor, controlling responsiveness.
-ALMA Sigma: 4 – Determines the smoothing strength, balancing trend-following and noise reduction.
-Percentile Length: 21 – Lookback period for calculating percentile rank levels.
-Median Period: 21 – The period used for the Median Absolute Deviation (MAD) filter.
-Median Multiplier: 1.8 – Adjusts the sensitivity of the MAD filter, impacting how signals are generated.
-Color Mode: Strategy – Various visual themes available for better chart readability.
-Signal Label: Off - If turned off the indicator produced a Long or Cash signal when the trend changes.
📌 Conclusion
The PRC-ALMA | QuantEdgeB is an advanced valuation and signal generation tool that dynamically adjusts based on market conditions. By combining ALMA for trend smoothing, percentile rank thresholds, and MAD-based volatility filtering, it provides traders with a versatile indicator for momentum, breakout, and mean reversion strategies.
Key Takeaways:
✔ Smooth & Adaptive – ALMA ensures minimal lag while maintaining trend responsiveness.
✔ Dynamic Overbought/Oversold Zones – Adjusts to real-time market conditions using percentile-based bands.
✔ Volatility-Aware Filtering – Uses MAD to eliminate market noise, making signals more reliable.
✔ Customizable & Multi-Timeframe Ready – Works on various asset classes and timeframes with adjustable settings.
🔹 Disclaimer: Past performance is not indicative of future results. No trading strategy can guarantee success in financial markets.
🔹 Strategic Advice: Always backtest, optimize, and align parameters with your trading objectives and risk tolerance before live trading.

Pure Price Action Breakout with 1:5 RR
Description of the Price Action Trading Script (Pine Script v6)
Overview
This script is a pure price action-based breakout strategy designed for TradingView. It identifies key breakout levels and executes long and short trades based on market structure. The strategy ensures a minimum risk-to-reward ratio (RR) of 1:5, aiming for high profitability with well-defined stop-loss and take-profit levels.
How the Script Works
1️⃣ Breakout Identification
The script uses a lookback period to find the highest high and lowest low over the last n bars.
A bullish breakout occurs when the price closes above the previous highest high.
A bearish breakout happens when the price closes below the previous lowest low.
2️⃣ Entry & Exit Strategy
Long Entry: If a bullish breakout is detected, the script enters a long position.
Short Entry: If a bearish breakout is detected, the script enters a short position.
The stop-loss is placed at the recent swing low (for long trades) or recent swing high (for short trades).
The target price is calculated based on a risk-to-reward ratio of 1:5, ensuring profitable trades.
3️⃣ Risk Management
The stop-loss prevents excessive losses by exiting trades when the market moves unfavorably.
The strategy ensures that each trade has a reward potential at least 5 times the risk.
Positions are executed based on price action only, without indicators like moving averages or RSI.
4️⃣ Visual Representation
The script plots breakout levels to help traders visualize potential trade setups.
Entry points, stop-loss, and take-profit levels are labeled on the chart for easy tracking.
Key Features & Benefits
✔ Pure Price Action – No lagging indicators, only real-time price movements.
✔ High Risk-to-Reward Ratio (1:5) – Ensures high-profit potential trades.
✔ Real-time Entry & Exit Signals – Provides accurate trade setups.
✔ Dynamic Stop-loss Calculation – Adjusts based on recent market structure.
✔ Customizable Parameters – Lookback periods and risk ratios can be modified.

Bollinger Bounce Reversal Strategy – Visual EditionOverview:
The Bollinger Bounce Reversal Strategy – Visual Edition is designed to capture potential reversal moves at price extremes—often termed “bounce points”—by using a combination of technical indicators. The strategy integrates Bollinger Bands, MACD, and volume analysis, and it provides rich on‑chart visual cues to help traders understand its signals and conditions. Additionally, the strategy enforces a maximum of 5 trades per day and uses fixed risk management parameters. This publication is intended for educational purposes and offers a systematic, transparent approach that you can further adjust to fit your market or risk profile.
How It Works:
Bollinger Bands:
A 20‑period simple moving average (SMA) and a user‑defined standard deviation multiplier (default 2.0) are used to calculate the Bollinger Bands.
When the price reaches or crosses these bands (i.e. falls below the lower band or rises above the upper band), it suggests that the price is in an extreme, potentially oversold or overbought, state.
MACD Filter:
The MACD (calculated with standard lengths, e.g. 12, 26, 9) provides momentum information.
For a bullish (long) signal, the MACD line should be above its signal line; for a bearish (short) signal, the MACD line should be below.
Volume Confirmation:
The strategy uses a 20‑period volume moving average to determine if current volume is strong enough to validate a signal.
A signal is confirmed only if the current volume is at or above a specified multiple (by default, 1.0×) of this moving average, ensuring that the move is supported by increased market participation.
Visual Cues:
Bollinger Bands and Fill: The basis (SMA), upper, and lower Bollinger Bands are plotted, and the area between the upper and lower bands is filled with a semi‑transparent color.
Signal Markers: When a long or short signal is generated, corresponding markers (labels) appear on the chart.
Background Coloring: The chart’s background changes color (green for long signals and red for short signals) on the bars where signals occur.
Information Table: An on‑chart table displays key indicator values (MACD, signal line, volume, average volume) and the number of trades executed that day.
Entry Conditions:
Long Entry:
A long trade is triggered when the previous bar’s close is below the lower Bollinger Band and the current bar’s close crosses above it, combined with a bullish MACD condition and strong volume.
Short Entry:
A short trade is triggered when the previous bar’s close is above the upper Bollinger Band and the current bar’s close crosses below it, with a bearish MACD condition and high volume.
Risk Management:
Daily Trade Limit: The strategy restricts trading to no more than 5 trades per day.
Stop-Loss and Take-Profit:
For each position, a stop loss is set at a fixed percentage away from the entry price (typically 2%), and a take profit is set to target a 1:2 risk-reward ratio (typically 4% from the entry price).
Backtesting Setup:
Initial Capital: $10,000
Commission: 0.1% per trade
Slippage: 1 tick per bar
These realistic parameters help ensure that backtesting results reflect the conditions of an average trader.
Disclaimer:
Past performance is not indicative of future results. This strategy is experimental and provided solely for educational purposes. It is essential to backtest extensively and paper trade before any live deployment. All risk management practices are advisory, and you should adjust parameters to suit your own trading style and risk tolerance.
Conclusion:
By combining Bollinger Bands, MACD, and volume analysis, the Bollinger Bounce Reversal Strategy – Visual Edition provides a clear, systematic method to identify potential reversal opportunities at price extremes. The added visual cues help traders quickly interpret signals and assess market conditions, while strict risk management and a daily trade cap help keep trading disciplined. Adjust and refine the settings as needed to better suit your specific market and risk profile.

EMA Crossover Backtest [BarScripts]This indicator lets you backtest an EMA crossover strategy with built-in risk management and trade tracking. It simulates long and short trades based on EMA crossovers, allowing you to fine-tune entry conditions, stop-loss placement, and reward/risk settings.
🔹 How It Works:
Long Entry: Fast EMA crosses above Slow EMA, and price closes above Fast EMA.
Short Entry: Fast EMA crosses below Slow EMA, and price closes below Fast EMA.
Stop Loss: Set based on previous bars or a fixed amount.
Take Profit: Adjustable reward/risk ratio.
Higher Timeframe Confluence: Confirms trades based on a larger timeframe.
Trade Hours Filter: Limits trades to specific time windows.
🔹 Key Features:
✅ Shows Entry & Exit Points with visual trade lines.
✅ Customizable EMA Lengths to fit any strategy.
✅ P&L Tracking & Statistics to measure performance.
✅ Position Sizing Options: Fixed position, fixed risk, or percentage of balance.
✅ Commissions Tracking (based on total trades, not contracts).
Use this tool to fine-tune your EMA crossover strategy and see how it performs over time! 🚀
💬 Let me know your feedback—suggest improvements, report issues, or request new features!

Volatility Momentum Breakout StrategyDescription:
Overview:
The Volatility Momentum Breakout Strategy is designed to capture significant price moves by combining a volatility breakout approach with trend and momentum filters. This strategy dynamically calculates breakout levels based on market volatility and uses these levels along with trend and momentum conditions to identify trade opportunities.
How It Works:
1. Volatility Breakout:
• Methodology:
The strategy computes the highest high and lowest low over a defined lookback period (excluding the current bar to avoid look-ahead bias). A multiple of the Average True Range (ATR) is then added to (or subtracted from) these levels to form dynamic breakout thresholds.
• Purpose:
This method helps capture significant price movements (breakouts) while ensuring that only past data is used, thereby maintaining realistic signal generation.
2. Trend Filtering:
• Methodology:
A short-term Exponential Moving Average (EMA) is applied to determine the prevailing trend.
• Purpose:
Long trades are considered only when the current price is above the EMA, indicating an uptrend, while short trades are taken only when the price is below the EMA, indicating a downtrend.
3. Momentum Confirmation:
• Methodology:
The Relative Strength Index (RSI) is used to gauge market momentum.
• Purpose:
For long entries, the RSI must be above a mid-level (e.g., above 50) to confirm upward momentum, and for short entries, it must be below a similar threshold. This helps filter out signals during overextended conditions.
Entry Conditions:
• Long Entry:
A long position is triggered when the current closing price exceeds the calculated long breakout level, the price is above the short-term EMA, and the RSI confirms momentum (e.g., above 50).
• Short Entry:
A short position is triggered when the closing price falls below the calculated short breakout level, the price is below the EMA, and the RSI confirms momentum (e.g., below 50).
Risk Management:
• Position Sizing:
Trades are sized to risk a fixed percentage of account equity (set here to 5% per trade in the code, with each trade’s stop loss defined so that risk is limited to approximately 2% of the entry price).
• Stop Loss & Take Profit:
A stop loss is placed a fixed ATR multiple away from the entry price, and a take profit target is set to achieve a 1:2 risk-reward ratio.
• Realistic Backtesting:
The strategy is backtested using an initial capital of $10,000, with a commission of 0.1% per trade and slippage of 1 tick per bar—parameters chosen to reflect conditions faced by the average trader.
Important Disclaimers:
• No Look-Ahead Bias:
All breakout levels are calculated using only past data (excluding the current bar) to ensure that the strategy does not “peek” into future data.
• Educational Purpose:
This strategy is experimental and provided solely for educational purposes. Past performance is not indicative of future results.
• User Responsibility:
Traders should thoroughly backtest and paper trade the strategy under various market conditions and adjust parameters to fit their own risk tolerance and trading style before live deployment.
Conclusion:
By integrating volatility-based breakout signals with trend and momentum filters, the Volatility Momentum Breakout Strategy offers a unique method to capture significant price moves in a disciplined manner. This publication provides a transparent explanation of the strategy’s components and realistic backtesting parameters, making it a useful tool for educational purposes and further customization by the TradingView community.

Advanced Multi-Timeframe Trading System (Risk Managed)Description:
This strategy is an original approach that combines two main analytical components to identify potential trade opportunities while simulating realistic trading conditions:
1. Market Trend Analysis via an Approximate Hurst Exponent
• What It Does:
The strategy computes a rough measure of market trending using an approximate Hurst exponent. A value above 0.5 suggests persistent, trending behavior, while a value below 0.5 indicates a tendency toward mean-reversion.
• How It’s Used:
The Hurst exponent is calculated on both the chart’s current timeframe and a higher timeframe (default: Daily) to capture both local and broader market dynamics.
2. Fibonacci Retracement Levels
• What It Does:
Using daily high and low data from a selected timeframe (default: Daily), the script computes key Fibonacci retracement levels.
• How It’s Used:
• The 61.8% level (Golden Ratio) serves as a key threshold:
• A long entry is signaled when the price crosses above this level if the daily Hurst exponent confirms a trending market.
• The 38.2% level is used to identify short-entry opportunities when the price crosses below it and the daily Hurst indicates non-trending conditions.
Signal Logic:
• Long Entry:
When the price crosses above the 61.8% Fibonacci level (Golden Ratio) and the daily Hurst exponent is greater than 0.5, suggesting a trending market.
• Short Entry:
When the price crosses below the 38.2% Fibonacci level and the daily Hurst exponent is less than 0.5, indicating a less trending or potentially reversing market.
Risk Management & Trade Execution:
• Stop-Loss:
Each trade is risk-managed with a stop-loss set at 2% below (for longs) or above (for shorts) the entry price. This ensures that no single trade risks more than a small, sustainable portion of the account.
• Take Profit:
A take profit order targets a risk-reward ratio of 1:2 (i.e., the target profit is twice the amount risked).
• Position Sizing:
Trades are executed with a fixed position size equal to 10% of account equity.
• Trade Frequency Limits:
• Daily Limit: A maximum of 5 trades per day
• Overall Limit: No more than 510 trades during the backtesting period (e.g., since 2019)
These limits are imposed to simulate realistic trading frequency and to avoid overtrading in backtest results.
Backtesting Parameters:
• Initial Capital: $10,000
• Commission: 0.1% per trade
• Slippage: 1 tick per bar
These settings aim to reflect the conditions faced by the average trader and help ensure that the backtesting results are realistic and not misleading.
Chart Overlays & Visual Aids:
• Fibonacci Levels:
The key Fibonacci retracement levels are plotted on the chart, and the zone between the 61.8% and 38.2% levels is highlighted to show a key retracement area.
• Market Trend Background:
The chart background is tinted green when the daily Hurst exponent indicates a trending market (value > 0.5) and red otherwise.
• Information Table:
An on-chart table displays key parameters such as the current Hurst exponent, daily Hurst value, the number of trades executed today, and the global trade count.
Disclaimer:
Past performance is not indicative of future results. This strategy is experimental and provided solely for educational purposes. It is essential that you backtest and paper trade using your own settings before considering any live deployment. The Hurst exponent calculation is an approximation and should be interpreted as a rough gauge of market behavior. Adjust the parameters and risk management settings according to your personal risk tolerance and market conditions.
Additional Notes:
• Originality & Usefulness:
This script is an original mashup that combines trend analysis with Fibonacci retracement methods. The description above explains how these components work together to provide trading signals.
• Realistic Results:
The strategy uses realistic account sizes, commission rates, slippage, and risk management rules to generate backtesting results that are representative of real-world trading.
• Educational Purpose:
This script is intended to support the TradingView community by offering insights into combining multiple analysis techniques in one strategy. It is not a “get-rich-quick” system but rather an educational tool to help traders understand risk management and trade signal logic.
By using this script, you acknowledge that trading involves risk and that you are responsible for testing and adjusting the strategy to fit your own trading environment. This publication is fully open source, and any modifications should include proper attribution if significant portions of the code are reused.

Prev Day High EMA Crossover with 7-Day SMA Trailing StopPrev Day High EMA Crossover with 7-Day SMA Trailing Stop
Overview
This indicator is designed for traders who seek high-probability breakout trades using a combination of Exponential Moving Averages (EMAs), the previous day's high, and a 7-day Simple Moving Average (SMA) trailing stop. It helps identify bullish and bearish crossover signals while ensuring confirmation with price action above or below key levels.
How It Works
1. Entry Signals:
✅ Bullish Entry:
The 9 EMA crosses above the 15 EMA (bullish momentum).
The price is above the previous day’s high (confirming a breakout).
The candle closes above the open (bullish confirmation).
✅ Bearish Entry:
The 9 EMA crosses below the 15 EMA (bearish momentum).
The price is below the previous day’s high (confirming a failure to break higher).
The candle closes below the open (bearish confirmation).
2. Exit Strategy (Trailing Stop):
📌 Long Exit: If in a long trade, exit when the price closes below the 7-day SMA.
📌 Short Exit: If in a short trade, exit when the price closes above the 7-day SMA.

High-Probability IndicatorExplanation of the Code
Trend Filter (EMA):
A 50-period Exponential Moving Average (EMA) is used to determine the overall trend.
trendUp is true when the price is above the EMA.
trendDown is true when the price is below the EMA.
Momentum Filter (RSI):
A 14-period RSI is used to identify overbought and oversold conditions.
oversold is true when RSI ≤ 30.
overbought is true when RSI ≥ 70.
Volatility Filter (ATR):
A 14-period Average True Range (ATR) is used to measure volatility.
ATR is multiplied by a user-defined multiplier (default: 2.0) to set a volatility threshold.
Ensures trades are only taken during periods of sufficient volatility.
Entry Conditions:
Long Entry: Price is above the EMA (uptrend), RSI is oversold, and the candle range exceeds the ATR threshold.
Short Entry: Price is below the EMA (downtrend), RSI is overbought, and the candle range exceeds the ATR threshold.
Exit Conditions:
Take Profit: A fixed percentage above/below the entry price.
Stop Loss: A fixed percentage below/above the entry price.
Visualization:
The EMA is plotted on the chart.
Background colors highlight uptrends and downtrends.
Buy and sell signals are displayed as labels on the chart.
Alerts:
Alerts are triggered for buy and sell signals.
How to Use the Indicator
Trend Filter:
Only take trades in the direction of the trend (e.g., long in an uptrend, short in a downtrend).
Momentum Filter:
Look for oversold conditions in an uptrend for long entries.
Look for overbought conditions in a downtrend for short entries.
Volatility Filter:
Ensure the candle range exceeds the ATR threshold to avoid low-volatility trades.
Risk Management:
Use the built-in take profit and stop loss levels to manage risk.
Optimization Tips
Backtesting:
Test the indicator on multiple timeframes and assets to evaluate its performance.
Adjust the input parameters (e.g., EMA length, RSI length, ATR multiplier) to optimize for specific markets.
Combination with Other Strategies:
Add additional filters, such as volume analysis or support/resistance levels, to improve accuracy.
Risk Management:
Use proper position sizing and risk-reward ratios to maximize profitability.
Disclaimer
No indicator can guarantee an 85% win ratio due to the inherent unpredictability of financial markets. This script is provided for educational purposes only. Always conduct thorough backtesting and paper trading before using any strategy in live trading.
Let me know if you need further assistance or enhancements!

Candle Emotion Index (CEI) StrategyThe Candle Emotion Index (CEI) Strategy is an innovative sentiment-based trading approach designed to help traders identify and capitalize on market psychology. By analyzing candlestick patterns and combining them into a unified metric, the CEI Strategy provides clear entry and exit signals while dynamically managing risk. This strategy is ideal for traders looking to leverage market sentiment to identify high-probability trading opportunities.
How It Works
The CEI Strategy is built around three core oscillators that reflect key emotional states in the market:
Indecision Oscillator . Measures market uncertainty using patterns like Doji and Spinning Tops. High values indicate hesitation, signaling potential turning points.
Fear Oscillator . Tracks bearish sentiment through patterns like Shooting Star, Hanging Man, and Bearish Engulfing. Helps identify moments of intense selling pressure.
Greed Oscillator . Detects bullish sentiment using patterns like Marubozu, Hammer, Bullish Engulfing, and Three White Soldiers. Highlights periods of strong buying interest.
These oscillators are averaged into the Candle Emotion Index (CEI):
CEI = (Indecision + Fear + Greed) / 3
This single value quantifies overall market sentiment and drives the strategy’s trading decisions.
Key Features
Sentiment-Based Trading Signals . Long Entry: Triggered when the CEI crosses above a lower threshold (e.g., 0.1), indicating increasing bullish sentiment. Short Entry: Triggered when the CEI crosses above a higher threshold (e.g., 0.2), signaling rising bearish sentiment.
Volume Confirmation . Trades are validated only if volume exceeds a user-defined multiplier of the average volume over the lookback period. This ensures entries are backed by significant market activity.
Break-Even Recovery Mechanism . If a trade moves into a loss, the strategy attempts to recover to break-even instead of immediately exiting at a loss. This feature provides flexibility, allowing the market to recover while maintaining disciplined risk management.
Dynamic Risk Management . Maximum Holding Period: Trades are closed after a user-defined number of candles to avoid overexposure to prolonged uncertainty. Profit-Taking Conditions: Positions are exited when favorable price moves are confirmed by increased volume, locking in gains. Loss Threshold: Trades are exited early if the price moves unfavorably beyond a set percentage of the entry price, limiting potential losses.
Cooldown Period . After a trade is closed, a cooldown period prevents immediate re-entry, reducing overtrading and improving signal quality.
Why Use This Strategy?
The CEI Strategy combines advanced sentiment analysis with robust trade management, making it a powerful tool for traders seeking to understand market psychology and identify high-probability setups. Its unique features, such as the break-even recovery mechanism and volume confirmation, add an extra layer of discipline and reliability to trading decisions.
Best Practices
Combine with Other Indicators . Use trend-following tools (e.g., moving averages, ADX) and momentum oscillators (e.g., RSI, MACD) to confirm signals.
Align with Key Levels . Incorporate support and resistance levels for refined entries and exits.
Multi-Market Compatibility . Apply this strategy to forex, crypto, stocks, or any asset class with strong volume and price action.

Sunil 2 Bar Breakout StrategyDetailed Explanation of the Sunil 2 Bar Breakout Strategy
Introduction
The Sunil 2 Bar Breakout Strategy is a simple yet effective price-action-based approach designed to identify breakout opportunities in financial markets. This strategy analyzes the movement of the last three candles to detect momentum and initiates trades in the direction of the breakout. It is equipped with a built-in stop-loss mechanism to protect capital, making it suitable for traders looking for a structured and disciplined trading system.
The strategy works well across different timeframes and asset classes, including indices, stocks, forex, and cryptocurrencies. Its versatility makes it ideal for both intraday and swing trading.
Core Concept
The strategy revolves around two primary conditions: breakout identification and risk management.
Breakout Identification:
Long Trade Setup: The strategy identifies bullish breakouts when:
The current candle's closing price is higher than the previous candle's closing price.
The high of the previous candle is greater than the highs of the two candles before it.
Short Trade Setup: The strategy identifies bearish breakouts when:
The current candle's closing price is lower than the previous candle's closing price.
The low of the previous candle is lower than the lows of the two candles before it.
Risk Management:
Stop-Loss: For each trade, a stop-loss is automatically set:
For long trades, the stop-loss is set to the low of the previous candle.
For short trades, the stop-loss is set to the high of the previous candle.
This ensures that losses are minimized if the breakout fails.
Exit Logic:
The trade is closed automatically when the stop-loss is hit.
This approach maintains discipline and prevents emotional trading.
Strategy Workflow
Entry Criteria:
Long Entry: A long trade is triggered when:
The current close is greater than the previous close.
The high of the previous candle exceeds the highs of the two candles before it.
Short Entry: A short trade is triggered when:
The current close is less than the previous close.
The low of the previous candle is below the lows of the two candles before it.
Stop-Loss Placement:
For long trades, the stop-loss is set at the low of the previous candle.
For short trades, the stop-loss is set at the high of the previous candle.
Trade Management:
Trades are exited automatically if the stop-loss level is hit.
The strategy avoids re-entering trades until new breakout conditions are met.
Default Settings
Position Sizing:
The default position size is set to 1% of the account equity. This ensures proper risk management and prevents overexposure to the market.
Stop-Loss:
Stop-loss levels are automatically calculated based on the previous candle’s high or low.
Timeframes:
The strategy is versatile and works across multiple timeframes. However, it is recommended to test it on 15-minute, 1-hour, and daily charts for optimal performance.
Key Features
Automated Trade Execution:
The strategy handles both trade entry and exit automatically based on pre-defined conditions.
Built-In Risk Management:
The automatic stop-loss placement ensures losses are minimized on failed breakouts.
Works Across Markets:
The strategy is compatible with a wide range of instruments, including indices, stocks, forex, and cryptocurrencies.
Clear Signals:
Entry and exit points are straightforward and based on objective conditions, reducing ambiguity.
Versatility:
Can be used for both day trading and swing trading, depending on the chosen timeframe.
Best Practices for Using This Strategy
Backtesting:
Test the strategy on your chosen instrument and timeframe using TradingView's Strategy Tester to evaluate its performance.
Market Conditions:
The strategy performs best in trending markets or during periods of high volatility. Avoid using it in range-bound or choppy markets.
Position Sizing:
Use the default position size (1% of equity) or adjust based on your risk tolerance and account size.
Instrument Selection:
Focus on instruments with good liquidity and volatility, such as indices (e.g., NIFTY, BANKNIFTY), forex pairs, or major cryptocurrencies (e.g., Bitcoin, Ethereum).
Potential Enhancements
To make the strategy even more robust, consider adding the following optional features:
Stop-Loss Multiplier:
Allow users to customize the stop-loss distance as a multiple of the default level (e.g., 1.5x the low or high of the previous candle).
Take-Profit Levels:
Add user-defined take-profit levels, such as a fixed risk-reward ratio (e.g., 1:2).
Time Filter:
Include an option to restrict trading to specific market hours (e.g., avoid low-liquidity times).
Conclusion
The Sunil 2 Bar Breakout Strategy is an excellent tool for traders looking to capitalize on breakout opportunities while maintaining disciplined risk management. Its simplicity, combined with its effectiveness, makes it suitable for traders of all experience levels. By adhering to the clearly defined rules, traders can achieve consistent results while avoiding emotional trading decisions.
This strategy is a reliable addition to any trader’s toolbox and is designed to work seamlessly across different market conditions and instruments.

BullBear with Volume-Percentile TP - Strategy [presentTrading] Happy New Year, everyone! I hope we have a fantastic year ahead.
It's been a while since I published an open script, but it's time to return.
This strategy introduces an indicator called Bull Bear Power, combined with an advanced take-profit system, which is the main innovative and educational aspect of this script. I hope all of you find some useful insights here. Welcome to engage in meaningful exchanges. This is a versatile tool suitable for both novice and experienced traders.
█ Introduction and How it is Different
Unlike traditional strategies that rely solely on price or volume indicators, this approach combines Bull Bear Power (BBP) with volume percentile analysis to identify optimal entry and exit points. It features a dynamic take-profit mechanism based on ATR (Average True Range) multipliers adjusted by volume and percentile factors, ensuring adaptability to diverse market conditions. This multifaceted strategy not only improves signal accuracy but also optimizes risk management, distinguishing it from conventional trading methods.
BTCUSD 6hr performance
Disable the visualization of Bull Bear Power (BBP) to clearly view the Z-Score.
█ Strategy, How it Works: Detailed Explanation
The BBP Strategy with Volume-Percentile TP utilizes several interconnected components to analyze market data and generate trading signals. Here's an overview with essential equations:
🔶 Core Indicators and Calculations
1. Exponential Moving Average (EMA):
- **Purpose:** Smoothens price data to identify trends.
- **Formula:**
EMA_t = (Close_t * (2 / (lengthInput + 1))) + (EMA_(t-1) * (1 - (2 / (lengthInput + 1))))
- Usage: Baseline for Bull and Bear Power.
2. Bull and Bear Power:
- Bull Power: `BullPower = High_t - EMA_t`
- Bear Power: `BearPower = Low_t - EMA_t`
- BBP:** `BBP = BullPower + BearPower`
- Interpretation: Positive BBP indicates bullish strength, negative indicates bearish.
3. Z-Score Calculation:
- Purpose: Normalizes BBP to assess deviation from the mean.
- Formula:
Z-Score = (BBP_t - bbp_mean) / bbp_std
- Components:
- `bbp_mean` = SMA of BBP over `zLength` periods.
- `bbp_std` = Standard deviation of BBP over `zLength` periods.
- Usage: Identifies overbought or oversold conditions based on thresholds.
🔶 Volume Analysis
1. Volume Moving Average (`vol_sma`):
vol_sma = (Volume_1 + Volume_2 + ... + Volume_vol_period) / vol_period
2. Volume Multiplier (`vol_mult`):
vol_mult = Current Volume / vol_sma
- Thresholds:
- High Volume: `vol_mult > 2.0`
- Medium Volume: `1.5 < vol_mult ≤ 2.0`
- Low Volume: `1.0 < vol_mult ≤ 1.5`
🔶 Percentile Analysis
1. Percentile Calculation (`calcPercentile`):
Percentile = (Number of values ≤ Current Value / perc_period) * 100
2. Thresholds:
- High Percentile: >90%
- Medium Percentile: >80%
- Low Percentile: >70%
🔶 Dynamic Take-Profit Mechanism
1. ATR-Based Targets:
TP1 Price = Entry Price ± (ATR * atrMult1 * TP_Factor)
TP2 Price = Entry Price ± (ATR * atrMult2 * TP_Factor)
TP3 Price = Entry Price ± (ATR * atrMult3 * TP_Factor)
- ATR Calculation:
ATR_t = (True Range_1 + True Range_2 + ... + True Range_baseAtrLength) / baseAtrLength
2. Adjustment Factors:
TP_Factor = (vol_score + price_score) / 2
- **vol_score** and **price_score** are based on current volume and price percentiles.
Local performance
🔶 Entry and Exit Logic
1. Long Entry: If Z-Score crosses above 1.618, then Enter Long.
2. Short Entry: If Z-Score crosses below -1.618, then Enter Short.
3. Exiting Positions:
If Long and Z-Score crosses below 0:
Exit Long
If Short and Z-Score crosses above 0:
Exit Short
4. Take-Profit Execution:
- Set multiple exit orders at dynamically calculated TP levels based on ATR and adjusted by `TP_Factor`.
█ Trade Direction
The strategy determines trade direction using the Z-Score from the BBP indicator:
- Long Positions:
- Condition: Z-Score crosses above 1.618.
- Short Positions:
- Condition: Z-Score crosses below -1.618.
- Exiting Trades:
- Long Exit: Z-Score drops below 0.
- Short Exit: Z-Score rises above 0.
This approach aligns trades with prevailing market trends, increasing the likelihood of successful outcomes.
█ Usage
Implementing the BBP Strategy with Volume-Percentile TP in TradingView involves:
1. Adding the Strategy:
- Copy the Pine Script code.
- Paste it into TradingView's Pine Editor.
- Save and apply the strategy to your chart.
2. Configuring Settings:
- Adjust parameters like EMA length, Z-Score thresholds, ATR multipliers, volume periods, and percentile settings to match your trading preferences and asset behavior.
3. Backtesting:
- Use TradingView’s backtesting tools to evaluate historical performance.
- Analyze metrics such as profit factor, drawdown, and win rate.
4. Optimization:
- Fine-tune parameters based on backtesting results.
- Test across different assets and timeframes to enhance adaptability.
5. Deployment:
- Apply the strategy in a live trading environment.
- Continuously monitor and adjust settings as market conditions change.
█ Default Settings
The BBP Strategy with Volume-Percentile TP includes default parameters designed for balanced performance across various markets. Understanding these settings and their impact is essential for optimizing strategy performance:
Bull Bear Power Settings:
- EMA Length (`lengthInput`): 21
- **Effect:** Balances sensitivity and trend identification; shorter lengths respond quicker but may generate false signals.
- Z-Score Length (`zLength`): 252
- **Effect:** Long period for stable mean and standard deviation, reducing false signals but less responsive to recent changes.
- Z-Score Threshold (`zThreshold`): 1.618
- **Effect:** Higher threshold filters out weaker signals, focusing on significant market moves.
Take Profit Settings:
- Use Take Profit (`useTP`): Enabled (`true`)
- **Effect:** Activates dynamic profit-taking, enhancing profitability and risk management.
- ATR Period (`baseAtrLength`): 20
- **Effect:** Shorter period for sensitive volatility measurement, allowing tighter profit targets.
- ATR Multipliers:
- **Effect:** Define conservative to aggressive profit targets based on volatility.
- Position Sizes:
- **Effect:** Diversifies profit-taking across multiple levels, balancing risk and reward.
Volume Analysis Settings:
- Volume MA Period (`vol_period`): 100
- **Effect:** Longer period for stable volume average, reducing the impact of short-term spikes.
- Volume Multipliers:
- **Effect:** Determines volume conditions affecting take-profit adjustments.
- Volume Factors:
- **Effect:** Adjusts ATR multipliers based on volume strength.
Percentile Analysis Settings:
- Percentile Period (`perc_period`): 100
- **Effect:** Balances historical context with responsiveness to recent data.
- Percentile Thresholds:
- **Effect:** Defines price and volume percentile levels influencing take-profit adjustments.
- Percentile Factors:
- **Effect:** Modulates ATR multipliers based on price percentile strength.
Impact on Performance:
- EMA Length: Shorter EMAs increase sensitivity but may cause more false signals; longer EMAs provide stability but react slower to market changes.
- Z-Score Parameters:*Longer Z-Score periods create more stable signals, while higher thresholds reduce trade frequency but increase signal reliability.
- ATR Multipliers and Position Sizes: Higher multipliers allow for larger profit targets with increased risk, while diversified position sizes help in securing profits at multiple levels.
- Volume and Percentile Settings: These adjustments ensure that take-profit targets adapt to current market conditions, enhancing flexibility and performance across different volatility environments.
- Commission and Slippage: Accurate settings prevent overestimation of profitability and ensure the strategy remains viable after accounting for trading costs.
Conclusion
The BBP Strategy with Volume-Percentile TP offers a robust framework by combining BBP indicators with volume and percentile analyses. Its dynamic take-profit mechanism, tailored through ATR adjustments, ensures that traders can effectively capture profits while managing risks in varying market conditions.

Fibonacci Retracement Strategy for CryptoThe Enhanced Fibonacci Retracement Strategy is designed to help traders capitalize on key Fibonacci levels for both long and short trades. This script automatically identifies significant swing highs and lows within a customizable lookback period and dynamically plots Fibonacci retracement levels (0%, 23.6%, 38.2%, 50%, 61.8%, 78.6%, and 100%) as support and resistance levels.
Key Features:
Automatic Fibonacci Levels:
The script identifies the highest high and lowest low over a user-defined lookback period to calculate Fibonacci retracement levels.
Dual-Directional Trading:
Long Trades: Triggered when the price crosses above the 61.8% retracement level, anticipating a reversal.
Short Trades: Triggered when the price crosses below the 38.2% retracement level, capturing potential downward movement.
Compact Line Option:
Users can toggle "Compact Fibonacci Lines" to reduce visual clutter on the chart, making the lines shorter and easier to interpret.
Dynamic Alerts:
Alerts are embedded directly into the strategy logic for entry and exit points.
Long Entry: Triggered when the price bounces above the 61.8% level.
Long Exit: Triggered when the price reaches the 23.6% level.
Short Entry: Triggered when the price crosses below the 38.2% level.
Short Exit: Triggered when the price reaches the 78.6% level.
Clear Visualization:
Fibonacci levels are plotted with distinct colors and dashed lines (optional compact view),
providing traders with clear and actionable levels to make decisions.
Inputs:
Lookback Period: Number of candles to calculate swing highs and lows.
Plot Fibonacci Levels: Toggle to enable/disable plotting levels.
Compact Fibonacci Lines: Reduce the length of Fibonacci lines for a cleaner chart.
How It Works:
The strategy identifies a high-low range within the lookback period.
Fibonacci levels are calculated based on the range and plotted on the chart.
Long Trade Example:
Enter when the price crosses above the 61.8% level.
Exit when the price reaches the 23.6% level.
Short Trade Example:
Enter when the price crosses below the 38.2% level.
Exit when the price reaches the 78.6% level.
Best Use Cases:
Trending Markets: Use retracements to time entries in the direction of the trend.
Range-Bound Markets: Identify and trade reversals near key Fibonacci levels.
Important Notes:
This strategy is not financial advice and should be backtested thoroughly before live trading.
Risk management is crucial! Consider using stop-loss orders for protection.
Customize inputs to suit your preferred timeframe and trading style.

Smart Wick Concept (SWC)Smart Wick Concept (SWC)
The Smart Wick Concept (SWC) is a unique trend-following strategy designed to capture precise entry points in trending markets. This indicator identifies trade opportunities based on higher timeframe trends and wick behavior on lower timeframes, making it an effective tool for intraday and swing traders.
Key Features:
Trend Identification:
SWC uses the H1 timeframe to define the primary market trend (bullish or bearish), ensuring alignment with the overall market direction.
Precise Entry Signals:
Entry opportunities are generated on the M15 timeframe when a candle's wick interacts with the prior candle's range. This approach minimizes false signals and enhances accuracy.
Stop Loss and Take Profit Levels:
The indicator automatically calculates suggested stop loss and take profit levels based on market dynamics, providing traders with a clear risk-reward framework.
Customizable Parameters:
SWC allows traders to adjust key settings, such as the higher timeframe and minimum trend range, to align with their trading preferences and market conditions.
How It Works:
Bullish Entry:
Higher timeframe trend must be bullish.
A M15 candle must dip below the previous candle’s low and close back above it, signaling a potential buy opportunity.
Bearish Entry:
Higher timeframe trend must be bearish.
A M15 candle must exceed the previous candle’s high and close back below it, signaling a potential sell opportunity.
Risk Management:
Stop loss is placed at the low (for buys) or high (for sells) of the current M15 candle.
Take profit targets are calculated at twice the risk, ensuring a favorable risk-reward ratio.
Benefits:
Aligns trades with market momentum.
Reduces noise by filtering out weak or sideways trends.
Provides a structured approach to trading XAUUSD and other volatile instruments.
Use Cases:
The Smart Wick Concept is ideal for traders looking for a disciplined and data-driven approach to trading. While it is optimized for XAUUSD, it can also be applied to other trending markets such as major currency pairs or indices with some parameter adjustments.
Disclaimer:
This indicator is a trading tool and should not be used as a standalone strategy. Always backtest the indicator thoroughly and use proper risk management to protect your capital. Past performance does not guarantee future results.

Sunil High-Frequency Strategy with Simple MACD & RSISunil High-Frequency Strategy with Simple MACD & RSI
This high-frequency trading strategy uses a combination of MACD and RSI to identify quick market opportunities. By leveraging these indicators, combined with dynamic risk management using ATR, it aims to capture small but frequent price movements while ensuring tight control over risk.
Key Features:
Indicators Used:
MACD (Moving Average Convergence Divergence): The strategy uses a shorter MACD configuration (Fast Length of 6 and Slow Length of 12) to capture quick price momentum shifts. A MACD crossover above the signal line triggers a buy signal, while a crossover below the signal line triggers a sell signal.
RSI (Relative Strength Index): A shorter RSI length of 7 is used to gauge overbought and oversold market conditions. The strategy looks for RSI confirmation, with a long trade initiated when RSI is below the overbought level (70) and a short trade initiated when RSI is above the oversold level (30).
Risk Management:
Dynamic Stop Loss and Take Profit: The strategy uses ATR (Average True Range) to calculate dynamic stop loss and take profit levels based on market volatility.
Stop Loss is set at 0.5x ATR to limit risk.
Take Profit is set at 1.5x ATR to capture reasonable price moves.
Trailing Stop: As the market moves in the strategy’s favor, the position is protected by a trailing stop set at 0.5x ATR, allowing the strategy to lock in profits as the price moves further.
Entry & Exit Signals:
Long Entry: Triggered when the MACD crosses above the signal line (bullish crossover) and RSI is below the overbought level (70).
Short Entry: Triggered when the MACD crosses below the signal line (bearish crossover) and RSI is above the oversold level (30).
Exit Conditions: The strategy exits long or short positions based on the stop loss, take profit, or trailing stop activation.
Frequent Trades:
This strategy is designed for high-frequency trading, with trade signals occurring frequently as the MACD and RSI indicators react quickly to price movements. It works best on lower timeframes such as 1-minute, 5-minute, or 15-minute charts, but can be adjusted for different timeframes based on the asset’s volatility.
Customizable Parameters:
MACD Settings: Adjust the Fast Length, Slow Length, and Signal Length to tune the MACD’s sensitivity.
RSI Settings: Customize the RSI Length, Overbought, and Oversold levels to better match your trading style.
ATR Settings: Modify the ATR Length and multipliers for Stop Loss, Take Profit, and Trailing Stop to optimize risk management according to market volatility.
Important Notes:
Market Conditions: This strategy is designed to capture smaller, quicker moves in trending markets. It may not perform well during choppy or sideways markets.
Optimizing for Asset Volatility: Adjust the ATR multipliers based on the asset’s volatility to suit the risk-reward profile that fits your trading goals.
Backtesting: It's recommended to backtest the strategy on different assets and timeframes to ensure optimal performance.
Summary:
The Sunil High-Frequency Strategy leverages a simple combination of MACD and RSI with dynamic risk management (using ATR) to trade small but frequent price movements. The strategy ensures tight stop losses and reasonable take profits, with trailing stops to lock in profits as the price moves in favor of the trade. It is ideal for scalping or intraday trading on lower timeframes, aiming for quick entries and exits with controlled risk.

EMA Crossover with RSI and DistanceEMA Crossover with RSI and Distance Strategy
This strategy combines Exponential Moving Averages (EMA) with Relative Strength Index (RSI) and distance-based conditions to generate buy, sell, and neutral signals. It is designed to help traders identify entry and exit points based on multiple technical indicators.
Key Components:
Exponential Moving Averages (EMA):
The strategy uses four EMAs: EMA 5, EMA 13, EMA 40, and EMA 55.
A buy signal (long) is triggered when EMA 5 crosses above EMA 13 and EMA 40 crosses above EMA 55.
A sell signal (short) is generated when EMA 55 crosses above EMA 40.
The distance between EMAs (5 and 13) is also important. If the current distance between EMA 5 and EMA 13 is smaller than the average distance over the last 5 candles, a neutral condition is triggered, preventing a signal even if all other conditions are met.
Relative Strength Index (RSI):
The 14-period RSI is used to determine market strength and direction.
The strategy requires RSI to be above 50 and greater than the average RSI (over the past 14 periods) for a buy signal.
If the RSI is above 60, a green signal is given, indicating a strong bullish condition, even if the EMA conditions are not fully met.
If the RSI is below 40, a red signal is given, indicating a strong bearish condition, regardless of the EMA crossover.
Distance Conditions:
The strategy calculates the distance between EMA 5 and EMA 13 on each candle and compares it to the average distance of the last 5 candles.
If the current distance between EMA 5 and EMA 13 is lower than the average of the last 5 candles, a neutral signal is triggered. This helps avoid entering a trade when the market is losing momentum.
Additionally, if the distance between EMA 40 and EMA 13 is greater than the previous distance, the previous signal is kept intact, ensuring that the trend is still strong enough for the signal to remain valid.
Signal Persistence:
Once a buy (green) or sell (red) signal is triggered, it remains intact as long as the price is closing above EMA 5 for long trades or below EMA 55 for short trades.
If the price moves below EMA 5 for long trades or above EMA 55 for short trades, the signal is recalculated based on the most recent conditions.
Signal Display:
Green Signals: Represent a strong buy signal and are shown below the candle when the RSI is above 60.
Red Signals: Represent a strong sell signal and are shown above the candle when the RSI is below 40.
Neutral Signals: Displayed when the conditions for entry are not met, specifically when the EMA distance condition is violated.
Long and Short Signals: Additional signals are shown based on the EMA crossovers and RSI conditions. These signals are plotted below the candle for long positions and above the candle for short positions.
Trade Logic:
Long Entry: Enter a long trade when EMA 5 crosses above EMA 13, EMA 40 crosses above EMA 55, and the RSI is above 50 and greater than the average RSI. Additionally, the current distance between EMA 5 and EMA 13 should be larger than the average distance of the last 5 candles.
Short Entry: Enter a short trade when EMA 55 crosses above EMA 40 and the RSI is below 40.
Neutral Condition: If the distance between EMA 5 and EMA 13 is smaller than the average distance over the last 5 candles, the strategy will not trigger a signal, even if other conditions are met.

HOD/LOD/PMH/PML/PDH/PDL Strategy by @tradingbauhaus This script is a trading strategy @tradingbauhaus designed to trade based on key price levels, such as the High of Day (HOD), Low of Day (LOD), Premarket High (PMH), Premarket Low (PML), Previous Day High (PDH), and Previous Day Low (PDL). Below, I’ll explain in detail what the script does:
Core Functionality of the Script:
Calculates Key Price Levels:
HOD (High of Day): The highest price of the current day.
LOD (Low of Day): The lowest price of the current day.
PMH (Premarket High): The highest price during the premarket session (before the market opens).
PML (Premarket Low): The lowest price during the premarket session.
PDH (Previous Day High): The highest price of the previous day.
PDL (Previous Day Low): The lowest price of the previous day.
Draws Horizontal Lines on the Chart:
Plots horizontal lines on the chart for each key level (HOD, LOD, PMH, PML, PDH, PDL) with specific colors for easy visual identification.
Defines Entry and Exit Rules:
Long Entry (Buy): If the price crosses above the PMH (Premarket High) or the PDH (Previous Day High).
Short Entry (Sell): If the price crosses below the PML (Premarket Low) or the PDL (Previous Day Low).
Long Exit: If the price reaches the HOD (High of Day) during a long position.
Short Exit: If the price reaches the LOD (Low of Day) during a short position.
How the Script Works Step by Step:
Calculates Key Levels:
Uses the request.security function to fetch the HOD and LOD of the current day, as well as the highs and lows of the previous day (PDH and PDL).
Calculates the PMH and PML during the premarket session (before 9:30 AM).
Plots Levels on the Chart:
Uses the plot function to draw horizontal lines on the chart representing the key levels (HOD, LOD, PMH, PML, PDH, PDL).
Each level has a specific color for easy identification:
HOD: White.
LOD: Purple.
PDH: Orange.
PDL: Blue.
PMH: Green.
PML: Red.
Defines Trading Rules:
Uses conditions with ta.crossover and ta.crossunder to detect when the price crosses key levels.
Long Entry: If the price crosses above the PMH or PDH, a long position (buy) is opened.
Short Entry: If the price crosses below the PML or PDL, a short position (sell) is opened.
Long Exit: If the price reaches the HOD during a long position, the position is closed.
Short Exit: If the price reaches the LOD during a short position, the position is closed.
Executes Orders Automatically:
Uses the strategy.entry and strategy.close functions to open and close positions automatically based on the defined rules.
Advantages of This Strategy:
Based on Key Levels: Uses important price levels that often act as support and resistance.
Easy to Visualize: Horizontal lines on the chart make it easy to identify levels.
Automated: Entries and exits are executed automatically based on the defined rules.
Limitations of This Strategy:
Dependent on Volatility: Works best in markets with significant price movements.
False Crosses: There may be false crosses that generate incorrect signals.
No Advanced Risk Management: Does not include dynamic stop-loss or take-profit mechanisms.
How to Improve the Strategy:
Add Stop-Loss and Take-Profit: To limit losses and lock in profits.
Filter Signals with Indicators: Use RSI, MACD, or other indicators to confirm signals.
Optimize Levels: Adjust key levels based on the asset’s behavior.
In summary, this script is a trading strategy that operates based on key price levels, such as HOD, LOD, PMH, PML, PDH, and PDL. It is useful for traders who want to trade based on significant support and resistance levels.

Trend Trader-Remastered StrategyOfficial Strategy for Trend Trader - Remastered
Indicator: Trend Trader-Remastered (TTR)
Overview:
The Trend Trader-Remastered is a refined and highly sophisticated implementation of the Parabolic SAR designed to create strategic buy and sell entry signals, alongside precision take profit and re-entry signals based on marked Bill Williams (BW) fractals. Built with a deep emphasis on clarity and accuracy, this indicator ensures that only relevant and meaningful signals are generated, eliminating any unnecessary entries or exits.
Please check the indicator details and updates via the link above.
Important Disclosure:
My primary objective is to provide realistic strategies and a code base for the TradingView Community. Therefore, the default settings of the strategy version of the indicator have been set to reflect realistic world trading scenarios and best practices.
Key Features:
Strategy execution date&time range.
Take Profit Reduction Rate: The percentage of progressive reduction on active position size for take profit signals.
Example:
TP Reduce: 10%
Entry Position Size: 100
TP1: 100 - 10 = 90
TP2: 90 - 9 = 81
Re-Entry When Rate: The percentage of position size on initial entry of the signal to determine re-entry.
Example:
RE When: 50%
Entry Position Size: 100
Re-Entry Condition: Active Position Size < 50
Re-Entry Fill Rate: The percentage of position size on initial entry of the signal to be completed.
Example:
RE Fill: 75%
Entry Position Size: 100
Active Position Size: 50
Re-Entry Order Size: 25
Final Active Position Size:75
Important: Even RE When condition is met, the active position size required to drop below RE Fill rate to trigger re-entry order.
Key Points:
'Process Orders on Close' is enabled as Take Profit and Re-Entry signals must be executed on candle close.
'Calculate on Every Tick' is enabled as entry signals are required to be executed within candle time.
'Initial Capital' has been set to 10,000 USD.
'Default Quantity Type' has been set to 'Percent of Equity'.
'Default Quantity' has been set to 10% as the best practice of investing 10% of the assets.
'Currency' has been set to USD.
'Commission Type' has been set to 'Commission Percent'
'Commission Value' has been set to 0.05% to reflect the most realistic results with a common taker fee value.

IU open equal to high/low strategyIU open equal to high/low strategy:
The "IU Open Equal to High/Low Strategy" is designed to identify and trade specific market conditions where the day's first price action shows a strong directional bias. This strategy automatically enters trades based on the relationship between the market's open price and its first high or low of the day.
Entry Conditions:
1. Long Entry: A long position is initiated when the first open price of the session equals the day's first low. This signals a potential upward move.
2. Short Entry: A short position is initiated when the first open price of the session equals the day's first high. This signals a potential downward move.
Exit Conditions:
1. Stop Loss (SL): For both long and short trades, the stop loss is calculated based on the low or high of the candle where the position was entered.
2. Take Profit (TP): The take profit is set using a Risk-to-Reward (RTR) ratio, which is customizable by the user. The TP is calculated relative to the entry price and the distance between the entry and the stop loss.
Additional Features:
- Plots are used to visualize the entry price, stop loss, and take profit levels directly on the chart, providing clear and actionable insights.
- Labels are displayed to indicate the occurrence of the "Open == Low" or "Open == High" conditions for easier identification of potential trade setups.
- A dynamic fill highlights the areas between the entry price and the stop loss or take profit, offering a clear visual representation of the trade's risk and reward zones.
This strategy is designed for traders looking to capitalize on directional momentum at the start of the trading session. It is customizable, allowing users to set their desired Risk-to-Reward ratio and tailor the strategy to fit their trading style.

IU EMA Channel StrategyIU EMA Channel Strategy
Overview:
The IU EMA Channel Strategy is a simple yet effective trend-following strategy that uses two Exponential Moving Averages (EMAs) based on the high and low prices. It provides clear entry and exit signals by identifying price crossovers relative to the EMAs while incorporating a built-in Risk-to-Reward Ratio (RTR) for effective risk management.
Inputs ( Settings ):
- RTR (Risk-to-Reward Ratio): Define the ratio for risk-to-reward (default = 2).
- EMA Length: Adjust the length of the EMA channels (default = 100).
How the Strategy Works
1. EMA Channels:
- High-based EMA: EMA calculated on the high price.
- Low-based EMA: EMA calculated on the low price.
The area between these two EMAs creates a "channel" that visually highlights potential support and resistance zones.
2. Entry Rules:
- Long Entry: When the price closes above the high-based EMA (crossover).
- Short Entry: When the price closes below the low-based EMA (crossunder).
These entries ensure trades are taken in the direction of momentum.
3. Stop Loss (SL) and Take Profit (TP):
- Stop Loss:
- For long positions, the SL is set at the previous bar's low.
- For short positions, the SL is set at the previous bar's high.
- Take Profit:
- TP is automatically calculated using the Risk-to-Reward Ratio (RTR) you define.
- Example: If RTR = 2, the TP will be 2x the risk distance.
4. Exit Rules:
- Positions are closed at either the stop loss or the take profit level.
- The strategy manages exits automatically to enforce disciplined risk management.
Visual Features
1. EMA Channels:
- The high and low EMAs are dynamically color-coded:
- Green: Price is above the EMA (bullish condition).
- Red: Price is below the EMA (bearish condition).
- The area between the EMAs is shaded for better visual clarity.
2. Stop Loss and Take Profit Zones:
- SL and TP levels are plotted for both long and short positions.
- Zones are filled with:
- Red: Stop Loss area.
- Green: Take Profit area.
Be sure to manage your risk and position size properly.

InspireHER Dynamic EMA RR Positioning IndicatorDynamic EMA and RR Positioning Indicator
This indicator is designed to provide traders with highly customizable buy and sell signals based on EMA (Exponential Moving Average) crossovers and Risk-to-Reward (RR) ratios. It works on any timeframe and allows users to toggle price data and additional position boxes for visualizing trade setups. Additionally, traders can choose between displaying dots or labeled signals for buy/sell indicators, making this tool versatile and user-friendly for different preferences and strategies.
What Makes This Indicator Unique
Customizable Parameters: The script offers extensive options for tailoring the indicator to your preferred trading style and strategy:
EMA: Configurable through settings (default is a 21-period EMA).
Risk-to-Reward Ratio (RR): Adjustable to meet your desired RR levels (default is 1:2.5).
Lookback Period: Visualizes buy/sell signals over the last six months.
Position Boxes for Trade Visualization: The indicator can "draw" position boxes on the chart, showing potential entry points, stop-loss (SL), and take-profit (TP) levels based on the selected RR. These visual aids simplify decision-making and help evaluate trade opportunities directly on the chart.
Price Data Toggle: Traders can choose to view or hide price data related to trade signals, including TP, SL, and RR values. By default, this is turned off to maintain a clean chart but can be activated when needed.
Flexible Signal Display Options:
Dots Mode: Displays buy signals as green dots and sell signals as red dots on the chart.
Label Mode: Displays buy signals as labels with the word "Buy" in green and sell signals as labels with the word "Sell" in red.
This toggle allows traders to customize how signals are displayed for a more personalized trading experience.
Simple Signal View: A toggle option provides a cleaner chart by enabling or disabling additional visual elements like circles or labels.
How It Works
Buy Signal: Triggered when the price crosses the EMA and closes above it.
Entry: Top of the candle.
Stop-Loss: Bottom of the candle.
Take-Profit: Calculated based on the selected RR.
Sell Signal: Triggered when the price crosses the EMA and closes below it.
Entry: Bottom of the candle.
Stop-Loss: Top of the candle.
Take-Profit: Calculated based on the selected RR.
Default Settings
EMA: 21-period.
Risk-to-Reward Ratio: 1:2.5.
Price Data: Off (can be toggled on in settings).
Position Boxes: Off (can be toggled on in settings).
Signal Display: Labels mode with "Buy" (green) and "Sell" (red) enabled by default; can be toggled to Dots mode.
Timeframe: Any timeframe supported.
How to Use
Add the Indicator to Your Chart: Once applied, the EMA line and buy/sell signals will appear by default.
Customize Settings: Navigate to the indicator's settings to adjust EMA, RR, or enable/disable Price Data, Position Boxes, or switch between Dots and Label modes.
Trade with Confidence: Use the visual aids and signals to assess trade opportunities based on your strategy and timeframe.
This indicator combines the reliability of EMA-based signals with the flexibility of configurable RR, visual trade setups, and multiple signal display options, making it a powerful tool for all types of traders. Happy Trading!!
