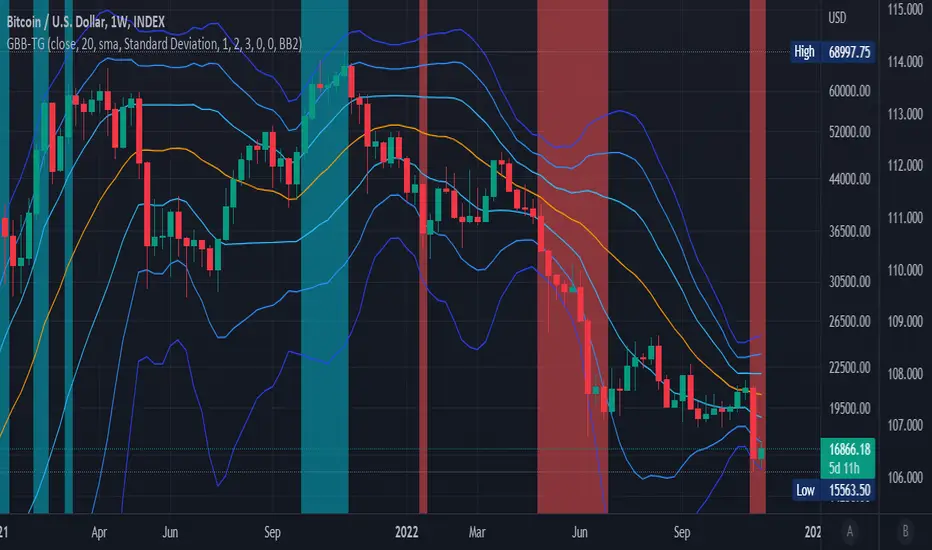
Bollinger Band Volatility Spread VisualizerThis indicator was created to see the total dollar (or whatever currency pair) amount spread between the upper and lower Bollinger Bands. This knowledge of knowing this spread can be used to indicate upcoming periods of high volatility in a market. The fundamental idea behind predicting periods of high volatility is backed up by the idea that periods of low volatility are followed by periods of high volatility and vice versa.
Based on this knowledge, the numerical spread of the Bollinger Bands, as shown in the indicator, we can deduce that when the value is super low, we can expect a period of high volatility AKA: big move incoming.
This indicator is not fully finished because this was my first time coding in Pinescript and I wanted to post the basic indicator first.
My future plans for improving this indicator include:
Adding customization as an option to choose your personal BBands settings that this indicator is based off of
Potentially converting this indicator as a TradingView Strategy where a signal would go off when the spread reaches a certain threshold
Wyszukaj w skryptach "bollingerband"
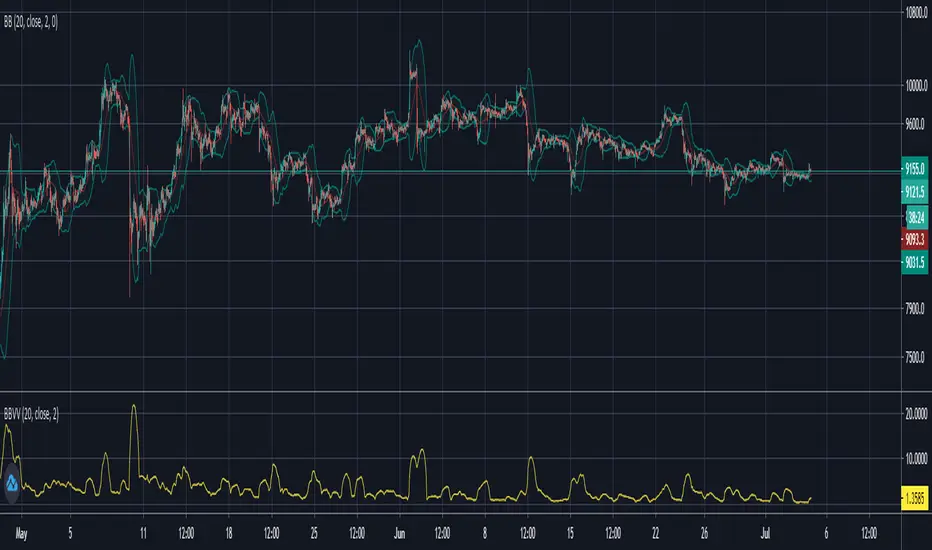
+ Bollinger Bands WidthHere is my rendition of Bollinger Bands Width. If you are unfamiliar, Bollinger Bands Width is a measure of the distance between the top and bottom bands of Bollinger Bands. Bollinger Bands themselves being a measure of market volatility, BB Width is a simpler, cleaner way of determining the amount of volatility in the market. Myself, I found the original, basic version of BB Width a bit too basic, and I thought that by adding to it it might make for an improvement for traders over the original.
Simple things that I've done are adding a signal line; adding a 'baseline' using Donchian Channels (such as that which is in my Average Candle Bodies Range indicator); adding bar and background coloring; and adding alerts for increasing volatility, and baseline and signal line crosses. It really ends up making for a much improved version of the basic indicator.
A note on how I created the baseline:
First, what do I mean by 'baseline?' I think of it as an area of the indicator where if the BB Width is below you will not want to enter into any trades, and if the BB Width is above then you are free to enter trades based on your system. It's basically a volatility measure of the volatility indicator. Waddah Attar Explosion is a popular indicator that implements something similar. The baseline is calculated thus: make a Donchian Channel of the BB Width, and then use the basis as the baseline while not plotting the actual highs and lows of the Donchian Channel. Now, the basis of a Donchian Channel is the average of the highs and the lows. If we did that here we would have a baseline much too high, however, by making the basis adjustable with a divisor input it no longer must be plotted in the center of the channel, but may be moved much lower (unless you set the divisor to 2, but you wouldn't do that). This divisor is essentially a sensitivity adjustment for the indicator. Of course you don't have to use the baseline. You could ignore it and only use the signal line, or just use the rising and falling of the BB Width by itself as your volatility measure.
I should make note: the main image above at default settings is an 8 period lookback (so, yes, that is quite fast), and the signal line is a Hull MA set to 13. The background and bar coloring are simply set to the rising and falling of the BB Width. Images below will show some different settings, but definitely play with it yourself to determine if it might be a good fit for your system.
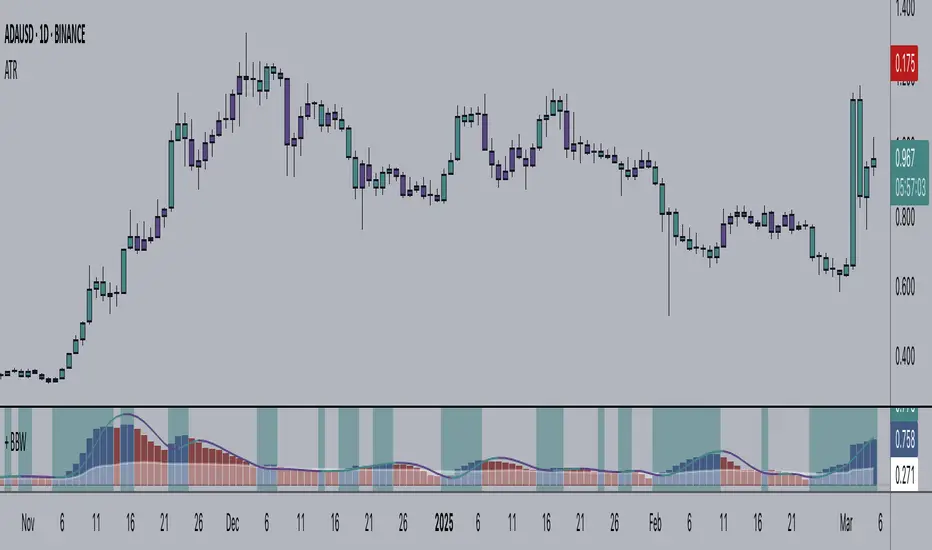
Above, settings are background and bar coloring tuned to BB Width being above the baseline, and also requiring that the BB Width be rising. Background coloring only highlights increasing volatility or volatility above a certain threshold. Grey candles are because the BB Width is above the baseline but falling. We'll see an example without the requirement of BB Width rising, below.
Here, we see that background highlights and aqua candles are more prevalent because I've checked off the requirement that BB Width be rising. The idea is that BB Width is above the baseline therefor there is sufficient volatility to enter trades if our indicators give us the go-ahead.
This here is set to BB Width being above the signal line and also requiring a rising BB Width. Keep in mind the signal line is a Hull MA.
And this fourth and final image uses a volume-weighted MA as the signal line. Bar coloring is turned off, and instead the checkboxes for volatility advancing and declining are turned on under the signal line options. BB Width crosses up the signal line is advancing volatility, while falling below it is declining volatility. Background highlights are set to baseline and not requiring a rising BB Width. This way, with a quick glance you can see if the rising volatility is legitimate, i.e., is the cross up of the signal line coupled with it being above the baseline.
Please enjoy.
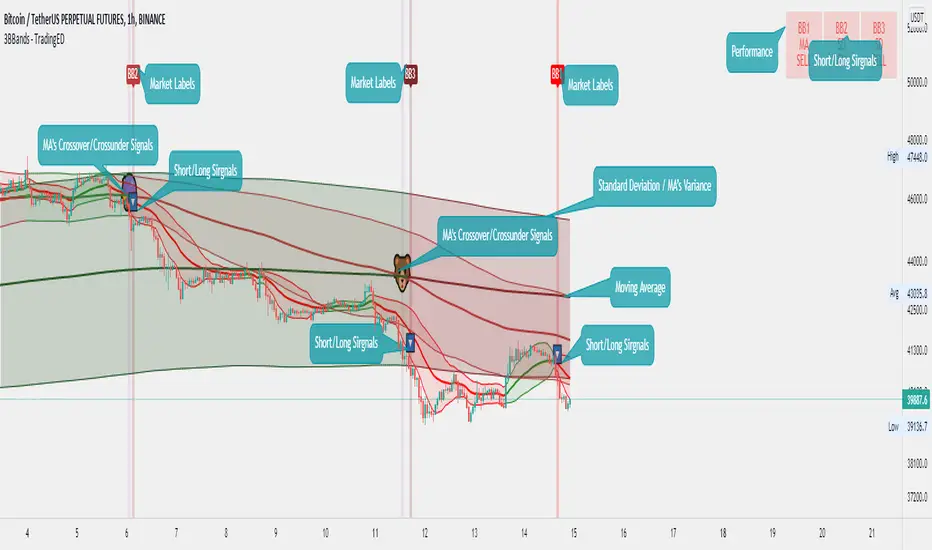
Bollinger Bands Triple - TradingEDThis case study is based on a previous Bollinger Bands study, but with 3 different counts to compare different trends. The use of this indicator is restricted to private use and it can be used only by invitation. Different functionalities have been added to the original code, such as alerts and signals that seek to make trading much easier to interpret by any type of trading operator of any experience level, from beginner to intermediate and advanced .
Key components of the original indicator:
• The Bollinger Bands are a technical analysis tool developed by John Bollinger to generate signals of overbuying and overselling.
• There are three lines that compose Bollinger Bands: one Simple Moving Average (middle band) and an upper and lower band.
• The Upper and Lower Bands are typically used with 2 Standard Deviations +/- of a 20-day Simple Moving Average (or 20 candles) but can be modified.
The use of Bollinger Bands is based on the concept of mean price reversal, assuming that if the price deviates from the Moving Average it will eventually return to the mean price. As recognized by its creator: John Bollinger , " the touches of the bands are just that, touches, not signals ".
So, a touch from the top is not in itself a sell signal and vice versa, a touch below should not be a buy signal either. A trader must look at the general direction of the price and then only take signals that align with the trend. For example, if the trend is down, you should only consider short positions when the lower band is indicated, and in case of an uptrend, take only long positions.
Another important point in the use of this indicator is that the bands will expand and contract as the Price Action becomes volatile (expansion) or is limited in its trading pattern (contraction). After a strong rise or fall in the trend, the market may consolidate, trading closely and crossing over and below the Moving Average until defining a new course, or continuing with the previous direction.
Main functions of this modified indicator:
1) You can select the type of MOVING AVERAGE , among many available options ( SMA , EMA , DEMA , HMA , etc.)
2) The SOURCE for the count can be determined by the trader (close, open, etc).
3) The MEASURE can be based on a CANDLES count if you are trading OHLC Charts from 1D onwards, or if your trading is intraday, you can also select counts by MINUTES , HOURS or DAYS , depending on your trading style.
4) LENGTH , by default it will be loaded as 20 but considering the previous point, you can modify it according to your convenience.
5) STANDARD DEVIATION , by default it will come loaded with 2 deviations, but you can modify it according to your convenience to operate.
6) You have the option to hide or show a LABEL at the top of the chart, with respect to the signals: bullish green, bearish red.
7) You have the option to hide or show SIGNALS based on the MOVING AVERAGE that you have previously chosen.
8) You have the option to hide or show SIGNALS based on the STANDARD DEVIATION that you have previously chosen.
Main functions to customize the style of this indicator:
a) You can select the colors for the UPPER BAND, MOVING AVERAGE and LOWER BAND depending on the trend, whether it is BEARISH or BULLISH , with the colors that best suit you. *
b) When you have a SHORT SIGNAL or a LONG SIGNAL , you can change the EMOTICON that comes by default. **
c) For any type of SIGNAL , it is painted as a VERTICAL LINE in the graph, you can change the color that comes by default. *
d) In the case of the LABELS that appear at the top, the text is not modifiable, but you can customize both the type of label and change the default color. *
e) You can select the colors for the BACKGROUND of the indicator according to the trend, whether it is BEARISH or BULLISH , with the colors that best suit you. *
* By default, they are marked as red for downtrends and green for uptrends.
** By default, they are marked with an emoticon indicating the possible direction of the price, down if it is bearish or up if it is bullish .
Bollinger Bands Double - TradingEDThis case study is based on a previous Bollinger Bands study, but with two different counts to compare different trends. The use of this indicator is restricted to private use and it can be used only by invitation. Different functionalities have been added to the original code, such as alerts and signals that seek to make trading much easier to interpret by any type of trading operator of any experience level, from beginner to intermediate and advanced.
Key components of the original indicator:
• The Bollinger Bands are a technical analysis tool developed by John Bollinger to generate signals of overbuying and overselling.
• There are three lines that compose Bollinger Bands: one Simple Moving Average (middle band) and an upper and lower band.
• The Upper and Lower Bands are typically used with 2 Standard Deviations +/- of a 20-day Simple Moving Average (or 20 candles) but can be modified.
The use of Bollinger Bands is based on the concept of mean price reversal, assuming that if the price deviates from the Moving Average it will eventually return to the mean price. As recognized by its creator: John Bollinger, "the touches of the bands are just that, touches, not signals" .
So, a touch from the top is not in itself a sell signal and vice versa, a touch below should not be a buy signal either. A trader must look at the general direction of the price and then only take signals that align with the trend. For example, if the trend is down, you should only consider short positions when the lower band is indicated, and in case of an uptrend, take only long positions.
Another important point in the use of this indicator is that the bands will expand and contract as the Price Action becomes volatile (expansion) or is limited in its trading pattern (contraction). After a strong rise or fall in the trend, the market may consolidate, trading closely and crossing over and below the Moving Average until defining a new course, or continuing with the previous direction.
Main functions of this modified indicator:
1) You can select the type of MOVING AVERAGE , among many available options (SMA, EMA, DEMA, HMA, etc.)
2) The SOURCE for the count can be determined by the trader (close, open, etc).
3) The MEASURE can be based on a CANDLES count if you are trading OHLC Charts from 1D onwards, or if your trading is intraday, you can also select counts by MINUTES , HOURS or DAYS , depending on your trading style.
4) LENGTH , by default it will be loaded as 20 but considering the previous point, you can modify it according to your convenience.
5) STANDARD DEVIATION , by default it will come loaded with 2 deviations, but you can modify it according to your convenience to operate.
6) You have the option to hide or show a LABEL at the top of the chart, with respect to the signals: bullish green, bearish red.
7) You have the option to hide or show SIGNALS based on the MOVING AVERAGE that you have previously chosen.
8) You have the option to hide or show SIGNALS based on the STANDARD DEVIATION that you have previously chosen.
Main functions to customize the style of this indicator:
a) You can select the colors for the UPPER BAND , MOVING AVERAGE and LOWER BAND depending on the trend, whether it is BEARISH or BULLISH , with the colors that best suit you. *
b) When you have a SHORT SIGNAL or a LONG SIGNAL , you can change the EMOTICON that comes by default. **
c) For any type of SIGNAL , it is painted as a VERTICAL LINE in the graph, you can change the color that comes by default. *
d) In the case of the LABELS that appear at the top, the text is not modifiable, but you can customize both the type of label and change the default color. *
e) You can select the colors for the BACKGROUND of the indicator according to the trend, whether it is BEARISH or BULLISH , with the colors that best suit you. *
* By default, they are marked as red for downtrends and green for uptrends.
** By default, they are marked with an emoticon indicating the possible direction of the price, down if it is bearish or up if it is bullish.

Bollinger Bands Width DonchianThis script was written for release to my followers in tandem with a video idea on how to use it.
The script draws a line on a lower chart to display the Bollinger Bands Width. The default bars counted for this is 20.
The script then draws and upper and lower Donchian line that moves with the highest high and lowest low of Bollinger Bands Width. The default value of this Donchian is 200. When the Bollinger Bands Width line makes a new Donchian low it highlights the bars for visual recognition.
I have also added alert functionality that can be set to alert when a new low is made.

Bollinger Bands Width DonchianThis script measures the (default 20) Bollinger Band Width and draws a line. When the Bollinger Band compresses the indicator goes down and when it expands the indicator goes up. When the Bollinger Band Width compresses and expands to the lowest or highest degree for the last number of bars (default 200) it moves the Donchian lines to indicate the lowest and highest point for that period.

Fancy Bollinger Bands Strategy [BigBitsIO]This script is for a Bollinger Band type indicator with built-in TradingView strategy including as many features as I can possibly fit into a Bollinger Band type indicator including a wide variety of options to create the most flexible Bollinger Bands strategy possible.
Features:
- A single custom moving average serving as the middle band.
- Standard MA inputs.
- MA type.
- MA period.
- MA price.
- MA resolution (time frame).
- Visibility toggle.
- MA Candle Type
- Fancy MA inputs.
- Toggle to show only candles included in the MA calculation ("Highlight inclusion") or display entire MA history.
- Toggle to show a ghost trail when Highlight inclusion is toggled on. Displays a shaded version of past MA history before the inclusion period (as seen on snapshot).
- Toggle to show forecast values for the MA.
- Other inputs related to forecasting:
- Forecast bias. (Neutral forecasts MA if the current price remains the same.)
- Forecast period.
- Forecast magnitude.
- Toggle showing details on the screen
- Toggle the visibility of the fill between the upper and lower bands.
- Toggle to use ATR instead of the standard deviation to calculate the location of the upper and lower bands.
- Custom input for the ATR period.
Strategy Features
-Strategy Window - only test during this window
-Take Profit and Stop Loss
-Open and Close conditions, including condition counts and any/all requirements
-Many conditions to choose from that can either be selected to open, close or open and close a position
-Conditions include:
-Price crossing above/below the Upper, Middle, or Lower bands
-Price being above/below the Upper, Middle, or Lower bands
-Bollinger Band width crossing or being above/below custom values
-Percent B crossing or being above/below custom values
This script may contain errors, or out of date code. Please be mindful of updates to the script.
*** DISCLAIMER: For educational and entertainment purposes only. Nothing in this content should be interpreted as financial advice or a recommendation to buy or sell any sort of security or investment including all types of crypto. DYOR, TYOB. ***

Modified Smoothed Heiken AshiThis code is based on Smoothed HA candle which will work on all chart types
condition for BUY:
1. When close crosses Smoothed HA
2.Close should be in side upper band
3.BBW must be greater than the average
vice versa for sell
this code takes data from HA chart so that it can be applied on all chart type.
Bollinger band and Bollinger band width conditions added for removal of unwanted signals
Alert added so that you can apply alert and check it in real time performance
thanks to The Secret Mindset You tube channel from where I got the idea to convert this into a pine script indicator
smooth HA taken from "Smoothed Heiken Ashi Candles v1" at //@jackvmk

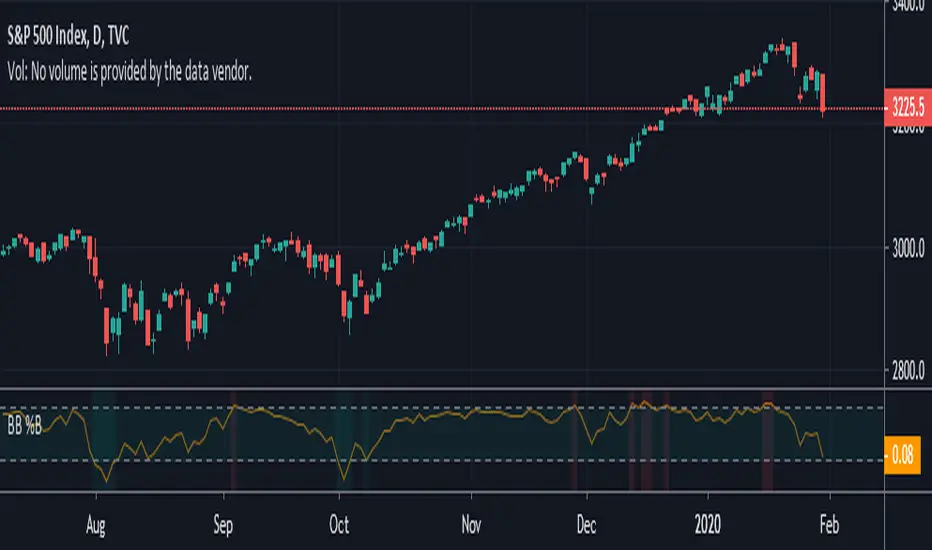
Bollinger Bands %B with HighlightsThis script highlights the indicator background when the Bollinger Bands are breached making it easier to spot them.
Good for strategies that rely on Bollinger Band breaches
Note: Clean version
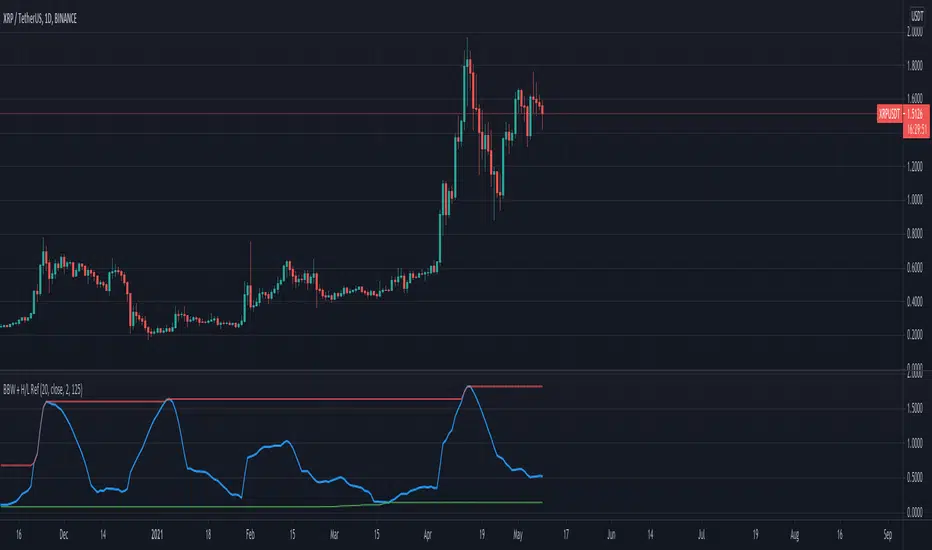
Bollinger BandWidth With High/Low ReferencesThis indicator ads option to compare BandWidth accross time. John Bollinger says he uses 125 period.
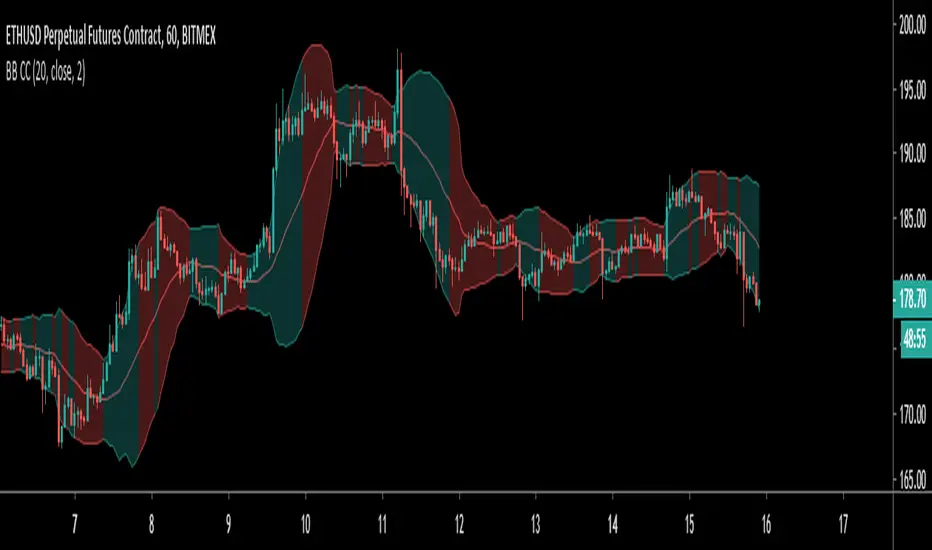
Colour Coded Bollinger BandsBollinger Bands coloured to more clearly show periods of contraction and expansion. Green filled bands indicate expansion/increasing bandwidth, and red fill indicates contraction/decreasing bandwidth.

IO_BB_WidthJohn Bollinger's academic version of Bollinger Bands width
Added some customizations around background colors.
If background color is colored, then the market is trending.

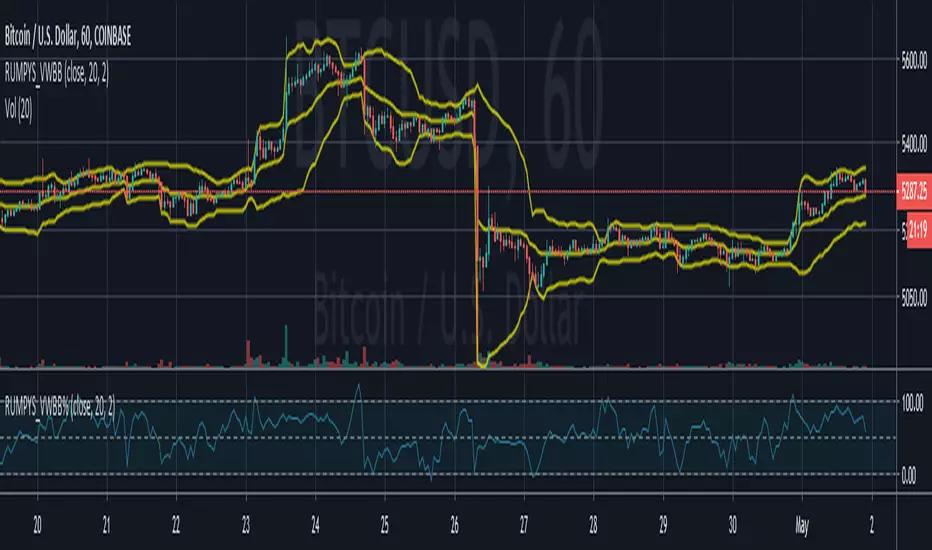
Rumpy's Volume Weighted Bollinger Bands % (B%)Bollinger Band % constructed using a volume weighted EMA as the basis and a volume weighted standard deviation to calculate the bands.
---------------------------------------
If you find it useful please consider a tip/donation :
BTC - 3BMEXEDyWJ58eXUEALYPadbn1wwWKmf6sA
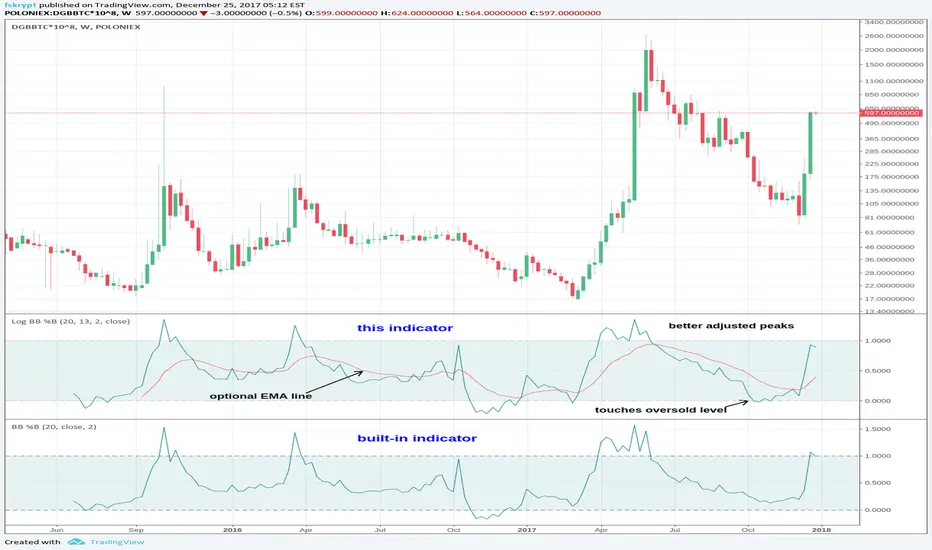
Log Bollinger Bands %BB Oscillator [Krypt]This indicator is almost identical to "Bollinger Bands %BB" except its calculations are performed in logspace and it adds an optional EMA line (after LazyBear's idea).
VDUB BB %B REVERSAL_v4.2 revised by JustUncleLThis is an revised Open Public version of Vdub Bollinger Band %B reversal indicator. This version includes optional Divergence Finder with selectable channel width, optional Market Session time highlighting and optional Binary Option expiry markers.

Bollinger Bands Mean Reversion using RSI [Krishna Peri]How it Works
Long entries trigger when:
- RSI reaches oversold levels, and
- At least one bullish candle closes inside the lower Bollinger Band
Short entries trigger when:
- RSI reaches overbought levels, and
- At least one bearish candle closes inside the upper Bollinger Band
This approach aims to capture exhaustion moves where price pushes into extreme deviation from its mean and then snaps back toward the middle band.
Important Disclaimer
This is a mean-reversion strategy, which means it performs best in sideways, ranging, or slowly oscillating market conditions. When markets shift into strong trends, Bollinger Bands expand and volatility increases, which may cause some signals to become inaccurate or fail altogether.
For best results, combine this script with:
- Price action
- Market structure
- Higher-timeframe trend context
- Previous day/week/month highs & lows
- Untested liquidity levels or imbalance zones
- Session timing (Asia, London, NY)
Using these confluences helps filter out low-probability trades and significantly improves consistency and precision.

BB Breakout + Momentum Squeeze [Strategy]This Strategy is Based on 3 free indicators
- Bollinger Bands Breakout Oscillator: Link
- TTM Squeeze Pro: Link
- Rolling ATR Bands: Link
Bollinger Bands Breakout Oscillator - This tool shows how strong a market trend is by measuring how often prices move outside their normal Bollinger bands range. It helps you see whether prices are strongly moving in one direction or just moving sideways. By looking at how much and how frequently prices push beyond their typical boundaries, you can identify which direction the market is heading over your selected time period.
TM Squeeze Pro - This is a custom version of the TTM Squeeze indicator.
It's designed to help traders spot consolidation phases in the market (when price is coiling or "squeezing") and to catch breakouts early when volatility returns. The logic is based on the relationship between Bollinger Bands and Keltner Channels, combined with a momentum oscillator to show direction and strength.
Rolling ATR Bands - This indicator combines volatility bands (ATR) with momentum and trend signals to show where the market might be breaking out, retesting, or trending. It's highly visual and helpful for traders looking to time entries/exits during trending or volatile moves.
Logic Of the Strategy:
We are going to use the Bollinger Bands Breakout to determine the direction of the market. Than check the Volatility of the price by looking at the TTM Squeeze indicator. And use the ATR Bands to determine dynamic Stop Losses and based on the calculate the Take Profit targets and quantity for each position dynamically.
For the Long Setup:
1. We need to see the that Bull Power (Green line of the Bollinger Bands Breakout Oscilator) is crossing the level of 50.
2. Check the presence of volatility (Green dot based on the TTM Squeeze indicator)
For the Short Setup:
1. We need to see the that Bear Power (Red line of the Bollinger Bands Breakout Oscilator) is crossing the level of 50.
2. Check the presence of volatility (Green dot based on the TTM Squeeze indicator)
Stop Loss is determined by the Lower ATR Band (for the Long entry) and Upper ATR Band (For the Short entry)
Take Profit is 1:1.5 risk reward ration, which means if the Stop loss is 1% the TP target will be 1.5%
Move stop Loss to Breakeven: If the price will go in the direction of the trade for at least half of the Risk Reward target then the stop will automatically be adjusted to the entry price. For Example: the Stop Loss is 1%, the price has move at least 0.5% in the direction of your trade and that will move the Stop Loss level to the Entry point.
You can Adjust the parameters for each indicator used in that script and also adjust the Risk and Money management block to see how the PnL will change.

SOLANA Performance & Volatility Analysis BB%Overview:
The script provides an in-depth analysis of Solana's performance and volatility. It showcases Solana's price, its inverse relationship, its own volatility, and even juxtaposes it against Bitcoin's 24-hour historical volatility. All of these are presented using the Bollinger Bands Percentage (BB%) methodology to normalise the price and volatility values between 0 and 1.
Key Components:
Inputs:
SOLANA PRICE (SOLUSD): The price of Solana.
SOLANA INVERSE (SOLUSDT.3S): The inverse of Solana's price.
SOLANA VOLATILITY (SOLUSDSHORTS): Volatility for Solana.
BITCOIN 24 HOUR HISTORICAL VOLATILITY (BVOL24H): Bitcoin's volatility over the past 24 hours.
BB Calculations:
The script uses the Bollinger Bands methodology to calculate the mean (SMA) and the standard deviation of the prices and volatilities over a certain period (default is 20 periods). The calculated upper and lower bands help in normalising the values to the range of 0 to 1.
Normalised Metrics Plotting:
For better visualisation and comparative analysis, the normalised values for:
Solana Price
Solana Inverse
Solana Volatility
Bitcoin 24hr Volatility
are plotted with steplines.
Band Plotting:
Bands are plotted at 20%, 40%, 60%, and 80% levels to serve as reference points. The area between the 40% and 60% bands is shaded to highlight the median region.
Colour Coding:
Different colours are used for easy differentiation:
Solana Price: Blue
Solana Inverse: Red
Solana Volatility: Green
Bitcoin 24hr Volatility: White
Licence & Creator:
The script adheres to the Mozilla Public Licence 2.0 and is credited to the author, "Volatility_Vibes".
Works well with Breaks and Retests with Volatility Stop

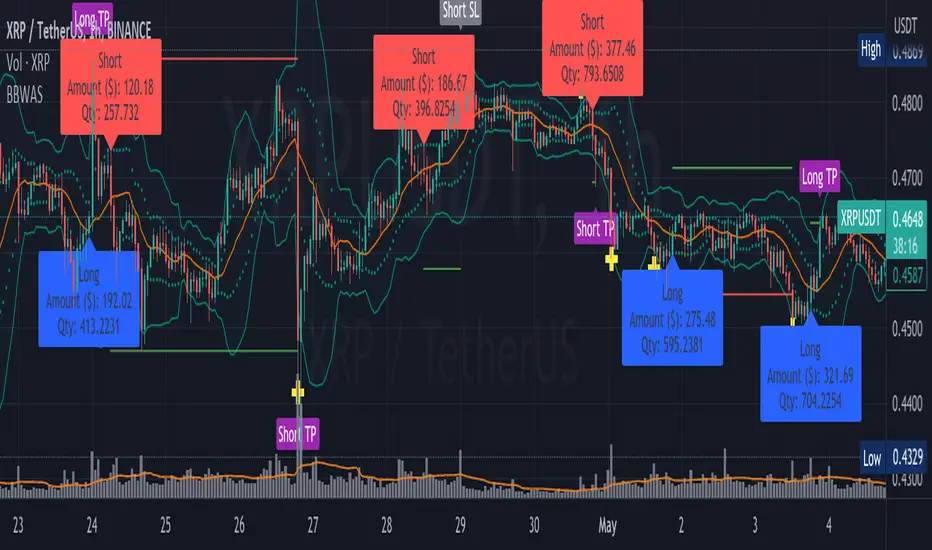
BBWAS Enhanced with Webhook Alerts and Money ManagementThe Enhanced BBWAS Indicator is a powerful tool designed to identify breakouts in the price of a security or asset. It utilizes Bollinger Bands, which consist of three lines: the upper band, the lower band, and the middle band (or basis). These bands help define the expected price range within which the asset is likely to fluctuate.
When the price breaks above the upper band or below the lower band, it indicates a potential breakout. A bullish breakout occurs when the price closes above the upper band, while a bearish breakout occurs when the price closes below the lower band.
In this enhanced version of the indicator, several new features have been added to provide more flexibility and functionality:
Webhook Alerts: Traders now have the ability to configure webhook alerts to trigger a bot or any external system. This allows for timely notifications when a breakout occurs, enabling automated actions or manual intervention as desired.
Multiple Moving Average Types: The indicator now supports different types of moving averages for increased customization. Traders can choose from popular moving average types such as Simple Moving Average (SMA), Exponential Moving Average (EMA) and Weighted Moving Average (WMA). This enables users to experiment and find the moving average type that best suits their trading strategy.
Money Management: To assist traders in managing risk, a money management feature has been incorporated into the indicator. It calculates the optimal position size or number of units to purchase for each trade, considering the desired risk per trade. By specifying a maximum risk per trade, traders can ensure that their position sizes are adjusted accordingly, helping to maintain risk control in their trading activities.
Dear traders, while we strive to provide you with the best trading tools and resources, we want to remind you to exercise caution and diligence in your investing decisions.
It is important to always do your own research and analysis before making any trades. Remember, the responsibility for your investments ultimately lies with you.
Happy trading!
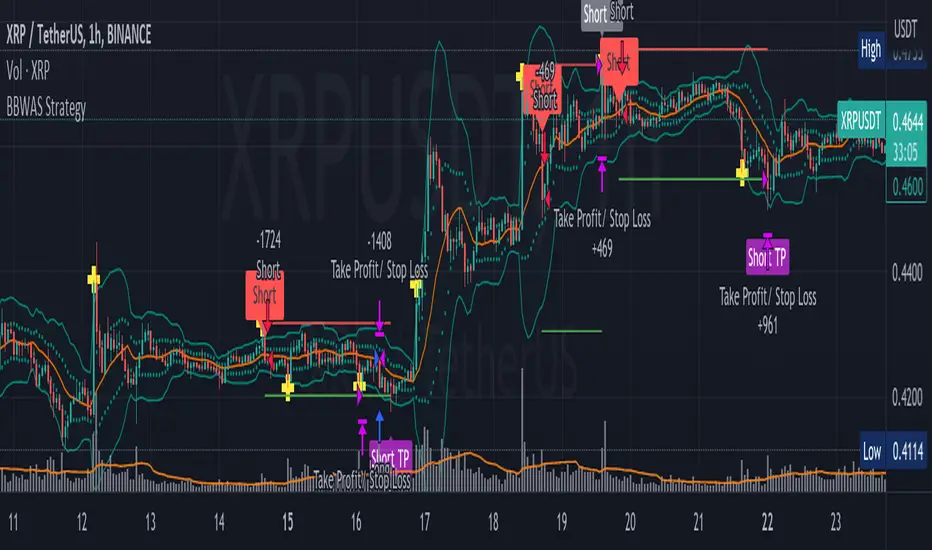
BBWAS StrategyA breakout in trading refers to a situation where the price of a security or asset moves beyond a defined level of support or resistance, which is typically indicated by technical analysis tools like Bollinger Bands . Bollinger Bands consist of three lines: the upper band, the lower band, and the middle band (or basis). The upper and lower bands are set at a specified number of standard deviations away from the middle band, and they help to define the range within which the price of an asset is expected to fluctuate.
When the price of the asset moves beyond the upper or lower band, it is said to have "broken out" of the range. If the price closes below the lower band, it is considered a bearish breakout, and if it closes above the upper band, it is considered a bullish breakout.
Once a breakout occurs, traders may look for a confirmation signal before entering a trade. In this case, crossing the middle line (or basis) after a breakout may signal a potential trend reversal and a good opportunity to enter a long or short trade, depending on the direction of the breakout.
Overall, this script provides a customizable and flexible system for traders to use Bollinger Bands to identify breakout trades, with additional features to incorporate volume and RSI divergence. The dynamic TPSL system also allows traders to manage their risk and reward by automatically setting take-profit and stop-loss levels based on the volatility of the market.
Dear traders, while we strive to provide you with the best trading tools and resources, we want to remind you to exercise caution and diligence in your investing decisions.
It is important to always do your own research and analysis before making any trades. Remember, the responsibility for your investments ultimately lies with you.
Happy trading!
Fibonacci Volatility BandsFibonacci Volatility Bands are just an alternative that allows for more margin than regular Bollinger Bands. They are created based on an average of moving averages that use the Fibonacci sequence as lookback periods.
The use of the Fibonacci Volatility Bands is exactly the same as the Bollinger Bands.

Generalized Bollinger Bands (Tartigradia)Bollinger Band is simply a representation of the rolling average of price and its standard deviation around the average (called the "basis").
This indicator generalizes the Bollinger Band by implementing many different equations to calculate the Bollinger Bands beyond the standard deviation and sma.
Whereas other Bollinger Bands indicators often just change the basis but not the stdev calculation, the correct way to change the basis is to also change it inside the stdev calculation.
Advanced features such as temporal discounting (ie, newer bars can have more weights), median absolute deviation and multiple sigma bands (eg, 3-sigma) are available.
Up to 3 different Bollinger Bands can be displayed, and the background can be highlighted when price is overbought/oversold (beyond the Bollinger Band of choice).
Tip: BB3, which is the bollinger band with standard deviation of 3, which represents 99% of observed values in the lookback period, is a good choice to highlight overbought/oversold conditions.
Usage:
Use it as usual Bollinger Bands, as a measure of volatility, and to setup stop losses.
Use the bandwidth as a measure of volatility: higher is more volatile, lower is less.
When overbought, it can be a good time to sell/short. Use a higher Bollinger Band Multiplier such as 3 or more to reduce false positives.
When oversold, it can be a good time to buy/long. Use a higher Bollinger Band Multiplier such as 3 or more to reduce false positives.
Consider setting a much tighter lookback period of 4 as recommended in backtested works (en.wikipedia.org), use zlma instead of sma, and finally set a higher timeframe for the Bollinger Bands than the one you are currently studying. Then, the Bollinger Bands can help in detecting overbought and oversold regions (price going "out of bands").
Note that I tried to automate the setting of a higher timeframe, but for some reason the output is different when I manually do it using request.security() than when it's in indicator(timeframe=""). If someone has any suggestion as to why it happens, please let me know! (You can try it for yourself by uncommenting the auto_timeframe parameter line).
If you want to plot the indicator in a separate pane, and to also plot %B and bandwidth, I made another indicator "Generalized Bollinger Bands %B and Bandwidth by Tartigradia" that does that.