VEMA Band_v2 - 'Centre of GravityConcept taken from the MT4 indicator 'Centre of Gravity'except this one doesn't repaint.
Modified / BinaryPro 3 / Permanent Marker
Ema configuration instead of sma & centralised.
Wyszukaj w skryptach "binary"

Vdub_Tetris_Stoch_V1Vdub_Tetris_Stoch_V1
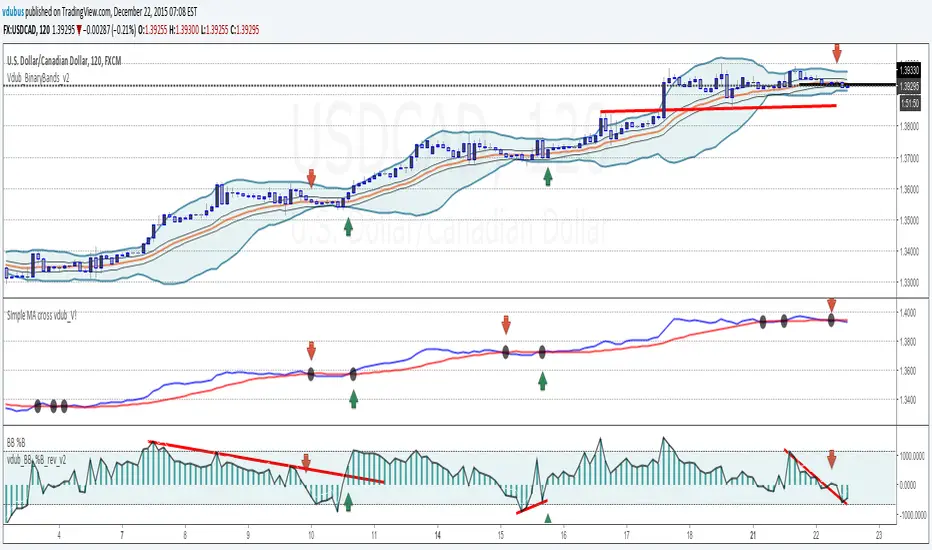
A combination lower based indicators based on the period channel indicator Vdub_Tetris_V2
Blue line is more reactive fast moving, Red line in more accurate to highs / Lows with divergence.- Still testing
Code title error
Change % = Over Bought / Over Sold
Vdub Tetris_V2
Vdubus BinaryPro 2 /Tops&Bottoms
StochDM

HFX321This indicator will provide the possibility of when trend reversals may happen on shorter time frames. It can work on any time frame and the use of Heiken Ashi candles can enhance it further.
When used with other indicators such as the Stochastic RSI, support, resistance and trend lines, it can increase the possibility of a trend reversal being identified. On shorter time frames the alerts are much more frequent therefore can be less accurate so other indicators may be used.
It will show an alert Arrow (green) pointing UP for the First Candle after a pivot LOW (LL, HL) that could indicate a trend reversal.
It will show an alert Arrow (red) pointing DOWN for the First Candle after a pivot HIGH (HH, LH) that could indicate a trend reversal.
The Colour changes on the Moving Average from Red to Green and green to red to support a trend change possibility.
This has been designed to provide a visual confirmation that selected indicators have met certain criteria and that the trend has the possibility of reversing in the near future.
It is NOT meant to be a trading system or offer trading advice. The indicator offers only possibilities of trend reversals when the above criteria is met.
This is designed for Trend analysis ONLY.
To gain access to this invite only script, please send me a private message on Trading View so I can assist you further.
Thanks Les Gallagher


Moving Average ExponentialThe EMA 50 Trend Filter At the heart of the Sniper system lies the 50-period Exponential Moving Average. Unlike simple moving averages, the EMA applies a weighting factor to recent price data, significantly reducing lag. Role in Strategy:
Trend Identification: Serves as the binary divider between Long and Short bias.
Dynamic Structure: Acts as dynamic support in uptrends and resistance in downtrends.
Signal Filtering: The algorithm automatically suppresses any 'Buy' signals below the line and 'Sell' signals above it, ensuring you never trade against the institutional momentum.

Impulse Reactor RSI-SMA Trend Indicator [ApexLegion]Impulse Reactor RSI-SMA Trend Indicator
Introduction and Theoretical Background
Design Rationale
Standard indicators frequently generate binary 'BUY' or 'SELL' signals without accounting for the broader market context. This often results in erratic "Flip-Flop" behavior, where signals are triggered indiscriminately regardless of the prevailing volatility regime.
Impulse Reactor was engineered to address this limitation by unifying two critical requirements: Quantitative Rigor and Execution Flexibility.
The Solution
Composite Analytical Framework This script is not a simple visual overlay of existing indicators. It is an algorithmic synthesis designed to function as a unified decision-making engine. The primary objective was to implement rigorous quantitative analysis (Volatility Normalization, Structural Filtering) directly within an alert-enabled framework. This architecture is designed to process signals through strict, multi-factor validation protocols before generating real-time notifications, allowing users to focus on structurally validated setups without manual monitoring.
How It Works
This is not a simple visual mashup. It utilizes a cross-validation algorithm where the Trend Structure acts as a gatekeeper for Momentum signals:
Logic over Lag: Unlike simple moving average crossovers, this script uses a 15-layer Gradient Ribbon to detect "Laminar Flow." If the ribbon is knotted (Compression), the system mathematically suppresses all signals.
Volatility Normalization: The core calculation adapts to ATR (Average True Range). This means the indicator automatically expands in volatile markets and contracts in quiet ones, maintaining accuracy without constant manual tweaking.
Adaptive Signal Thresholding: It incorporates an 'Anti-Greed' algorithm (Dynamic Thresholding) that automatically adjusts entry criteria based on trend duration. This logic aims to mitigate the risk of entering positions during periods of statistical trend exhaustion.
Why Use It?
Market State Decoding: The gradient Ribbon visualizes the underlying trend phase in real-time.
◦ Cyan/Blue Flow: Strong Bullish Trend (Laminar Flow).
◦ Magenta/Pink Flow: Strong Bearish Trend.
◦ Compressed/Knotted: When the ribbon lines are tightly squeezed or overlapping, it signals Consolidation. The system filters signals here to avoid chop.
Noise Reduction: The goal is not to catch every pivot, but to isolate high-confidence setups. The logic explicitly filters out minor fluctuations to help maintain position alignment with the broader trend.
⚖️ Chapter 1: System Architecture
Introduction: Composite Analytical Framework
System Overview
Impulse Reactor serves as a comprehensive technical analysis engine designed to synthesize three distinct market dimensions—Momentum, Volatility, and Trend Structure—into a unified decision-making framework. Unlike traditional methods that analyze these metrics in isolation, this system functions as a central processing unit that integrates disparate data streams to construct a coherent model of market behavior.
Operational Objective
The primary objective is to transition from single-dimensional signal generation to a multi-factor assessment model. By fusing data from the Impulse Core (Volatility), Gradient Oscillator (Momentum), and Structural Baseline (Trend), the system aims to filter out stochastic noise and identify high-probability trade setups grounded in quantitative confluence.
Market Microstructure Analysis: Limitations of Conventional Models
Extensive backtesting and quantitative analysis have identified three critical inefficiencies in standard oscillator-based strategies:
• Bounded Oscillator Limitations (The "Oscillation Trap"): Traditional indicators such as RSI or Stochastics are mathematically constrained between fixed values (0 to 100). In strong trending environments, these metrics often saturate in "overbought" or "oversold" zones. Consequently, traders relying on static thresholds frequently exit structurally valid positions prematurely or initiate counter-trend trades against prevailing momentum, resulting in suboptimal performance.
• Quantitative Blindness to Quality: Standard moving averages and trend indicators often fail to distinguish the qualitative nature of price movement. They treat low-volume drift and high-velocity expansion identically. This inability to account for "Volatility Quality" leads to delayed responsiveness during critical market events.
• Fractal Dissonance (Timeframe Disconnect): Financial markets exhibit fractal characteristics where trends on lower timeframes may contradict higher timeframe structures. Manual integration of multi-timeframe analysis increases cognitive load and susceptibility to human error, often resulting in conflicting biases at the point of execution.
Core Design Principles
To mitigate the aforementioned systemic inefficiencies, Impulse Reactor employs a modular architecture governed by three foundational principles:
Principle A:
Volatility Precursor Analysis Market mechanics demonstrate that volatility expansion often functions as a leading indicator for directional price movement. The system is engineered to detect "Volatility Deviation" — specifically, the divergence between short-term and long-term volatility baselines—prior to its manifestation in price action. This allows for entry timing aligned with the expansion phase of market volatility.
Principle B:
Momentum Density Visualization The system replaces singular momentum lines with a "Momentum Density" model utilizing a 15-layer Simple Moving Average (SMA) Ribbon.
• Concept: This visualization represents the aggregate strength and consistency of the trend.
• Application: A fully aligned and expanded ribbon indicates a robust trend structure ("Laminar Flow") capable of withstanding minor counter-trend noise, whereas a compressed ribbon signals consolidation or structural weakness.
Principle C:
Adaptive Confluence Protocols Signal validity is strictly governed by a multi-dimensional confluence logic. The system suppresses signal generation unless there is synchronized confirmation across all three analytical vectors:
1. Volatility: Confirmed expansion via the Impulse Core.
2. Momentum: Directional alignment via the Hybrid Oscillator.
3. Structure: Trend validation via the Baseline. This strict filtering mechanism significantly reduces false positives in non-trending (choppy) environments while maintaining sensitivity to genuine breakouts.
🔍 Chapter 2: Core Modules & Algorithmic Logic
Module A: Impulse Core (Normalized Volatility Deviation)
Operational Logic The Impulse Core functions as a volatility-normalized momentum gauge rather than a standard oscillator. It is designed to identify "Volatility Contraction" (Squeeze) and "Volatility Expansion" phases by quantifying the divergence between short-term and long-term volatility states.
Volatility Z-Score Normalization
The formula implements a custom normalization algorithm. Unlike standard oscillators that rely on absolute price changes, this logic calculates the Z-Score of the Volatility Spread.
◦ Numerator: (atr_f - atr_s) captures the raw momentum of volatility expansion.
◦ Denominator: (std_f + 1e-6) standardizes this value against historical variance.
◦ Result: This allows the indicator scales consistently across assets (e.g., Bitcoin vs. Euro) without manual recalibration.
f_impulse() =>
atr_f = ta.atr(fastLen) // Fast Volatility Baseline
atr_s = ta.atr(slowLen) // Slow Volatility Baseline
std_f = ta.stdev(atr_f, devLen) // Volatility Standard Deviation
(atr_f - atr_s) / (std_f + 1e-6) // Normalized Differential Calculation
Algorithmic Framework
• Differential Calculation: The system computes the spread between a Fast Volatility Baseline (ATR-10) and a Slow Volatility Baseline (ATR-30).
• Normalization Protocol: To standardize consistency across diverse asset classes (e.g., Forex vs. Crypto), the raw differential is divided by the standard deviation of the volatility itself over a 30-period lookback.
• Signal Generation:
◦ Contraction (Squeeze): When the Fast ATR compresses below the Slow ATR, it registers a potential volatility buildup phase.
◦ Expansion (Release): A rapid divergence of the Fast ATR above the Slow ATR signals a confirmed volatility expansion, validating the strength of the move.
Module B: Gradient Oscillator (RSI-SMA Hybrid)
Design Rationale To mitigate the "noise" and "false reversal" signals common in single-line oscillators (like standard RSI), this module utilizes a 15-Layer Gradient Ribbon to visualize momentum density and persistence.
Technical Architecture
• Ribbon Array: The system generates 15 sequential Simple Moving Averages (SMA) applied to a volatility-adjusted RSI source. The length of each layer increases incrementally.
• State Analysis:
Momentum Alignment (Laminar Flow): When all 15 layers are expanded and parallel, it indicates a robust trend where buying/selling pressure is distributed evenly across multiple timeframes. This state helps filter out premature "overbought/oversold" signals.
• Consolidation (Compression): When the distance between the fastest layer (Layer 1) and the slowest layer (Layer 15) approaches zero or the layers intersect, the system identifies a "Non-Tradable Zone," preventing entries during choppy market conditions.
// Laminar Flow Validation
f_validate_trend() =>
// Calculate spread between Ribbon layers
ribbon_spread = ta.stdev(ribbon_array, 15)
// Only allow signals if Ribbon is expanded (Laminar Flow)
is_flowing = ribbon_spread > min_expansion_threshold
// If compressed (Knotted), force signal to false
is_flowing ? signal : na
Module C: Adaptive Signal Filtering (Behavioral Bias Mitigation)
This subsystem, operating as an algorithmic "Anti-Greed" Mechanism, addresses the statistical tendency for signal degradation following prolonged trends.
Dynamic Threshold Adjustment
• Win Streak Detection: The algorithm internally tracks the outcome of closed trade cycles.
• Sensitivity Multiplier: Upon detecting consecutive successful signals in the same direction, a Penalty_Factor is applied to the entry logic.
• Operational Impact: This effectively raises the Required_Slope threshold for subsequent signals. For example, after three consecutive bullish signals, the system requires a 30% steeper trend angle to validate a fourth entry. This enforces stricter discipline during extended trends to reduce the probability of entering at the point of trend exhaustion.
Anti-Greed Logic: Dynamic Threshold Calculation
f_adjust_threshold(base_slope, win_streak) =>
// Adds a 10% penalty to the difficulty for every consecutive win
penalty_factor = 0.10
risk_scaler = 1 + (win_streak * penalty_factor)
// Returns the new, harder-to-reach threshold
base_slope * risk_scaler
Module D: Trend Baseline (Triple-Smoothed Structure)
The Trend Baseline serves as the structural filter for all signals. It employs a Triple-Smoothed Hybrid Algorithm designed to balance lag reduction with noise filtration.
Smoothing Stages
1. Volatility Banding: Utilizes a SuperTrend-based calculation to establish the upper and lower boundaries of price action.
2. Weighted Filter: Applies a Weighted Moving Average (WMA) to prioritize recent price data.
3. Exponential Smoothing: A final Exponential Moving Average (EMA) pass is applied to create a seamless baseline curve.
Functionality
This "Heavy" baseline resists minor intraday volatility spikes while remaining responsive to sustained structural shifts. A signal is only considered valid if the price action maintains structural integrity relative to this baseline
🚦 Chapter 3: Risk Management & Exit Protocols
Quantitative Risk Management (TP/SL & Trailing)
Foundational Architecture: Volatility-Adjusted Geometry Unlike strategies relying on static nominal values, Impulse Reactor establishes dynamic risk boundaries derived from quantitative volatility metrics. This design aligns trade invalidation levels mathematically with the current market regime.
• ATR-Based Dynamic Bracketing:
The protocol calculates Stop-Loss and Take-Profit levels by applying Fibonacci coefficients (Default: 0.786 for SL / 1.618 for TP) to the Average True Range (ATR).
◦ High Volatility Environments: The risk bands automatically expand to accommodate wider variance, preventing premature exits caused by standard market noise.
◦ Low Volatility Environments: The bands contract to tighten risk parameters, thereby dynamically adjusting the Risk-to-Reward (R:R) geometry.
• Close-Validation Protocol ("Soft Stop"):
Institutional algorithms frequently execute liquidity sweeps—driving prices briefly below key support levels to accumulate inventory.
◦ Mechanism: When the "Soft Stop" feature is enabled, the system filters out intraday volatility spikes. The stop-loss is conditional; execution is triggered only if the candle closes beyond the invalidation threshold.
◦ Strategic Advantage: This logic distinguishes between momentary price wicks and genuine structural breakdowns, preserving positions during transient volatility.
• Step-Function Trailing Mechanism:
To protect unrealized PnL while allowing for normal price breathing, a two-phase trailing methodology is employed:
◦ Phase 1 (Activation): The trailing function remains dormant until the price advances by a pre-defined percentage threshold.
◦ Phase 2 (Dynamic Floor): Once armed, the stop level creates a moving floor, adjusting relative to price action while maintaining a volatility-based (ATR) buffer to systematically protect unrealized PnL.
• Algorithmic Exit Protocols (Dynamic Liquidity Analysis)
◦ Rationale: Inefficiencies of Static Targets Static "Take Profit" levels often result in suboptimal exits. They compel traders to close positions based on arbitrary figures rather than evolving market structure, potentially capping upside during significant trends or retaining positions while the underlying trend structure deteriorates.
◦ Solution: Structural Integrity Assessment The system utilizes a Dynamic Liquidity Engine to continuously audit the validity of the position. Instead of targeting a specific price point, the algorithm evaluates whether the trend remains statistically robust.
Multi-Factor Exit Logic (The Tri-Vector System)
The Smart Exit protocol executes only when specific algorithmic invalidation criteria are met:
• 1. Momentum Exhaustion (Confluence Decay): The system monitors a 168-hour rolling average of the Confluence Score. A significant deviation below this historical baseline indicates momentum exhaustion, signaling that the driving force behind the trend has dissipated prior to a price reversal. This enables preemptive exits before a potential drawdown.
• 2. Statistical Over-Extension (Mean Reversion): Utilizing the core volatility logic, the system identifies instances where price deviates beyond 2.0 standard deviations from the mean. While the trend may be technically bullish, this statistical anomaly suggests a high probability of mean reversion (elastic snap-back), triggering a defensive exit to capitalize on peak valuation.
• 3. Oscillator Rejection (Immediate Pivot): To manage sudden V-shaped volatility, the system monitors RSI pivots. If a sharp "Pivot High" or divergence is detected, the protocol triggers an immediate "Peak Exit," bypassing standard trend filters to secure liquidity during high-velocity reversals.
🎨 Chapter 4: Visualization Guide
Gradient Oscillator Ribbon
The 15-layer SMA ribbon visualized via plot(r1...r15) represents the "Momentum Density" of the market.
• Visuals:
◦ Cyan/Blue Ribbon: Indicates Bullish Momentum.
◦ Pink/Magenta Ribbon: Indicates Bearish Momentum.
• Interpretation:
◦ Laminar Flow: When the ribbon expands widely and flows in parallel, it signifies a robust trend where momentum is distributed evenly across timeframes. This is the ideal state for trend-following.
◦ Compression (Consolidation): If the ribbon becomes narrow, twisted, or knotted, it indicates a "Non-Tradable Zone" where the market lacks a unified direction. Traders are advised to wait for clarity.
◦ Over-Extension: If the top layer crosses the Overbought (85) or Oversold (15) lines, it visually warns of potential market overheating.
Trend Baseline
The thick, color-changing line plotted via plot(baseline) represents the Structural Backbone of the market.
• Visuals: Changes color based on the trend direction (Blue for Bullish, Pink for Bearish).
• Interpretation:
Structural Filter: Long positions are statistically favored only when price action sustains above this baseline, while short positions are favored below it.
Dynamic Support/Resistance: The baseline acts as a dynamic support level during uptrends and resistance during downtrends.
Entry Signals & Labels
Text labels ("Long Entry", "Short Entry") appear when the system detects high-probability setups grounded in quantitative confluence.
• Visuals: Labeled signals appear above/below specific candles.
• Interpretation:
These signals represent moments where Volatility (Expansion), Momentum (Alignment), and Structure (Trend) are synchronized.
Smart Exit: Labels such as "Smart Exit" or "Peak Exit" appear when the system detects momentum exhaustion or structural decay, prompting a defensive exit to preserve capital.
Dynamic TP/SL Boxes
The semi-transparent colored zones drawn via fill() represent the risk management geometry.
• Visuals: Colored boxes extending from the entry point to the Take Profit (TP) and Stop Loss (SL) levels.
• Function:
Volatility-Adjusted Geometry: Unlike static price targets, these boxes expand during high volatility (to prevent wicks from stopping you out) and contract during low volatility (to optimize Risk-to-Reward ratios).
SAR + MACD Glow
Small glowing shapes appearing above or below candles.
• Visuals: Triangle or circle glows near the price bars.
• Interpretation:
This visual indicates a secondary confirmation where Parabolic SAR and MACD align with the main trend direction. It serves as an additional confluence factor to increase confidence in the trade setup.
Support/Resistance Table
A small table located at the bottom-right of the chart.
• Function: Automatically identifies and displays recent Pivot Highs (Resistance) and Pivot Lows (Support).
• Interpretation: These levels can be used as potential targets for Take Profit or invalidation points for manual Stop Loss adjustments.
🖥️ Chapter 5: Dashboard & Operational Guide
Integrated Analytics Panel (Dashboard Overview)
To facilitate rapid decision-making without manual calculation, the system aggregates critical market dimensions into a unified "Heads-Up Display" (HUD). This panel monitors real-time metrics across multiple timeframes and analytical vectors.
A. Intermediate Structure (12H Trend)
• Function: Anchors the intraday analysis to the broader market structure using a 12-hour rolling window.
• Interpretation:
◦ Bullish (> +0.5%): Indicates a positive structural bias. Long setups align with the macro flow.
◦ Bearish (< -0.5%): Indicates structural weakness. Short setups are statistically favored.
◦ Neutral: Represents a ranging environment where the Confluence Score becomes the primary weighting factor.
B. Composite Confluence Score (Signal Confidence)
• Definition: A probability metric derived from the synchronization of Volatility (Impulse Core), Momentum (Ribbon), and Trend (Baseline).
• Grading Scale:
Strong Buy/Sell (> 7.0 / < 3.0): Indicates full alignment across all three vectors. Represents a "Prime Setup" eligible for standard position sizing.
Buy/Sell (5.0–7.0 / 3.0–5.0): Indicates a valid trend but with moderate volatility confirmation.
Neutral: Signals conflicting data (e.g., Bullish Momentum vs. Bearish Structure). Trading is not recommended ("No-Trade Zone").
C. Statistical Deviation Status (Mean Reversion)
• Logic: Utilizes Bollinger Band deviation principles to quantify how far price has stretched from the statistical mean (20 SMA).
• Alert States:
Over-Extended (> 2.0 SD): Warning that price is statistically likely to revert to the mean (Elastic Snap-back), even if the trend remains technically valid. New entries are discouraged in this zone.
Normal: Price is within standard distribution limits, suitable for trend-following entries.
D. Volatility Regime Classification
• Metric: Compares current ATR against a 100-period historical baseline to categorize the market state.
• Regimes:
Low Volatility (Lvl < 1.0): Market Compression. Often precedes volatility expansion events.
Mid Volatility (Lvl 1.0 - 1.5): Standard operating environment.
High Volatility (Lvl > 1.5): Elevated market stress. Risk parameters should be adjusted (e.g., reduced position size) to account for increased variance.
E. Performance Telemetry
• Function: Displays the historical reliability of the Trend Baseline for the current asset and timeframe.
• Operational Threshold: If the displayed Win Rate falls below 40%, it suggests the current market behavior is incoherent (choppy) and does not respect trend logic. In such cases, switching assets or timeframes is recommended.
Operational Protocols & Signal Decoding
Visual Interpretation Standards
• Laminar Flow (Trade Confirmation): A valid trend is visually confirmed when the 15-layer SMA Ribbon is fully expanded and parallel. This indicates distributed momentum across timeframes.
• Consolidation (No-Trade): If the ribbon appears twisted, knotted, or compressed, the market lacks a unified directional vector.
• Baseline Interaction: The Triple-Smoothed Baseline acts as a dynamic support/resistance filter. Long positions remain valid only while price sustains above this structure.
System Calibration (Settings)
• Adaptive Signal Filtering (Prev. Anti-Greed): Enabled by default. This logic automatically raises the required trend slope threshold following consecutive wins to mitigate behavioral bias.
• Impulse Sensitivity: Controls the reactivity of the Volatility Core. Higher settings capture faster moves but may introduce more noise.
⚙️ Chapter 6: System Configuration & Alert Guide
This section provides a complete breakdown of every adjustable setting within Impulse Reactor to assist you in tailoring the engine to your specific needs.
🌐 LANGUAGE SETTINGS (Localization)
◦ Select Language (Default: English):
Function: Instantly translates all chart labels, dashboard texts into your preferred language.
Supported: English, Korean, Chinese, Spanish
⚡ IMPULSE CORE SETTINGS (Volatility Engine)
◦ Deviation Lookback (Default: 30): The period used to calculate the standard deviation of volatility.
Role: Sets the baseline for normalizing momentum. Higher values make the core smoother but slower to react.
◦ Fast Pulse Length (Default: 10): The short-term ATR period.
Role: Detects rapid volatility expansion.
◦ Slow Pulse Length (Default: 30): The long-term ATR baseline.
Role: Establishes the background volatility level. The core signal is derived from the divergence between Fast and Slow pulses.
🎯 TP/SL SETTINGS (Risk Management)
◦ SL/TP Fibonacci (Default: 0.786 / 1.618): Selects the Fibonacci ratio used for risk calculation.
◦ SL/TP Multiplier (Default: 1.5 / 2): Applies a multiplier to the ATR-based bands.
Role: Expands or contracts the Take Profit and Stop Loss boxes. Increase these values for higher volatility assets (like Altcoins) to avoid premature stop-outs.
◦ ATR Length (Default: 14): The lookback period for calculating the Average True Range used in risk geometry.
◦ Use Soft Stop (Close Basis):
Role: If enabled, Stop Loss alerts only trigger if a candle closes beyond the invalidation level. This prevents being stopped out by wick manipulations.
🔊 RIBBON SETTINGS (Momentum Visualization)
◦ Show SMA Ribbon: Toggles the visibility of the 15-layer gradient ribbon.
◦ Ribbon Line Count (Default: 15): The number of SMA lines in the ribbon array.
◦ Ribbon Start Length (Default: 2) & Step (Default: 1): Defines the spread of the ribbon.
Role: Controls the "thickness" of the momentum density visualization. A wider step creates a broader ribbon, useful for higher timeframes.
📎 DISPLAY OPTIONS
◦ Show Entry Lines / TP/SL Box / Position Labels / S/R Levels / Dashboard: Toggles individual visual elements on the chart to reduce clutter.
◦ Show SAR+MACD Glow: Enables the secondary confirmation shapes (triangles/circles) above/below candles.
📈 TREND BASELINE (Structural Filter)
◦ Supertrend Factor (Default: 12) & ATR Period (Default: 90): Controls the sensitivity of the underlying Supertrend algorithm used for the baseline calculation.
◦ WMA Length (40) & EMA Length (14): The smoothing periods for the Triple-Smoothed Baseline.
◦ Min Trend Duration (Default: 10): The minimum number of bars the trend must be established before a signal is considered valid.
🧠 SMART EXIT (Dynamic Liquidity)
◦ Use Smart Exit: Enables the momentum exhaustion logic.
◦ Exit Threshold Score (Default: 3): The sensitivity level for triggering a Smart Exit. Lower values trigger earlier exits.
◦ Average Period (168) & Min Hold Bars (5): Defines the rolling window for momentum decay analysis and the minimum duration a trade must be held before Smart Exit logic activates.
🛡️ TRAILING STOP (Step)
◦ Use Trailing Stop: Activates the step-function trailing mechanism.
◦ Step 1 Activation % (0.5) & Offset % (0.5): The price must move 0.5% in your favor to arm the first trail level, which sets a stop 0.5% behind price.
◦ Step 2 Activation % (1) & Offset % (0.2): Once price moves 1%, the trail tightens to 0.2%, securing the position.
🌀 SAR & MACD SETTINGS (Secondary Confirmation)
◦ SAR Start/Increment/Max: Standard Parabolic SAR parameters.
◦ SAR Score Scaling (ATR): Adjusts how much weight the SAR signal has in the overall confluence score.
◦ MACD Fast/Slow/Signal: Standard MACD parameters used for the "Glow" signals.
🔄 ANTI-GREED LOGIC (Behavioral Bias)
◦ Strict Entry after Win: Enables the negative feedback loop.
◦ Strict Multiplier (Default: 1.1): Increases the entry difficulty by 10% after each win.
Role: Prevents overtrading and entering at the top of an extended trend.
🌍 HTF FILTER (Multi-Timeframe)
◦ Use Auto-Adaptive HTF Filter: Automatically selects a higher timeframe (e.g., 1H -> 4H) to filter signals.
◦ Bypass HTF on Steep Trigger: Allows an entry even against the HTF trend if the local momentum slope is exceptionally steep (catch powerful reversals).
📉 RSI PEAK & CHOPPINESS
◦ RSI Peak Exit (Instant): Triggers an immediate exit if a sharp RSI pivot (V-shape) is detected.
◦ Choppiness Filter: Suppresses signals if the Choppiness Index is above the threshold (Default: 60), indicating a flat market.
📐 SLOPE TRIGGER LOGIC
◦ Force Entry on Steep Slope: Overrides other filters if the price angle is extremely vertical (high velocity).
◦ Slope Sensitivity (1.5): The angle required to trigger this override.
⛔ FLAT MARKET FILTER (ADX & ATR)
◦ Use ADX Filter: Blocks signals if ADX is below the threshold (Default: 20), indicating no trend.
◦ Use ATR Flat Filter: Blocks signals if volatility drops below a critical level (dead market).
🔔 Alert Configuration Guide
Impulse Reactor is designed with a comprehensive suite of alert conditions, allowing you to automate your trading or receive real-time notifications for specific market events.
How to Set Up:
Click the "Alert" (Clock) icon in the TradingView toolbar.
Select "Impulse Reactor " from the Condition dropdown.
Choose one of the specific trigger conditions below:
🚀 Entry Signals (Trend Initiation)
Long Entry:
Trigger: Fires when a confirmed Bullish Setup is detected (Momentum + Volatility + Structure align).
Usage: Use this to enter new Long positions.
Short Entry:
Trigger: Fires when a confirmed Bearish Setup is detected.
Usage: Use this to enter new Short positions.
🎯 Profit Taking (Target Levels)
Long TP:
Trigger: Fires when price hits the calculated Take Profit level for a Long trade.
Usage: Automate partial or full profit taking.
Short TP:
Trigger: Fires when price hits the calculated Take Profit level for a Short trade.
Usage: Automate partial or full profit taking.
🛡️ Defensive Exits (Risk Management)
Smart Exit:
Trigger: Fires when the system detects momentum decay or statistical exhaustion (even if the trend hasn't fully reversed).
Usage: Recommended for tightening stops or closing positions early to preserve gains.
Overbought / Oversold:
Trigger: Fires when the ribbon extends into extreme zones.
Usage: Warning signal to prepare for a potential reversal or pullback.
💡 Secondary Confirmation (Confluence)
SAR+MACD Bullish:
Trigger: Fires when Parabolic SAR and MACD align bullishly with the main trend.
Usage: Ideal for Pyramiding (adding to an existing winning position).
SAR+MACD Bearish:
Trigger: Fires when Parabolic SAR and MACD align bearishly.
Usage: Ideal for adding to short positions.
⚠️ Chapter 7: Conclusion & Risk Disclosure
Methodological Synthesis
Impulse Reactor represents a shift from reactive price tracking to proactive energy analysis. By decomposing market activity into its atomic components — Volatility, Momentum, and Structure — and reconstructing them into a coherent decision model, the system aims to provide a quantitative framework for market engagement. It is designed not to predict the future, but to identify high-probability conditions where kinetic energy and trend structure align.
Disclaimer & Risk Warnings
◦ Educational Purpose Only
This indicator, including all associated code, documentation, and visual outputs, is provided strictly for educational and informational purposes. It does not constitute financial advice, investment recommendations, or a solicitation to buy or sell any financial instruments.
◦ No Guarantee of Performance
Past performance is not indicative of future results. All metrics displayed on the dashboard (including "Win Rate" and "P&L") are theoretical calculations based on historical data. These figures do not account for real-world trading factors such as slippage, liquidity gaps, spread costs, or broker commissions.
◦ High-Risk Warning
Trading cryptocurrencies, futures, and leveraged financial products involves a substantial risk of loss. The use of leverage can amplify both gains and losses. Users acknowledge that they are solely responsible for their trading decisions and should conduct independent due diligence before executing any trades.
◦ Software Limitations
The software is provided "as is" without warranty. Users should be aware that market data feeds on analysis platforms may experience latency or outages, which can affect signal generation accuracy.

R2 Strategy — Binary Option📌 R2 Strategy — Multi-Context Price Reaction Tool With Visual Statistics
R2 Strategy is a price–reaction analytical tool designed to study how the market responds to short-term RSI deviations while being filtered by directional context using EMA. It provides visual statistical tables, simplified backtesting, and configurable filters to help traders better understand when market conditions historically aligned with the strategy’s criteria.
🔎 Core Concept
The indicator combines:
Short-period RSI values to detect potential exhaustion zones.
EMA filtering to distinguish trend direction and context.
Time-based behavior studies to analyze when signals historically perform better.
A signal is generated when the RSI exceeds the defined levels and price is reacting relative to the chosen EMA filter. The strategy does not execute trades; it highlights conditions that match its predefined criteria so traders can study and interpret the symptoms of potential reversals or continuations.
📊 Statistical & Backtest Visual Features
The tool includes visual tables and summaries that assist strategic research:
Feature Purpose
Winrate by hour Study intraday behavioral patterns
Winrate by weekday Identify habitual cycle tendencies
Multi-timeframe trend table Contextual confirmation
Compact layout mode Minimalist display
Custom period selection Study behavior in different market cycles
These statistical elements serve as visual study aids only and do not represent predictive or guaranteed outcomes.
⚙ User Configurable Parameters
Users may adjust:
RSI thresholds and period
EMA period and trend sensitivity
Display mode (tables, labels, compact)
Date-based backtest window
Day and hour filters
Cooldown settings to reduce repeated signals
This flexibility allows the user to experiment with different interpretations of market rhythm.
💡 Originality
This script integrates RSI reaction analysis, EMA trend contextualization, and multi-level visual statistics into a single tool designed for study-oriented decision support. The emphasis is not only on the signal but on interpreting how the signal behaved under specific market circumstances.
⚠ Limitations & Disclaimer
This script does not predict markets, guarantee accuracy, or eliminate risk.
Statistical results are historical observations, not forward projections.
It does not provide financial advice or automated execution.
Intended for analysis, research, and educational purposes only.

Premarket LevelsThis indicator tracks premarket high and low levels for day trading, providing statistical analysis on how often these levels get touched during regular trading hours (9:30 AM-4:00 PM EST). It combines real-time level tracking with historical probability analysis and precise timing statistics to help traders make data-driven decisions. I use 4:00 - 9:30 AM on SPY/QQQ etc and 18:00 - 9:30 on Futures ES/NQ etc
Core Features
1. Premarket Level Tracking
Automatically identifies and plots premarket high and low levels
Displays levels with customizable colors and line styles
Shows optional midpoint and percentage/fibonacci retracement levels
Tracks when levels are set during premarket session
2. Historical Touch Analysis
Calculates probability of PM high/low being touched during regular hours
Tracks "Both Levels" touched rate (how often both get hit same day)
Tracks "Either Level" touched rate (how often at least one gets hit)
Adjustable lookback period (1-250 days) for statistical analysis
3. Timing Intelligence
Average time when levels get touched
Earliest and latest touch times in historical data
Four customizable time buckets showing touch distribution throughout the day
First touch time displayed for current session
4. Range Analysis
Current PM range vs historical average (adjustable period)
Range percentile ranking (where today ranks in historical distribution)
Min/Max historical ranges for context
Large/small range detection with customizable thresholds
Background highlighting for unusual range days
5. Smart Signals & Alerts
Buy/Sell signals on level breakouts (adjustable sensitivity)
Level rejection detection (failed breakout patterns)
Proximity alerts when approaching levels
Touch markers (diamond shapes) when levels are tested
Multiple alert conditions for various scenarios
6. Risk Management Tools
Automatic stop loss suggestions (ATR-based, percentage-based, or fixed points)
Target projections based on range extension
Position tracking relative to PM range
Distance calculations to both levels
How To Use
For Day Traders:
Check the "Either Level" percentage - if 90%+, at least one level will likely be touched
Review time bucket statistics - most touches happen 9:30-10:00 AM
Monitor "Both Levels" rate - typically only 20-30%, meaning round trips are rare
Use range percentile to gauge if expansion or mean reversion is likely
For Scalpers:
Enable touch markers to see exact level tests
Use proximity alerts to prepare for potential bounces
Monitor first touch times - early touches often lead to continuations
Check rejection signals for quick reversal trades
For Swing Position Sizing:
Use historical touch rates to assess probability of level tests
Review range size vs average for stop placement guidance
Check timing analysis to avoid holding through low-probability windows
Use target projections for realistic profit targets
Settings Overview
Basic Settings:
Premarket session time (default 4:00-7:30 AM EST)
Signal sensitivity for breakout detection
Timezone selection for accurate time labels
Historical Analysis:
Lookback period for statistics (default 20 days, max 250)
Toggle touch tracking and markers
Enable/disable daily statistics display
Range Analysis:
Adjustable average period (default 20 days)
Large/small range threshold customization
Range percentile display toggle
Timing Analysis:
Three customizable time buckets (default: 10:00, 11:00, 12:00)
Fourth bucket automatically covers afternoon (12:00-4:00 PM)
Toggle time bucket statistics display
Visual Features:
Midpoint line display
Percentage (25%, 75%) or Fibonacci (23.6%, 38.2%, 61.8%, 78.6%) levels
Table position and size customization
Comprehensive color scheme customization (background, text, headers)
Smart Alerts:
Proximity alerts with adjustable threshold
Level rejection detection
Failed breakout detector
Time-of-day filter to avoid lunch chop
Risk Management:
Stop loss method selection (ATR, PM Range %, Fixed Points)
Adjustable ATR multiplier
Target projection display
Statistics Explained
Touch Rates:
Percentage of days where level was touched during RTH
Based only on FIRST touch per day (not multiple re-tests)
Binary metric: Yes/No for each day
Timing Stats:
All based on timestamp of FIRST touch each day
Average, Earliest, Latest provide distribution context
Time buckets show concentration of first touches
Range Metrics:
Current range compared to historical average
Percentile shows where today ranks (0-100%)
Min/Max provide extreme boundaries from history
Important Notes
First Touch Only: All statistics track only the first time a level is touched each day, not subsequent re-tests
RTH Focus: Touch tracking occurs only during regular trading hours (9:30 AM-4:00 PM EST)
Data Accumulation: Historical statistics build over time as indicator runs; requires specified lookback period to populate
Chart Timeframe: Works on any timeframe but recommended 3-5 minute charts for best premarket level precision
Memory Reset: Each new premarket session resets tracking for fresh daily analysis
Best Practices
Use 60-100 day lookback for statistical significance
Combine high touch rates (80%+) with time bucket data for highest probability setups
Small ranges (< 50% of average) often lead to expansion moves
Large ranges (> 150% of average) often consolidate or mean-revert
First 30 minutes typically contains 50%+ of all level touches
After 12:00 PM, probability of untouched levels being hit drops significantly
Performance Considerations
Optimized for real-time calculation with minimal lag
Uses efficient array management for historical data
Table updates only on bar close for performance
Maximum lookback of 250 days to prevent memory issues
This indicator is for educational and informational purposes only. It is NOT financial advice.
The buy/sell signals are algorithmic suggestions based on historical patterns and should NOT be followed blindly
Past performance and historical statistics do NOT guarantee future results
All trading involves substantial risk of loss
You are solely responsible for your own trading decisions
Always perform your own analysis and risk assessment before entering any trade
The creator of this indicator is not responsible for any trading losses incurred from its use
No representation is being made that any account will or is likely to achieve profits or losses similar to those discussed in the indicator statistics
By using this indicator, you acknowledge that you understand these risks and accept full responsibility for your trading decisions.

Dark VectorThe Dark Vector is a professional-grade trend-following system designed to solve the two most common causes of trading losses: over-trading during chop and exiting trends too early.
Unlike standard indicators that continuously recalculate based on every price tick, this system operates on a strict "State Machine" logic. This means it tracks the current market phase and refuses to issue conflicting signals. If the system is Long, it mathematically cannot issue another Long signal until the previous trend has concluded.
The system relies on three core engines:
1. The Trend Architecture (Modified SuperTrend) The backbone of the system is an ATR-based trailing stop mechanism. It creates a dynamic trend line that adjusts to volatility. When volatility expands, the line widens to prevent premature stop-outs during market noise. When volatility contracts, the line tightens to protect profits.
2. The Noise Gate (Choppiness Index) This is the system's safety filter. It measures the fractal efficiency of the market—essentially determining if price is moving in a clear direction or moving sideways. When the market enters a consolidation phase (sideways chop), the Noise Gate activates, turning the candles gray and physically blocking all new entry signals. This prevents the user from entering trades in low-probability environments.
3. The Singularity State Machine This internal logic enforces trading discipline. It treats the trend as a binary state (Bullish or Bearish). It forces an alternating signal pattern, ensuring that you are only alerted to the specific moment a major trend reversal occurs, rather than being bombarded with repetitive signals during a long run.
Best Way to Use This System
To maximize profitability and minimize false positives, it is recommended to use the "Regime & Alignment" methodology outlined below.
1. The Traffic Light Rule
Before placing any trade, observe the color of the candlesticks on the chart:
Green Candles: The market is in a confirmed Bullish Impulse. You should only look for Long entries or hold existing positions. Shorting is statistically dangerous here.
Red Candles: The market is in a confirmed Bearish Impulse. You should only look for Short entries or hold cash. Buying the dip here is high-risk.
Gray Candles: The market is in a Chop/Squeeze regime. The Noise Gate is active. Do not open new positions. This indicates indecision, and the market is likely to destroy option premiums or stop out tight leverage. Wait for the candles to return to Green or Red before acting.
2. The Entry Trigger
Enter a trade only when a text label (LONG or SHORT) appears.
Long Signal: Occurs when price closes above the Trend Line AND the market is not in a Chop zone.
Short Signal: Occurs when price closes below the Trend Line AND the market is not in a Chop zone.
3. The Exit Strategy
There are two ways to manage the trade once active:
The Trend Follower (Conservative): Hold the position until the Trend Line flips color. This captures the maximum duration of the move but may give back some profit at the very end.
The Stop Loss (Active): The Trend Line (the white value in your dashboard) acts as your Trailing Stop. If a candle closes beyond this line, the trend is technically invalidated. You should exit immediately.
4. Multi-Timeframe Alignment (The Golden Rule)
The highest win rates are achieved when your trading timeframe aligns with the higher-order trend.
Step 1: Check the 4-Hour chart. Is the Trend Line Green?
Step 2: Switch to the 15-Minute chart.
Step 3: Only take the LONG signals on the 15-Minute chart. Ignore all Short signals.
Reasoning: Counter-trend trades often fail. By trading only in the direction of the higher timeframe, you are swimming with the current, not against it.
Recommended Settings by Style
Swing Trading (Daily/4H): Keep the Trend Factor at 4.0. This ignores daily noise and keeps you in the trade for weeks or months.
Day Trading (1H/15m): Lower the Trend Factor to 3.0. This makes the system more reactive to intraday reversals.
Scalping (5m): Lower the Trend Factor to 2.0 and the ATR Length to 7. This is aggressive and requires strict adherence to the Stop Loss.
Disclaimer
This indicator is for educational and informational purposes only. It does not constitute financial advice, investment advice, or a recommendation to buy or sell any asset. Trading cryptocurrencies, stocks, and futures involves a high degree of risk and the potential for significant financial loss. The user assumes all responsibility for their trading decisions. Past performance of any system or indicator is not indicative of future results. Always practice risk management and never trade with money you cannot afford to lose.

RSI adaptive zones [AdaptiveRSI]This script introduces a unified mathematical framework that auto-scales oversold/overbought and support/resistance zones for any period length. It also adds true RSI candles for spotting intrabar signals.
Built on the Logit RSI foundation, this indicator converts RSI into a statistically normalized space, allowing all RSI lengths to share the same mathematical footing.
What was once based on experience and observation is now grounded in math.
✦ ✦ ✦ ✦ ✦
💡 Example Use Cases
RSI(14): Classic overbought/oversold signals + divergence
Support in an uptrend using RSI(14)
Range breakouts using RSI(21)
Short-term pullbacks using RSI(5)
✦ ✦ ✦ ✦ ✦
THE PAST: RSI Interpretation Required Multiple Rulebooks
Over decades, RSI practitioners discovered that RSI behaves differently depending on trend and lookback length:
• In uptrends, RSI tends to hold higher support zones (40–50)
• In downtrends, RSI tends to resist below 50–60
• Short RSIs (e.g., RSI(2)) require far more extreme threshold values
• Longer RSIs cluster near the center and rarely reach 70/30
These observations were correct — but lacked a unifying mathematical explanation.
✦ ✦ ✦ ✦ ✦
THE PRESENT: One Framework Handles RSI(2) to RSI(200)
Instead of using fixed thresholds (70/30, 90/10, etc.), this indicator maps RSI into a normalized statistical space using:
• The Logit transformation to remove 0–100 scale distortion
• A universal scaling based on 2/√(n−1) scaling factor to equalize distribution shapes
As a result, RSI values become directly comparable across all lookback periods.
✦ ✦ ✦ ✦ ✦
💡 How the Adaptive Zones Are Calculated
The adaptive framework defines RSI zones as statistical regimes derived from the Logit-transformed RSI .
Each boundary corresponds to a standard deviation (σ) threshold, scaled by 2/√(n−1), making RSI distributions comparable across periods.
This structure was inspired by Nassim Nicholas Taleb’s body–shoulders–tails regime model:
Body (±0.66σ) — consolidation / equilibrium
Shoulders (±1σ to ±2.14σ) — trending region
Tails (outside of ±2.14σ) — rare, high-volatility behavior
Transitions between these regimes are defined by the derivatives of the position (CDF) function :
• ±1σ → shift from consolidation to trend
• ±√3σ → shift from trend to exhaustion
Adaptive Zone Summary
Consolidation: −0.66σ to +0.66σ
Support/Resistance: ±0.66σ to ±1σ
Uptrend/Downtrend: ±1σ to ±√3σ
Overbought/Oversold: ±√3σ to ±2.14σ
Tails: outside of ±2.14σ
✦ ✦ ✦ ✦ ✦
📌 Inverse Transformation: From σ-Space Back to RSI
A final step is required to return these statistically normalized boundaries back into the familiar 0–100 RSI scale. Because the Logit transform maps RSI into an unbounded real-number domain, the inverse operation uses the hyperbolic tangent function to compress σ-space back into the bounded RSI range.
RSI(n) = 50 + 50 · tanh(z / √(n − 1))
The result is a smooth, mathematically consistent conversion where the same statistical thresholds maintain identical meaning across all RSI lengths, while still expressing themselves as intuitive RSI values traders already understand.
✦ ✦ ✦ ✦ ✦
Key Features
Mathematically derived adaptive zones for any RSI period
Support/resistance zone identification for trend-aligned reversals
Optional OHLC RSI bars/candles for intrabar zone interactions
Fully customizable zone visibility and colors
Statistically consistent interpretation across all markets and timeframes
Inputs
RSI Length — core parameter controlling zone scaling
RSI Display : Line / Bar / Candle visualization modes
✦ ✦ ✦ ✦ ✦
💡 How to Use
This indicator is a framework , not a binary signal generator.
Start by defining the question you want answered, e.g.:
• Where is the breakout?
• Is price overextended or still trending?
• Is the correction ending, or is trend reversing?
Then:
Choose the RSI length that matches your timeframe
Observe which adaptive zone price is interacting with
Interpret market behavior accordingly
Example: Long-Term Trend Assesment using RSI(200)
A trader may ask: "Is this a long term top?"
Unlikely, because RSI(200) holds above Resistance zone , therefore the trend remains strong.
✦ ✦ ✦ ✦ ✦
👉 Practical tip:
If you used to overlay weekly RSI(14) on a daily chart (getting a line that waits 5 sessions to recalculate), you can now read the same long-horizon state continuously : set RSI(70) on the daily chart (~14 weeks × 5 days/week = 70 days) and let the adaptive zones update every bar .
Note: It won’t be numerically identical to the weekly RSI due to lookback period used, but it tracks the same regime on a standardized scale with bar-by-bar updates.
✦ ✦ ✦ ✦ ✦
Note: This framework describes statistical structure, not prediction. Use as part of a complete trading approach. Past behavior does not guarantee future outcomes.
framework ≠ guaranteed signal
---
Attribution & License
This indicator incorporates:
• Logit transformation of RSI
• Variance scaling using 2/√(n−1)
• Zone placement derived from Taleb’s body–shoulders–tails regime model and CDF derivatives
• Inverse TANH(z) transform for mapping z-scores back into bounded RSI space
Released under CC BY-NC-SA 4.0 — free for non-commercial use with credit.
© AdaptiveRSI

QX Expert Imtiazz 3.0.4 ProMade For Binary 1 Munite
This indicator combines QQA, EMA trend filters, volume strength, and liquidity zone detection to create a powerful trading system. It analyzes market momentum using QQA, confirms trend direction with EMA, and identifies key liquidity areas where price often reacts.
The indicator provides Buy and Sell signals based on trend, volume pressure, and liquidity behavior.

Hybrid Flow Master📊 Hybrid Flow Master - Professional Trading Indicator
Overview
Hybrid Flow Master is an advanced all-in-one trading indicator that combines Smart Money Concepts, institutional order flow analysis, and multi-timeframe confluence scoring to identify high-probability trade setups. Designed for both scalpers and swing traders across all markets (Forex, Crypto, Stocks, Indices).
🎯 Key Features
1. Intelligent Confluence System (0-100% Scoring) Proprietary scoring algorithm that weighs multiple factors Only signals when minimum confidence threshold is met
Real-time probability calculations for each setup Signal quality grading: A+, A, B, C ratings
2. Smart Money Concepts (SMC)
Automatic Order Block detection (bullish/bearish) Fair Value Gap (FVG) identification
Market structure analysis (Higher Highs, Lower Lows) Swing high/low tracking with visual markers
3. Multi-Timeframe Analysis
Higher timeframe trend filter for confluence Customizable HTF periods (1H, 4H, Daily, etc.)
Prevents counter-trend trades Aligns entries with major trends
4. Volume Flow Analysis
Volume spike detection with customizable thresholds Volume delta calculations (buying vs selling pressure) Institutional footprint identification Background highlighting for high-volume bars
5. Advanced Risk Management
ATR-based stop loss calculation Automatic take profit levels Customizable risk/reward ratios (1:1, 1:2, 1:3+) Visual SL/TP lines on chart Position sizing guidance
6. Professional Dashboard
Real-time HUD displaying:
Market bias (Bullish/Bearish/Neutral)
Higher timeframe trend status
Current confluence percentage
Volume status (Normal/High)
RSI reading with color coding
ATR volatility measure
Signal quality grade
7. Smart Alert System
Bullish confluence signals
Bearish confluence signals
Volume spike notifications
Customizable alert messages
Works with mobile app notifications
📈 What Makes It Unique?
✅ No Repainting - All signals are confirmed and final
✅ Probability-Based - Shows confidence level, not just binary signals
✅ Multi-Factor Confluence - Combines structure, volume, momentum, and HTF analysis
✅ Clean Interface - Toggle individual components on/off
✅ Works on All Timeframes - From 1-minute scalping to daily swing trading
✅ Universal Markets - Forex, Crypto, Stocks, Indices, Commodities
🎨 Customization Options
Adjustable swing detection length
Volume threshold settings
Minimum confluence score filter
Custom color schemes
Dashboard position (4 corners)
Show/hide individual components
Risk/reward ratio adjustment
ATR multiplier for stops
📊 Best Used For:
✔️ Scalping (1m - 15m charts)
✔️ Day Trading (15m - 1H charts)
✔️ Swing Trading (4H - Daily charts)
✔️ Trend Following
✔️ Reversal Trading
✔️ Breakout Trading
💡 How to Use:
Add indicator to chart - Works immediately with default settings Set your timeframe - Choose your trading style Wait for signals - Green BUY or Red SELL labels with confidence %
Check confluence score - Higher % = better quality setup Review dashboard - Confirm market bias and HTF trend Manage risk - Use provided SL/TP levels or adjust to your preference
Set alerts - Get notified of high-probability setups
⚙️ Recommended Settings:
For Scalping (1m-5m):
Swing Length: 5-7
Min Confluence: 70%
HTF: 15m or 1H
For Day Trading (15m-1H):
Swing Length: 10-15
Min Confluence: 60%
HTF: 4H or Daily
For Swing Trading (4H-Daily):
Swing Length: 15-20
Min Confluence: 50-60%
HTF: Weekly
📚 Indicator Components:
✦ Market Structure Detection
✦ Order Block Identification
✦ Fair Value Gaps (FVG)
✦ Volume Analysis
✦ RSI (14)
✦ MACD (12, 26, 9)
✦ ATR (14)
✦ Multi-Timeframe Trend
✦ Confluence Scoring Algorithm
🚀 Performance Notes:
Optimized for speed and efficiency Minimal CPU usage Clean chart presentation
Limited drawing objects (no chart clutter) Works on all TradingView plans
⚠️ Important Notes:
This indicator is a tool to assist trading decisions, not financial advice Always use proper risk management (1-2% per trade recommended) Backtest on your preferred market and timeframe
Combine with your own analysis and strategy Past performance does not guarantee future results
🔔 Alert Setup:
Right-click indicator name → "Add Alert" → Choose:
"Bullish Confluence Signal" for buy setups
"Bearish Confluence Signal" for sell setups
"Volume Spike Alert" for unusual activity
💬 Support:
For questions, suggestions, or custom modifications, feel free to message me directly through TradingView.

Regime [CHE] Regime — Minimal HTF MACD histogram regime marker with a simple rising versus falling state.
Summary
Regime is a lightweight overlay that turns a higher-timeframe-style MACD histogram condition into a simple regime marker on your chart. It queries an imported core module to determine whether the histogram is rising and then paints a consistent marker color based on that boolean state. The output is intentionally minimal: no lines, no panels, no extra smoothing visuals, just a repeated marker that reflects the current regime. This makes it useful as a quick context filter for other signals rather than a standalone system.
Motivation: Why this design?
A common problem in discretionary and systematic workflows is clutter and over-interpretation. Many regime tools draw multiple plots, which can distract from price structure. This script reduces the regime idea to one stable question: is the MACD histogram rising under a given preset and smoothing length. The core logic is delegated to a shared module to keep the indicator thin and consistent across scripts that rely on the same definition.
What’s different vs. standard approaches?
Reference baseline: A standard MACD histogram plotted in a separate pane with manual interpretation.
Architecture differences:
Uses a shared library call for the regime decision, rather than re-implementing MACD logic locally.
Uses a single boolean output to drive marker color, rather than plotting histogram bars.
Uses fixed marker placement at the bottom of the chart for consistent visibility.
Practical effect:
You get a persistent “context layer” on price without dedicating a separate pane or reading histogram amplitude. The chart shows state, not magnitude.
How it works (technical)
1. The script imports `chervolino/CoreMACDHTF/2` and calls `core.is_hist_rising()` on each bar.
2. Inputs provide the source series, a preset string for MACD-style parameters, and a smoothing length used by the library function.
3. The library returns a boolean `rising` that represents whether the histogram is rising according to the library’s internal definition.
4. The script maps that boolean to a color: yellow when rising, blue otherwise.
5. A circle marker is plotted on every bar at the bottom of the chart, colored by the current regime state. Only the most recent five hundred bars are displayed to limit visual load.
Notes:
The exact internal calculation details of `core.is_hist_rising()` are not shown in this code. Any higher timeframe mechanics, security usage, or confirmation behavior are determined by the imported library. (Unknown)
Parameter Guide
Source — Selects the price series used by the library call — Default: close — Tips: Use close for consistency; alternate sources may shift regime changes.
Preset — Chooses parameter preset for the library’s MACD-style configuration — Default: 3,10,16 — Trade-offs: Faster presets tend to flip more often; slower presets tend to react later.
Smoothing Length — Controls smoothing used inside the library regime decision — Default: 21 — Bounds: minimum one — Trade-offs: Higher values typically reduce noise but can delay transitions. (Library behavior: Unknown)
Reading & Interpretation
Yellow markers indicate the library considers the histogram to be rising at that bar.
Blue markers indicate the library considers it not rising, which may include falling or flat conditions depending on the library definition. (Unknown)
Because markers repeat on every bar, focus on transitions from one color to the other as regime changes.
This tool is best read as context: it does not express strength, only direction of change as defined by the library.
Practical Workflows & Combinations
Trend following:
Use yellow as a condition to allow long-side entries and blue as a condition to allow short-side entries, then trigger entries with your primary setup such as structure breaks or pullback patterns. (Optional)
Exits and stops:
Consider tightening management after a color transition against your position direction, but do not treat a single flip as an exit signal without price-based confirmation. (Optional)
Multi-asset and multi-timeframe:
Keep `Source` consistent across assets.
Use the slower preset when instruments are noisy, and the faster preset when you need earlier context shifts. The best transferability depends on the imported library’s behavior. (Unknown)
Behavior, Constraints & Performance
Repaint and confirmation:
This script itself uses no forward-looking indexing and no explicit closed-bar gating. It evaluates on every bar update.
Any repaint or confirmation behavior may come from the imported library. If the library uses higher timeframe data, intrabar updates can change the state until the higher timeframe bar closes. (Unknown)
security and HTF:
Not visible here. The library name suggests HTF behavior, but the implementation is not shown. Treat this as potentially higher-timeframe-driven unless you confirm the library source. (Unknown)
Resources:
No loops, no arrays, no heavy objects. The plotting is one marker series with a five hundred bar display window.
Known limits:
This indicator does not convey histogram magnitude, divergence, or volatility context.
A binary regime can flip in choppy phases depending on preset and smoothing.
Sensible Defaults & Quick Tuning
Starting point:
Source: close
Preset: 3,10,16
Smoothing Length: 21
Tuning recipes:
Too many flips: choose the slower preset and increase smoothing length.
Too sluggish: choose the faster preset and reduce smoothing length.
Regime changes feel misaligned with your entries: keep the preset, switch the source back to close, and tune smoothing length in small steps.
What this indicator is—and isn’t
This is a minimal regime visualization and a context filter. It is not a complete trading system, not a risk model, and not a prediction engine. Use it together with price structure, execution rules, and position management. The regime definition depends on the imported library, so validate it against your market and timeframe before relying on it.
Disclaimer
The content provided, including all code and materials, is strictly for educational and informational purposes only. It is not intended as, and should not be interpreted as, financial advice, a recommendation to buy or sell any financial instrument, or an offer of any financial product or service. All strategies, tools, and examples discussed are provided for illustrative purposes to demonstrate coding techniques and the functionality of Pine Script within a trading context.
Any results from strategies or tools provided are hypothetical, and past performance is not indicative of future results. Trading and investing involve high risk, including the potential loss of principal, and may not be suitable for all individuals. Before making any trading decisions, please consult with a qualified financial professional to understand the risks involved.
By using this script, you acknowledge and agree that any trading decisions are made solely at your discretion and risk.
Do not use this indicator on Heikin-Ashi, Renko, Kagi, Point-and-Figure, or Range charts, as these chart types can produce unrealistic results for signal markers and alerts.
Best regards and happy trading
Chervolino
MACD HTF Hardcoded

RT-Main IndicatorThe RT-Main Indicator is the core indicator that started it all. Developed over more than 5 years, this all in one tool helps traders identify when market participants are buying and selling using multi-colored candles that update in real time. It also identifies key support and resistance levels with Rainbow Pivots and highlights unusual price movements with Whale Print arrows. At its core, the RT-Main Indicator tracks buying and selling with eight colors instead of two, because real world markets are complex and order flow should not be treated as purely binary(Red vs Green).
Introduction
The RT-Main Indicator is designed as a primary Rainbow Theory Tool. It uses color coded candles to show changes in strength, Rainbow Pivots to mark important support and resistance areas, and Whale Prints to flag abnormal buy and sell activity. The goal is to bring these components together into a single framework so traders can read trend, structure, and larger player behavior without stacking many separate indicators.
This tutorial will cover each aspect of the tool:
Colored Candles
Whales are stealth experts and their strength is their ability to not be detected as they move the market. Rainbow Theory illuminates them from the shadows with a spectrum of specifically coded colors to display their unique strengths/weaknesses. In practice, this means the RT-Main Indicator uses internal strength and exhaustion metrics to color candles so that shifts in buying and selling pressure are easier to see.
The base of the RT-Main Indicator is the colored candles it paints onto the chart. These colors automatically tune to the chart based on the timeframe the trader is currently using (1D, H12, H1, 15M, etc). Instead of painting charts with a single Bullish Color (Green) and a single Bearish Color (Red), Rainbow Theory breaks out and identifies these moves into four Bearish Colors (Red|Orange|Yellow|White) and four Bullish Colors (Green|Blue|Purple|Pink). Each color tells a different story of the trend and helps traders better understand the nature of the current trend.
Bullish Colors
#4 - Green Candles - Weakest bullish color, these trends can sustain for extended periods of time.
#3 - Blue Candles - Strong bullish color, a move is starting to develop and can sustain.
#2 - Purple Candles - Second strongest bullish color, Whales are committed to the move but cannot sustain this level of momentum for long durations and a top is near.
#1 - Pink Candles - Strongest bullish color, Whales are using every single ounce of energy they have to push price up, the trend cannot be sustained and its time to take profits.
Bearish Colors
#4 - Red Candles - Weakest bearish color, these trends can sustain for extended periods of time.
#3 - Orange Candles - Strong bearish color, a move is starting to develop and can sustain.
#2 - Yellow Candles - Second strongest bearish color, Whales are committed to the move but cannot sustain this level of momentum for long durations and a bottom is near.
#1 - White Candles - Strongest bearish color, Whales are using every single ounce of energy they have to push price down into all out capitulation, the trend cannot be sustained and its time to look for entries.
How To Enable Colored Candles
By default, the Indicator’s Candles are placed behind the default candles. To properly display them, you must bring them forward. To do this, click the settings icon on the indicator, click visual order and then click bring to front:
Example - Bringing all the colors together into a Bearish Trend that reverses into a Bullish Trend:
The color thresholds can be tuned using the following options:
Automatic Tuning On/Off - Enables or disables the automatic color tuning that adjusts for each timeframe.
Auto Tuning Gain (Inc/Dec) - Increases or decreases how aggressive the automatic tuning algorithm adjusts color tuning.
Manual Fine Tuning - Linear Color Shift - Manually controls the linear sensitivity for color candle thresholds. This can be visualized as a setting being adjusted up or down in a straight, linear fashion. Linear Color Shift
Manual Fine Tuning - Exponential Color Shift - Manually controls the exponential sensitivity for color candle thresholds. This can be visualized as a setting being adjusted in an exponential manner where each level moves in an exponential shift instead of all moving equally. Exponential Color Shift Dark Mode
Some traders prefer light colored backgrounds for their charting, which can make white candles difficult to see. The RT-Main Indicator includes a Dark Mode toggle so colors stay readable on both dark and light charts.
Dark Mode Candles On/Off - Forces the indicator to use the second color set stored in the Style tab in the RT-Main Indicator settings when using light backgrounds. The White/Black Candle can also have a custom color applied if the trader is not content with these two default options.
Custom Candle Colors
In addition to toggling between light and dark modes, each individual color used by the RT-Main Indicator can be edited in the Style tab. This allows traders to keep the same logic while adjusting the visual palette to match their own chart layout.
Rainbow Rotations
Rainbow Rotations are a feature traders use to catch reversals or reversions when a trend fully blows out. The algorithm triggers on the first weaker candle that closes after a Pink or White candle prints. The general idea of this event is to show peaks and valleys of an asset.
In a strong bearish move, White candles mark extreme selling. If a weaker Yellow candle appears after a White candle, that first weaker candle is where the rotation event triggers and a Rainbow Rotation marker is placed on the chart. In a strong bullish move, Pink candles mark extreme buying. The first weaker bullish candle after a Pink candle triggers the opposite side rotation marker.
Note that Rainbow Rotations can only be visible for a finite amount of candles. The Replay function in TradingView can be used to review previous triggers.
Rainbow Rotation settings are available near the top of the settings menu:
Rainbow Rotation Alerts On/Off - Toggles these signals on or off with one click.
Rainbow Rotation Symbol - Customizes the symbol that is plotted on the chart for Rainbow Rotations. Both text and emojis can be used instead of the default symbol.
Rainbow Rotation Alerts
Rainbow Rotations can also be automated with standard TradingView alerts. To set this up:
Click the Alert icon on the right side of the screen.
Change Condition to the RT-Main Indicator.
Change the second condition to one of the three options:
Bullish Alerts | Bearish Alerts | Bearish and Bullish Alerts
Set Trigger to Once Per Bar Close.
Once set up, this allows traders to be notified when the RT-Main Indicator detects an extreme bullish or bearish trend that is starting to reverse.
Automated Pivots
One of the RT-Main Indicator's most powerful functions is the automated support and resistance pivots. This logic uses two internal bots that are tuned to look for potential support and resistance order blocks.
The Resistance Pivot Bot prints lines that are painted with red dashes.
The Support Pivot Bot prints lines that are painted with green dashes.
Regardless of the color of the dashed pivot line, any trend that approaches a pivot should be respected. For example, a trend moving up towards a green support pivot should still treat that area as resistance if price is approaching from below.
As the algorithm continues to print additional pivots on the chart, traders can start identifying order blocks that are otherwise hidden in the price action. These order blocks are key support and resistance areas that trends will often interact with and respect. Multiple stacked pivots in the same region are a visual clue that such an order block has formed.
Pivots can be tuned with the following options:
Pivot On/Off - Quickly toggles all pivots on or off.
Pivot Style - Switches between different styles of marking pivots.
Pivot Sensitivity (Inc/Dec) - Tunes the sensitivity of the pivot algorithms. Adjusting this changes how many pivots are printed on the chart.
Pivot Line Drawing Length - Controls how long the indicator draws the pivot lines.
Resistance / Support Pivot Colors - Allows customization of pivot colors to match the rest of the chart.
Whale Prints
One of the most important parts of the RT-Main Indicator is tracking Whale Prints. This portion of the script looks for abnormal buys and sells that are more consistent with large players than typical flow. Under normal circumstances, whales try to avoid being visible when they buy or sell, but there are times where they are forced to come out of hiding and deliberately move the market.
The Whale Print logic is tuned to notify the trader when it detects that this type of unusual activity may be occurring.
Bearish Whale Prints are marked on the chart with a red triangle.
Bullish Whale Prints are marked on the chart with a green triangle.
Whale Print clusters are situations where multiple Whale Prints have been identified in the past 10 candles. While individual Whale Prints are useful, clusters of Whale Prints are particularly important because they often signal that a very large move is potentially being prepared/defended.
The Whale Print table is an active tracker that counts the number of bullish and bearish Whale Prints that have occurred in the past 10 candles. Whale Print settings can be tuned with:
Whale Print Clusters Table On/Off - Toggles the Whale Print table on or off with one click.
Whale Print Clusters Alerts On/Off - Toggles the Whale Print cluster symbol on or off.
Whale Print Cluster Symbol - Changes the symbol on the chart for Whale Clusters. Emojis and text can both be used instead of the default symbol.
Whale Print Cluster Bullish/Bearish Label Color - Customizes the color of the Whale Print cluster labels on the chart. Whale Print Cluster Alerts
Whale Print Cluster alerts can be automated with standard TradingView alerts. To set this up:
Click the Alert icon on the right side of the screen.
Change Condition to the RT-Main Indicator.
Change the second condition to one of the two options:
Bull Whale Cluster Alert | Bear Whale Cluster Alert
Set Trigger to Once Per Bar Close. Once set up, this allows traders to be notified when the RT-Main Indicator detects a Whale Print Cluster.
Bull/Bear Trend Step Line
The inflection point of the colored candles is controlled by the Bull/Bear Trend Step Line. This is the grey stepped line on the chart where the bullish and bearish colors meet. Candles above this line are marked by the four bullish candle colors.
Candles below this line are marked by the four bearish candle colors.
The Bull/Bear Trend Step Line can be tuned with:
Bull/Bear Line Offset - Controls a vertical threshold for the line.
Bull/Bear Line Smoothness - Controls the sensitivity and smoothness of the line so traders can fine tune it for their specific setups. Most traders do not adjust the Bull/Bear Step Line. The small group that does typically only use these settings for lower timeframe trading setups below 5 minute candles. If preferred, the line can be recolored or hidden from the Style tab of the RT-Main Indicator without changing how the core color logic works.
Important Note
The RT-Main Indicator is intended to provide additional context around trend strength, exhaustion, and key areas of support and resistance. It is not a standalone signal generator and should always be used together with your own analysis, testing, and risk management. Historical color patterns, pivots, and Whale Prints do not guarantee future results.
🐋 Tight lines and happy trading!

CVD Smart ReversalCVD Smart Reversal - Indicator Description
═══════════════════════════════════════════════════════════════
🎯 OVERVIEW
Advanced reversal detection system based on Cumulative Volume Delta (CVD) analysis with intelligent quality filtering. Each signal is rated 1-5 stars based on multiple confirmation factors.
═══════════════════════════════════════════════════════════════
🌟 KEY FEATURES
1. Quality Score System (⭐1-5)
• 5 independent criteria evaluate each signal
• Filter weak setups - show only 3+ star signals
• Higher scores = higher probability setups
2. Adaptive Thresholds
• Automatically adjusts to market volatility
• High volatility = stricter criteria
• Works across all market conditions
3. Volume Context Analysis
• Compares current vs historical volume
• Calculates buy/sell pressure (requires >60%)
• Filters reversals with weak volume
4. Multi-Timeframe Confirmation (Optional)
• Validates signals on higher timeframe
• Ensures trading with the trend
• Reduces counter-trend entries
5. Smart Signal Management
• Minimum 5-bar spacing between signals
• Automatic label cleanup (max 20)
• Clean chart, no clutter
═══════════════════════════════════════════════════════════════
📊 HOW IT WORKS
CVD Calculation:
Custom volume delta calculation using intrabar polarity estimation.
Signal Detection:
Combines CVD reversal, candlestick patterns (Hammer, Shooting Star, Engulfing, Pin Bar), and divergence analysis.
Quality Scoring:
Each signal scores 0-5 points based on:
• CVD strength (statistical deviation)
• Pattern quality (professional recognition)
• Divergence presence
• Volume context (ratio + pressure)
• Trend confirmation (MTF or acceleration)
═══════════════════════════════════════════════════════════════
🎮 USAGE MODES
Sniper Mode (High Quality):
• Min Score: 4-5 stars
• MTF: ON
• Result: 2-5 signals/day, highest win-rate
Active Mode (Balanced):
• Min Score: 3 stars
• MTF: OFF
• Result: 5-15 signals/day, good balance
Scalping Mode (High Frequency):
• Min Score: 2 stars
• Divergence: Weak
• Result: Many signals, fast execution needed
═══════════════════════════════════════════════════════════════
💡 BEST PRACTICES
• Use on liquid markets with reliable volume data
• Combine with key support/resistance levels
• Pay attention to quality scores - 4-5★ have significantly higher success
• Enable MTF confirmation for intraday trading
• Use stricter settings during high-impact news events
═══════════════════════════════════════════════════════════════
⚙️ DEFAULT SETTINGS
• Quality Filter: ON
• Minimum Score: 3 stars
• MTF Confirmation: OFF
• Volume Analysis: ON
• Divergence Strength: Medium
These settings provide 5-15 quality signals per day on active instruments.
═══════════════════════════════════════════════════════════════
🔔 ALERTS
Four alert types available:
• Strong Bullish Reversal (4-5★ only)
• Strong Bearish Reversal (4-5★ only)
• Regular Bullish Reversal (all qualified)
• Regular Bearish Reversal (all qualified)
═══════════════════════════════════════════════════════════════
⚠️ LIMITATIONS
• Requires volume data (not suitable for markets without volume)
• MTF confirmation adds lag by design
• Lower timeframes may need adjusted settings
• Quality filter reduces signal frequency by design
═══════════════════════════════════════════════════════════════
🎯 ORIGINALITY
This indicator combines multiple unique elements:
• Multi-factor quality scoring (not found in other CVD tools)
• Adaptive volatility-based thresholds
• Volume pressure calculation with directional filter
• Integrated MTF confirmation within scoring system
• Smart label management with automatic cleanup
The quality scoring system transforms CVD analysis from binary signals into a ranked opportunity system, allowing traders to prioritize setups based on confluence strength.
═══════════════════════════════════════════════════════════════
📈 DISPLAY ELEMENTS
• Background highlighting on signal bars
• Triangle markers at entry points
• Labels showing CVD, Delta, Divergence, Quality Score, Volume flag
• Real-time info panel with CVD metrics
• Clean visual presentation
═══════════════════════════════════════════════════════════════
✅ SUITABLE FOR
• Crypto (BTC, ETH, etc.)
• Stocks (AAPL, TSLA, SPY, etc.)
• Futures (ES, NQ, CL, etc.)
• Forex (brokers with volume data)
• All timeframes (1m to 1D)
═══════════════════════════════════════════════════════════════

DeltaFlow Matrix═════════════════─────────
DELTAFLOW MATRIX - COMPLETE GUIDE
For 1-Minute Scalping
═════════════════─────────
───────────────────────────────────────
📊 VISUAL ELEMENTS EXPLAINED (What You See on the Chart)
───────────────────────────────────────
🟦🟥 RED/GREEN BARS ON THE RIGHT = Delta Flow Direction
The horizontal bars extending right from your chart show WHO controlled the price at each level. Green = bulls won, Red = bears won. Longer bars = more volume traded at that price. Example: If BTC is at $100,000 and you see a massive green bar, that means buyers aggressively absorbed all sell orders at that exact price level.
📊 GRADIENT BACKGROUND (Heat Map) = Volume Intensity
The colored background behind the bars shows volume concentration. Darker/more opaque = heavy trading, lighter/transparent = light trading. Example: A dark background at $99,800 means that's where most traders are positioned - it's a "magnet price" where BTC keeps returning.
🟩 GREEN BOX WITH BORDER = POC (Point of Control)
This is THE most important price on your chart - where the absolute highest volume traded. This is where the majority of traders are stuck. Example: POC at $99,950 means most BTC holders bought/sold there. Price will be magnetically pulled back to test this level repeatedly.
⬜ WHITE DOTTED LINES = VA High and VA Low (Value Area)
These lines contain 70% of all trading volume. Think of them as "fair price boundaries." Example: VA High at $100,200, VA Low at $99,700 means BTC's "fair value range" is $99,700-$100,200. Breakouts above/below these lines are significant moves.
💜 MAGENTA BORDER ON BARS = MICRO-SR (Micro Support/Resistance)
These magenta-outlined bars mark high-frequency support/resistance zones where price repeatedly bounced. These are your scalping zones. Example: MICRO-SR at $99,975 means BTC touched this price multiple times in the last 100 bars - it's a critical battle line for 1-minute scalpers.
🟡 GOLD TEXT "BULL EXHAUST" / "BEAR EXHAUST" = Exhaustion Zones
When one side dominated the volume BUT the trend is dying. This is where the big money got tired. Example: "BULL EXHAUST" at $100,100 means buyers pushed hard but are running out of steam - expect a reversal or consolidation soon.
🔵 CYAN TEXT "FLOW SHIFT ↑" / "FLOW SHIFT ↓" = Institutional Reversal
This is the holy grail - when delta completely flipped from bearish to bullish (or vice versa) with increasing volume. This marks where institutions changed their position. Example: "FLOW SHIFT ↑" at $99,900 means selling pressure just turned into aggressive buying - the big players reversed direction.
🟠 ORANGE TEXT "FAILED SHIFT ↑" / "FAILED SHIFT ↓" = Failed Institutional Reversal
When a FLOW SHIFT appears but then gets rejected by the opposite side within 3-10 bars. This means institutions TRIED to reverse but couldn't - the other side is defending hard. Example: "FAILED SHIFT ↑" at $99,900 means bulls attempted to take control but bears defended and stopped the reversal - this is a bearish sign, price likely continues down.
🟢 GREEN "COILED" LABEL BELOW PRICE = Bullish Compression Setup
When price is compressed below VA Low with 5+ MICRO-SR resistance levels stacked overhead AND bullish momentum is building. This is a spring-loaded long setup - price is coiled under resistance ready to explode upward. Example: BTC at $99,700, VA Low at $100,000, 7 MICRO-SR levels stacked from $100,100-$100,400, and delta shows +45 with bullish flow → "COILED" appears. This means price is compressed like a spring with bullish pressure building - when it breaks, it will rip through all those overhead levels fast.
🔴 RED "COILED" LABEL ABOVE PRICE = Bearish Compression Setup
When price is extended above VA High with 5+ MICRO-SR support levels stacked below AND bearish momentum is building. This is a spring-loaded short setup - price is coiled above support ready to crash downward. Example: BTC at $100,500, VA High at $100,200, 6 MICRO-SR levels stacked from $100,000-$99,700, and delta shows -52 with bearish flow → "COILED" appears. This means price is compressed with bearish pressure building - when it breaks down, it will slice through all those support levels.
🔴🟢 "REJECT" LABEL = Failed Breakout / Rejection
When price enters a cluster zone (resistance or support) but shows opposite momentum - the breakout attempt failed. Example: Price pushed up into overhead resistance at $100,200 but delta turns bearish (-38) → "REJECT" appears in red above price. This means the breakout attempt was rejected, bulls who entered are trapped, expect reversal down.
⚠️ "WALL ↑" / "WALL ↓" = Resistance/Support Wall Alert
When 5+ MICRO-SR levels are stacked together creating a "wall" of resistance or support. These are significant barriers where price will likely stall or reverse. Example: "WALL ↑ 7x" means there are 7 MICRO-SR resistance levels stacked above current price - breaking through this will be very difficult without strong momentum and volume.
🔴🟢 "BULL ATTACK" / "BEAR ATTACK" = Aggressive Momentum
One side is attacking with both high delta AND increasing volume. This is active warfare. Example: "BEAR ATTACK" at $100,050 means sellers are aggressively dumping with rising volume - price is likely to drop fast.
🛡️ "BULL DEFENSE" / "BEAR DEFENSE" = Holding the Line
One side has high delta but volume is flat or decreasing - they're defending a level, not pushing. Example: "BULL DEFENSE" at $99,850 means buyers are absorbing sells to prevent BTC from dropping further, but they're not strong enough to push up yet.
⚖️ "EQUILIBRIUM" / "ROTATION" = Balanced Market
Bulls and bears are equally matched - perfect for range trading, terrible for breakout trades. Example: "EQUILIBRIUM" at $100,000 means the market is perfectly balanced here - trade the range, don't chase breakouts.
📈📉 "UP" / "DN" ARROWS = Volume Trend
Small green "UP" or red "DN" labels show if volume is increasing or decreasing at that price level over time. Example: "UP" at $99,900 means more traders are entering positions at this price compared to earlier - this level is becoming more important.
⇈⇊ DOUBLE ARROWS = Delta Momentum Acceleration
These show when delta is accelerating rapidly - not just strong, but GETTING STRONGER. Example: ⇈ at $100,050 means bullish delta isn't just high, it's accelerating - expect explosive upward movement.
🟢🔴 VELOCITY BANDS (Horizontal bars far right) = Volume Acceleration
Thin horizontal bars extending from the profile show how fast volume is building. Green = volume accelerating up, Red = volume accelerating down. Example: Green velocity band at $100,100 means volume is spiking at this level right now - action is heating up.
💜 "x3.8" LABEL ABOVE CANDLE = Volume Spike Signal
Magenta text showing volume multiplier. Example: "x3.2" above a BTC candle means this candle had 3.2 times the average volume - something big just happened (news, liquidation cascade, whale entry).
🟢🔴 THICK LINE AT VA HIGH/LOW = Breakout with Momentum
When BTC breaks the VA line, the line changes:
- Thin line (width 2) = Weak breakout (<30Δ momentum)
- Medium line (width 3) = Medium breakout (30-60Δ)
- Thick dashed line (width 4) = STRONG breakout (>60Δ) - THIS IS THE FLASH
The label also changes: "VA High 72Δ V✓ STRONG" = 72 delta momentum, volume confirmed, strong breakout.
🔵 CYAN DASHED LINE AT POC = POC Bounce Flash
A short cyan dashed line appears when BTC bounces off the POC with a bullish reversal candle. This is your highest-probability long entry - the POC "magnet" just pulled price back and bulls are responding.
───────────────────────────────────────────────
🧠 PATTERN COMBINATIONS = Market Psychology (What Traders Are Thinking)
───────────────────────────────────────────────
🚀 PATTERN 1: "The Nitro Boost" (Highest Win Rate)
WHAT YOU SEE: FLOW SHIFT ↑ appears below current price + only MICRO-SR (magenta) levels above + Volume Spike (x2.5+)
PSYCHOLOGY: Big money just reversed from selling to buying. Retail still thinks it's going down. All the nearby resistance levels are weak (just micro-levels). The explosion in volume means someone BIG just entered.
EXAMPLE: BTC at $99,900, FLOW SHIFT ↑ just appeared, above you see MICRO-SR at $100,000, $100,050, $100,100 with no major resistance. Volume spike shows x3.1. → Institutions flipped bullish and the path of least resistance is UP. These MICRO-SR levels will be blown through like paper.
TRADE: Long immediately, targets at each MICRO-SR level, stop below the FLOW SHIFT price.
💎 PATTERN 2: "The Wall" (Reversal Setup)
WHAT YOU SEE: BULL/BEAR EXHAUST at a price level + Price approaching POC from above/below + Delta momentum arrows (⇊) pointing opposite to price movement
PSYCHOLOGY: One side pushed too hard and ran out of gas right as they're approaching the most important price level (POC). Delta momentum is reversing. The "wall" of volume at POC will reject them.
EXAMPLE: BTC pushed from $99,800 to $100,200, now "BULL EXHAUST" appears at $100,200. POC is at $100,000. You see ⇊ (bearish delta acceleration). → Bulls exhausted themselves pushing up, POC will act as resistance, bears are accelerating. Price will get rejected back down.
TRADE: Short at current price, target is POC at $100,000, stop above the exhaust level.
⚔️ PATTERN 3: "The War Zone" (Stay Out)
WHAT YOU SEE: BULL ATTACK and BEAR ATTACK labels alternating rapidly + EQUILIBRIUM or ROTATION at current price + VA lines very close together
PSYCHOLOGY: Bulls and bears are in full battle mode, neither side is winning. The market is chopping violently in a tight range. This is where retail gets destroyed by whipsaw.
EXAMPLE: BTC bouncing between $99,900-$100,100. "BULL ATTACK" at $100,000, "BEAR ATTACK" at $100,050, "EQUILIBRIUM" at $100,025. VA High at $100,100, VA Low at $99,900. → Pure chaos. Both sides throwing punches, nobody winning.
TRADE: STAY OUT. Wait for exhaustion or flow shift. If you must trade, use very tight ranges (buy at VA Low, sell at VA High, 5-tick stops).
🎯 PATTERN 4: "The Breakout Confirmation" (High Confidence)
WHAT YOU SEE: VA breakout with STRONG label + Volume spike (x2.0+) + FLOW SHIFT in breakout direction + No major resistance for 50+ ticks
PSYCHOLOGY: Every signal is aligned. Price broke the fair value range WITH strong momentum, WITH volume confirmation, WITH institutional flow reversal. This is the "perfect storm" breakout.
EXAMPLE: BTC breaks VA High at $100,200. Label changes to "VA High 68Δ V✓ STRONG" (thick dashed line). Volume spike shows x2.8. FLOW SHIFT ↑ appears at $100,210. Next resistance is MICRO-SR at $100,400. → This is as good as it gets. Institutions are buying, retail FOMO is coming, momentum is strong.
TRADE: Long on the breakout, targets at +100 ticks ($100,300), +200 ticks ($100,400), trail stop below the breakout candle.
🛡️ PATTERN 5: "The Failed Breakout" (Fade Setup)
WHAT YOU SEE: VA breakout with WEAK label + No volume spike + DEFENSE label appears (opposite side) + Delta momentum arrows pointing back into VA
PSYCHOLOGY: Price tried to break out but without conviction. No volume = no big players interested. The defending side is holding the line. Breakout traders are about to get trapped.
EXAMPLE: BTC breaks VA High at $100,200. Label shows "VA High 23Δ WEAK" (thin line). No volume spike. "BEAR DEFENSE" appears at $100,220. You see ⇊ (bearish acceleration). → Weak breakout, bears defending, momentum reversing. Bull breakout traders are trapped.
TRADE: Short the failed breakout, target is back inside VA (POC at $100,000), stop above the high.
🧲 PATTERN 6: "The POC Magnet" (Mean Reversion)
WHAT YOU SEE: Price far from POC (100+ ticks away) + Volume decreasing (DN arrows) + No ATTACK or FLOW SHIFT labels + MICRO-SR levels between current price and POC
PSYCHOLOGY: Price overextended from the most important level. No new aggressive volume is coming in. Market is tired. Like a rubber band, price will snap back to POC where most traders are positioned.
EXAMPLE: BTC at $100,350, POC at $100,000 (350 ticks away). "DN" arrows showing volume declining. "ROTATION" at current price. MICRO-SR at $100,300, $100,200, $100,100. → Overextended, running out of steam, POC will pull it back.
TRADE: Short with targets at each MICRO-SR level on the way down to POC, final target at POC itself.
💥 PATTERN 7: "The Liquidation Cascade" (Momentum Continuation)
WHAT YOU SEE: Multiple consecutive candles with volume spikes (x2.5+) + ATTACK label same direction + Delta momentum arrows same direction (⇈ or ⇊) + Breaking through MICRO-SR levels without stopping
PSYCHOLOGY: Liquidations are triggering more liquidations. Stop losses are getting hit, triggering more stop losses. This is a cascade - it won't stop until hitting POC or VA boundary. Retail is getting destroyed, institutions are feasting.
EXAMPLE: BTC drops from $100,200. Candles show x2.7, x3.1, x2.9 volume spikes. "BEAR ATTACK" at every level. ⇊ arrows accelerating. MICRO-SR levels at $100,100, $100,000, $99,900 all getting destroyed. POC at $99,750. → Liquidation cascade in progress. Won't stop until POC.
TRADE: If you're in the direction, hold until POC. If not in, wait for POC to enter counter-trend. DO NOT try to catch this knife early.
🔄 PATTERN 8: "The Reversal Confirmation" (Highest Probability Entry)
WHAT YOU SEE: POC Bounce Flash (cyan dashed line) + FLOW SHIFT in new direction + Volume spike + Price bouncing off POC with bullish/bearish engulfing candle
PSYCHOLOGY: Price hit the most important level (POC) and institutions just reversed direction. This is THE signal. The magnet worked, price came back to POC, and big money is now pushing it the other way.
EXAMPLE: BTC drops to POC at $100,000. Cyan dashed POC bounce flash appears. Bullish engulfing candle. "FLOW SHIFT ↑" appears. Volume spike x2.6. → Perfect reversal setup at the most important price level with institutional confirmation.
TRADE: Long at POC, target next MICRO-SR or VA High, stop below POC. This is your highest win-rate setup.
🎪 PATTERN 9: "The Fake-Out Trap" (Avoid or Fade)
WHAT YOU SEE: FLOW SHIFT appears + No volume spike + EXHAUST label appears within 3-5 candles same direction + Delta momentum arrows reverse
PSYCHOLOGY: Someone tried to fake a reversal (maybe a whale painting the tape) but there's no real follow-through. The move exhausted immediately. Traders who followed the FLOW SHIFT are about to get trapped.
EXAMPLE: "FLOW SHIFT ↑" appears at $99,950. No volume spike. Within 3 candles, "BULL EXHAUST" appears at $100,000. ⇊ arrows appear. → False reversal, trap set, traders entering longs are getting baited.
TRADE: Fade it. Short when exhaust appears, target back below the fake FLOW SHIFT level.
🏆 PATTERN 10: "The Perfect Storm Long" (All Systems Go)
WHAT YOU SEE: Price above POC + FLOW SHIFT ↑ + VA Low breakout with STRONG + Volume spike + Only MICRO-SR resistance above + BULL ATTACK label + ⇈ acceleration
PSYCHOLOGY: Everything aligned bullish. Institutions buying, momentum strong, volume confirming, path clear. This is when retail FOMO kicks in and you get the biggest moves.
EXAMPLE: BTC at $100,100. POC at $100,000 (above POC ✓). "FLOW SHIFT ↑" at $100,050 ✓. "VA Low 71Δ V✓ STRONG" breakout ✓. Volume x3.4 ✓. MICRO-SR at $100,300, $100,500 (weak resistance) ✓. "BULL ATTACK" ✓. ⇈ arrows ✓. → Every single bullish signal firing. This is the setup you wait for all day.
TRADE: Long with size, targets at +200 ticks minimum, trail aggressively, stop only if FLOW SHIFT reverses.
🎯 PATTERN 11: "The Coiled Spring" (High Probability Breakout)
WHAT YOU SEE: "COILED" label appears + 5-8 MICRO-SR levels stacked in breakout direction + Delta +30 or higher (for long) / -30 or lower (for short) + Price compressed below VA Low (long) or above VA High (short)
PSYCHOLOGY: Price is compressed in a weak position with heavy resistance/support overhead, BUT institutions are building momentum in the direction of the breakout. When it breaks, all those clustered MICRO-SR levels will be blown through rapidly because the spring is loaded. This is the setup where you get 100-200 tick moves in minutes.
EXAMPLE: BTC at $99,650. VA Low at $100,000. "COILED" (green) appears below price. WALL ↑ 8x showing 8 MICRO-SR levels from $100,100-$100,800. Delta shows +47. FLOW SHIFT ↑ just appeared. → Price is coiled below massive resistance wall with strong bullish momentum building. When VA Low breaks, the spring releases and price will rip through all 8 resistance levels.
TRADE: Long when price breaks VA Low with volume confirmation, targets at each MICRO-SR cluster (+100, +200, +300 ticks), trail stop below breakout candle. This is your "moonshot" setup.
🛑 PATTERN 12: "The Failed Shift Trap" (Fade Setup)
WHAT YOU SEE: "FAILED SHIFT ↑" or "FAILED SHIFT ↓" appears + Strong opposite momentum (⇊ for failed bull shift, ⇈ for failed bear shift) + No volume spike + Price back in original range
PSYCHOLOGY: Institutions attempted a reversal but the other side defended hard and rejected it. Traders who followed the FLOW SHIFT are now trapped. The failed reversal confirms the original trend will continue - the defending side is in control.
EXAMPLE: BTC pushed from $100,200 to $99,900. "FLOW SHIFT ↓" appeared at $100,100 signaling bearish reversal. Within 5 bars, bulls defended at $99,850, pushing price back to $100,000. "FAILED SHIFT ↓" now appears at $100,100 with ⇈ (bullish acceleration). → Bears tried to reverse trend but failed. Bulls defended successfully. Original uptrend continues.
TRADE: Fade the failed shift. If "FAILED SHIFT ↓" appears, go long (bulls won the battle). If "FAILED SHIFT ↑" appears, go short (bears won). Target is back to the other side of the range.
⚠️ PATTERN 13: "The Wall Collision" (High Risk, High Reward)
WHAT YOU SEE: "WALL ↑" or "WALL ↓" with 6+ levels + Price approaching wall with strong momentum (ATTACK label) + Volume spike + Delta accelerating (⇈ or ⇊)
PSYCHOLOGY: Unstoppable force meeting immovable object. Price is charging at a massive wall of resistance/support with strong momentum. Either it breaks through explosively OR it gets rejected violently. This is binary - huge win or huge loss.
EXAMPLE: BTC at $100,050 with "BULL ATTACK" and ⇈ arrows. Volume x3.2. Approaching "WALL ↑ 9x" at $100,200-$100,600. POC at $100,300 (inside the wall). → Bulls charging at massive resistance wall with strong momentum. If they break through, it's explosive. If rejected, crash back down.
TRADE: ADVANCED ONLY. Wait for the collision. If price breaks through wall with FLOW SHIFT confirmation + volume spike, go long immediately with tight stop. If price gets REJECTED (bearish delta appears at wall), short immediately targeting POC. DO NOT enter before knowing the outcome.
🔄 PATTERN 14: "The Rejection Reversal" (Counter-Trend Entry)
WHAT YOU SEE: "REJECT" label appears + Price in cluster zone + Opposite side DEFENSE or ATTACK label appears + Delta momentum reverses (⇈ to ⇊ or vice versa)
PSYCHOLOGY: The breakout failed, trapped traders are exiting, and the opposite side is now attacking the weak hands. This creates fast moves back in the original direction.
EXAMPLE: BTC breaks VA High to $100,250. Weak volume, delta only +22. Enters overhead MICRO-SR cluster. "REJECT" appears in red. "BEAR DEFENSE" appears at $100,280. ⇊ arrows appear. → Breakout failed, bulls trapped, bears attacking. Price will reverse fast.
TRADE: Counter-trend entry in direction of REJECT. Short when "REJECT" appears with bearish confirmation, target is back to POC or VA Low. Stop above the rejection high. Fast scalp.
───────────────────────────────────────────────────────────────────────────────
⚡ QUICK REFERENCE CHEAT SHEET
───────────────────────────────────────────────────────────────────────────────
SAFEST ENTRIES (Highest Win Rate):
✅ POC Bounce Flash + FLOW SHIFT (Pattern 8)
✅ FLOW SHIFT + Only MICRO-SR above + Volume Spike (Pattern 1)
✅ Strong VA Breakout + Volume Spike + FLOW SHIFT (Pattern 4)
✅ COILED label + Multiple stacked MICRO-SR + Delta >30 (Pattern 11)
DANGER ZONES (Stay Out):
⛔ BULL ATTACK + BEAR ATTACK alternating (Pattern 3)
⛔ FLOW SHIFT + No volume + Quick exhaust (Pattern 9)
⛔ EQUILIBRIUM at current price with tight VA range
⛔ WALL collision without clear direction (Pattern 13 - wait for outcome)
FADE/REVERSAL SETUPS:
🔄 EXHAUST at price level + Approaching POC (Pattern 2)
🔄 Weak VA Breakout + DEFENSE opposite side (Pattern 5)
🔄 Price far from POC + Volume declining (Pattern 6)
🔄 FAILED SHIFT appears + Opposite momentum (Pattern 12)
🔄 REJECT label + Opposite ATTACK/DEFENSE (Pattern 14)
HOLD/MOMENTUM CONTINUATION:
🚀 Multiple volume spikes + ATTACK label + ⇈/⇊ arrows (Pattern 7)
🚀 All bullish/bearish signals aligned (Pattern 10)
🚀 COILED spring release through wall (Pattern 11)
═══════════════════════════════════════════════════════════
Remember: The indicator shows you WHERE the big money is (POC), WHAT they're doing (FLOW SHIFT), and HOW HARD they're doing it (volume spikes, momentum). Your job is to follow the big money, not fight them. When institutions shift, you shift. When they exhaust, you fade. When they're in a war, you stay out. Trade with the whales, not against them.
════════════════════════════════════════════════════════════
═══════════════════════════════════════════════════════════════════════════════
ENHANCED DELTA VOLUME PROFILE - TECHNICAL CALCULATIONS GUIDE
How Each Element is Actually Calculated
═══════════════════════════════════════════════════════════════════════════════
───────────────────────────────────────────────────────────────────────────────
🧮 CORE CALCULATIONS (The Math Behind What You See)
───────────────────────────────────────────────────────────────────────────────
📊 VOLUME BINS = Price range divided into 40 horizontal slices
The indicator takes the last 100 candles (configurable), finds the highest and lowest price touched, then divides that range into 40 equal "bins" (horizontal price levels). Each bin collects volume from candles that touched that price range. Example: BTC ranged from $99,500 to $100,500 in the last 100 bars. That's $1,000 range ÷ 40 bins = $25 per bin. Bin 1 = $99,500-$99,525, Bin 2 = $99,525-$99,550, etc.
🟦🟥 DELTA CALCULATION = (Bull Volume - Bear Volume) / Total Volume × 100
For each bin, the indicator separates bullish candles (close > open) from bearish candles (close < open). Delta = ((bull volume - bear volume) / total volume) × 100. This gives you a percentage from -100% (pure selling) to +100% (pure buying). Example: At $100,000, if 70 BTC was traded on green candles and 30 BTC on red candles, delta = ((70-30)/100) × 100 = 40% bullish.
🎨 GRADIENT COLOR = Delta converted to color spectrum
The delta percentage (-100 to +100) is mapped to a color gradient. -100% = pure bearish color (orange/red), 0% = neutral, +100% = pure bullish color (cyan/blue). The color you see on each bar directly represents the delta. Example: A bright cyan bar = high positive delta (strong buying), orange bar = high negative delta (strong selling), gray bar = balanced (delta near 0%).
🟩 POC (Point of Control) = Bin with the absolute highest total volume
The indicator sums up all volume in each of the 40 bins, then finds which bin has the most. That's your POC. Example: Bin 15 (around $100,000) collected 1,250 BTC of volume, which is more than any other bin. Bin 15 is your POC. This is where the most trading happened and where most traders are positioned.
⬜ VALUE AREA (VA) = The bins containing 70% of total volume, centered on POC
Starting from the POC, the indicator expands up and down, adding bins one at a time (choosing the bin with more volume each time) until it has captured 70% of all volume. The top of this range = VA High, bottom = VA Low. Example: POC at $100,000. Expanding out captures 70% of volume from $99,700 to $100,300. VA Low = $99,700, VA High = $100,300.
📈📉 VOLUME TREND = (Recent Volume - Old Volume) / Total Volume
The indicator splits your 100-bar lookback into three periods: Recent (last 15 bars), Mid (bars 15-30), and Older (last 15 bars of the 100). For each bin, it compares recent volume to older volume. If recent > older, trend is UP. If recent < older, trend is DOWN. Example: At $100,000, recent 15 bars had 80 BTC volume, older 15 bars had 40 BTC. Trend = (80-40)/(80+40) = 0.33 = UP. This shows volume is increasing at this level.
💜 MICRO-SR DETECTION = High volume (>60% of max) + High hits (>20% of max) + Active volume trend
A bin becomes MICRO-SR if: (1) Its volume is at least 60% of the highest-volume bin, (2) Price touched it frequently (at least 20% as many times as the most-touched bin), (3) Volume trend isn't flat (absolute trend > 0.05). Example: Bin at $99,975 has 750 BTC (75% of max), was hit 45 times (30% of max hits), volume trend = 0.08. = MICRO-SR (magenta border).
🟡 EXHAUSTION DETECTION = Extreme delta (>65%) + Declining volume trend (<-0.15) OR Extreme delta + Volume spike (>1.5× average)
Two ways to detect exhaustion: (1) One side dominated (delta > 65% or < -65%) BUT volume is decreasing (trend < -0.15), meaning participation is dropping. (2) Extreme delta WITH a huge volume spike (>1.5× average for that bin), meaning climactic volume. Example: At $100,200, delta = 72% bullish, but volume trend = -0.22 (declining). = BULL EXHAUST. Bulls won but are running out of steam.
🔵 FLOW SHIFT DETECTION = Delta changed sign (+ to - or - to +) + Delta change >40% + Volume trend increasing (>0.1)
Compares each bin's delta to the previous bin's delta. If delta flipped from negative to positive (or vice versa) by more than 40%, AND volume is increasing, = FLOW SHIFT. Example: Previous bin at $99,950 had -35% delta (bearish). Current bin at $100,000 has +45% delta (bullish). Change = 80% (flipped + exceeded 40%), volume trend = +0.15. = FLOW SHIFT ↑.
⇈⇊ DELTA MOMENTUM = Current delta - Average delta of last 3 bins
For each bin, the indicator looks at the previous 3 bins, calculates their average delta, then compares current delta to that average. If current delta is significantly higher/lower than the 3-bin average, momentum arrows appear. Example: Last 3 bins had deltas of 20%, 25%, 30% (average = 25%). Current bin delta = 55%. Momentum = 55 - 25 = +30 = ⇈ (strong bullish acceleration).
🟢🔴 VOLUME ACCELERATION = Rate of change of volume trend across three periods
Compares how volume changed from Old→Mid vs Mid→Recent. If Recent increased MORE than Mid did compared to Old, = positive acceleration. Formula: ((Recent-Mid) - (Mid-Old)) / |Mid-Old|. Example: Old=100, Mid=120, Recent=160. Mid increased by 20, Recent increased by 40. Acceleration = (40-20)/20 = 1.0 = strong acceleration (green velocity band).
⚖️ BALANCE SCORE = Combines volume balance, price range balance, and hit frequency
Three factors weighted equally: (1) How balanced is bull vs bear volume? (1 - |bull-bear|/total). (2) How tight is the price range? (1 - avgRange/maxRange). (3) How frequently was it hit? (hits/maxHits). Multiply these together. Score >0.7 = EQUILIBRIUM. Example: Volume is 55% bull / 45% bear = 0.9 balance. Range is tight = 0.8. Hit frequently = 0.85. Score = 0.9 × 0.8 × 0.85 = 0.61 = ROTATION.
📊 BULL/BEAR ATTACK/DEFENSE = Delta threshold (>60% or <-60%) + Volume trend direction
ATTACK = High delta (>60% either direction) + Volume trend increasing (>0.15). DEFENSE = High delta (>60% either direction) + Volume trend NOT increasing (≤0.15). Example: Delta = 68% bullish, volume trend = 0.22 = BULL ATTACK (buying with increasing volume). Delta = 68% bullish, volume trend = 0.05 = BULL DEFENSE (buying but volume not increasing).
───────────────────────────────────────────────────────────────────────────────
🎯 SIGNAL CALCULATIONS (The New Features)
───────────────────────────────────────────────────────────────────────────────
💜 VOLUME SPIKE = Current bar volume / 20-bar average volume
Takes the current candle's volume and divides it by the simple moving average of the last 20 candles' volume. If ratio >2.0 (configurable), spike detected. The label shows the exact multiplier. Example: Current candle = 450 BTC volume. 20-bar average = 140 BTC. Ratio = 450/140 = 3.21 = "x3.2" label appears in magenta above the candle.
🟢🔴 VA BREAKOUT MOMENTUM = POC bin's delta (absolute value)
When price breaks VA High or VA Low, the indicator looks at the POC bin's delta to measure momentum strength. Uses absolute value (ignore direction). <30 = WEAK, 30-60 = MED, >60 = STRONG. Line thickness and style change based on this. Example: BTC breaks VA High. POC bin delta = 72%. Momentum = 72 = STRONG. Line = width 4 (thick), dashed (flash effect), label shows "VA High 72Δ V✓ STRONG".
📊 BREAKOUT LINE THICKNESS = Momentum-based dynamic sizing
- Momentum <30: Line width = 2 (thin), solid line
- Momentum 30-60: Line width = 3 (medium), solid line
- Momentum >60: Line width = 4 (thick), dashed line (creates flash effect)
Example: Breakout with 45% momentum = width 3 solid line. Breakout with 75% momentum = width 4 dashed line (flashing).
✓ VOLUME CONFIRMATION = Current volume / 20-bar average >1.5
Checks if the breakout candle has strong volume. If current volume is at least 1.5× the 20-bar average, adds "V✓" to the label. Example: Breakout candle has 280 BTC volume, 20-bar average is 160 BTC. Ratio = 280/160 = 1.75 > 1.5 = "V✓" appears in label.
🔵 POC BOUNCE DETECTION = Price within 0.5 bin-step of POC + Bullish reversal candle + Previous candle was bearish
Three conditions must all be true: (1) Current close price is within half a bin's height from POC price. (2) Current candle is bullish (close > open). (3) Previous candle was bearish (close < open). If all true = POC bounce, cyan dashed flash line appears. Example: POC at $100,000, bin step = $25. Current close = $100,008 (within $12.50 of POC ✓). Current candle green ✓. Previous candle red ✓. = POC Bounce Flash.
───────────────────────────────────────────────────────────────────────────────
⚙️ TECHNICAL PARAMETERS (What You Can Adjust)
───────────────────────────────────────────────────────────────────────────────
🔢 LOOKBACK PERIOD (Default: 100 bars) = How much history to analyze
The number of candles backwards from current that get analyzed. More bars = more stable but slower to react. Fewer bars = more reactive but noisier. For 1-minute BTC scalping, 100 bars = last 100 minutes = 1 hour 40 minutes of data. Example: Setting to 50 bars makes it more reactive to recent action but less stable. Setting to 200 bars makes it smoother but slower to show new developments.
🎚️ NUMBER OF BINS (Default: 40) = Resolution of price levels
How many horizontal slices to divide the price range into. More bins = finer resolution but more noise. Fewer bins = smoother but less precise. 40 bins for 1-minute = good balance. Example: With $1,000 range, 40 bins = $25 per level. 20 bins would be $50 per level (less precise). 60 bins would be $16.67 per level (more precise but noisier).
📏 DISPLAY OFFSET (Default: 10 bars) = How far right the profile extends
How many bars to the right of current candle the volume profile displays. Purely visual - doesn't affect calculations. Example: Offset = 10 means the profile extends 10 bars to the right. Offset = 30 means it extends further right (more separation from candles).
📊 VOLUME TREND PERIOD (Default: 15 bars) = How many recent bars define "recent"
The number of bars considered "recent" vs "old" when calculating volume trends. Shorter = more sensitive to very recent changes. Longer = smoother trends. Example: 15 bars means "recent" = last 15 candles (last 15 minutes on 1m chart). Setting to 5 would make it hyper-reactive to the last 5 minutes. Setting to 30 would make it smoother.
🎯 EXHAUSTION THRESHOLD (Default: 65%) = How extreme delta must be for exhaustion
The minimum delta percentage to trigger exhaustion detection. Higher = more selective (only extreme cases). Lower = more signals but more false positives. Example: 65% means delta must be >65% or <-65% to qualify. Setting to 75% would only catch the most extreme exhaustion. Setting to 55% would catch more cases.
💜 MICRO-LEVEL THRESHOLD (Default: 60%) = How strong a level must be for MICRO-SR
The minimum volume percentage (relative to max) required for MICRO-SR detection. Higher = fewer, stronger levels. Lower = more levels but weaker. Example: 60% means bin must have at least 60% of the max bin's volume. Setting to 70% would show only the strongest levels. Setting to 50% would show more levels.
⚡ DELTA MOMENTUM PERIOD (Default: 3 bars) = How many bins to average for momentum
How many previous bins to average when calculating delta momentum. Shorter = more sensitive acceleration signals. Longer = smoother, less noisy. Example: 3 bins means compares current to average of last 3. Setting to 5 would smooth out momentum detection. Setting to 2 would make it more reactive.
🌊 FLOW SHIFT SENSITIVITY (Default: 40%) = Minimum delta change for flow shift
How much delta must change between consecutive bins to trigger FLOW SHIFT. Lower = more flow shift signals (more sensitive). Higher = fewer, stronger signals. Example: 40% means delta must flip by at least 40% (e.g., from -20% to +20% or from +10% to -30%). Setting to 60% would only catch major reversals. Setting to 25% would catch smaller shifts.
💥 VOLUME SPIKE THRESHOLD (Default: 2.0x) = Multiplier to trigger spike signal
How many times above average volume must be to show the spike label. Higher = fewer spikes shown (only extreme). Lower = more spikes shown. Example: 2.0× means current volume must be at least double the 20-bar average. Setting to 3.0× would only show massive spikes. Setting to 1.5× would show more moderate spikes.
🚀 BREAKOUT MOMENTUM MINIMUM (Default: 20%) = Minimum delta for breakout signal
How much delta momentum required at POC for VA breakout to trigger. Higher = fewer breakout signals (more selective). Lower = more signals but more false positives. Example: 20% means POC delta must be at least 20% (or -20%) when price breaks VA. Setting to 30% would only show strong breakouts. Setting to 10% would show weaker breakouts too.
───────────────────────────────────────────────────────────────────────────────
🔬 ADVANCED TECHNICAL DETAILS
───────────────────────────────────────────────────────────────────────────────
📐 BIN POSITIONING = Price-to-bin mapping formula
For any price P, its bin index = floor((P - MinPrice) / BinStep). BinStep = (MaxPrice - MinPrice) / NumBins. Example: Range $99,000-$100,000, 40 bins. BinStep = $1,000/40 = $25. Price $99,550 → Bin 22: (99,550 - 99,000) / 25 = 22.
📊 VOLUME DISTRIBUTION = Proportional allocation across bins
When a candle spans multiple bins, its volume is distributed proportionally based on how much of the candle's range overlapped each bin. Example: Candle from $99,950 to $100,050 (range = $100) with 50 BTC volume. Bin 1 ($99,950-$99,975) gets 25% of range = 12.5 BTC. Bin 2 ($99,975-$100,000) gets 25% = 12.5 BTC. Bin 3 ($100,000-$100,025) gets 25% = 12.5 BTC. Bin 4 ($100,025-$100,050) gets 25% = 12.5 BTC.
🎨 COLOR GRADIENT MAPPING = Delta to RGB conversion
Delta percentage is normalized to 0-1 scale (from -100/+100 range), then mapped to RGB gradient. -100% (0.0) = Full bearish color RGB. 0% (0.5) = Neutral gray. +100% (1.0) = Full bullish color RGB. Example: Delta = 60% → Normalized = 0.8 → 80% towards full bullish color (bright cyan).
⚖️ BALANCE SCORE FORMULA = Weighted geometric mean
BalanceScore = (VolumeBalance^w) × (PriceBalance^w) × (HitBalance^w), where w=weight (default 1.0). VolumeBalance = 1 - |BullVol - BearVol|/TotalVol. PriceBalance = 1 - AvgRange/MaxRange. HitBalance = Hits/MaxHits. Example: Vol=0.9, Price=0.8, Hit=0.7 → Score = 0.9 × 0.8 × 0.7 = 0.504.
🔄 DELTA HISTORY TRACKING = Rolling array per bin
Each bin maintains an array of its last N delta values (where N = delta momentum period). When calculating momentum, current delta is compared to the average of this array. Example: Bin's delta history = . Average = 25%. Current = 55%. Momentum = 55 - 25 = 30.
📈 VOLUME VELOCITY = Second derivative of volume
Measures acceleration of volume change. Recent change = (Recent - Mid). Old change = (Mid - Old). Acceleration = (Recent change - Old change) / |Old change|. Positive = accelerating. Negative = decelerating. Example: Old=100, Mid=150, Recent=220. Recent change = 70. Old change = 50. Accel = (70-50)/50 = 0.4 = 40% acceleration.
🎯 VA EXPANSION ALGORITHM = Greedy breadth-first from POC
Start at POC bin. While accumulated volume < 70% of total: Look at bin above and bin below POC boundary. Choose whichever has more volume. Add that bin to VA. Repeat. Example: POC at bin 20. Bin 21 (above) has 80 BTC, Bin 19 (below) has 95 BTC. Add bin 19. Now VA = bins 19-20. Next: Bin 21 has 80, Bin 18 has 70. Add bin 21. VA = bins 19-21. Continue until 70% captured.
⏱️ REAL-TIME UPDATES = Recalculates on every new bar close
The entire profile recalculates when barstate.islast = true (current bar). All 40 bins are cleared and rebuilt from scratch using the last N candles. This ensures the profile is always accurate to the current market state. Example: On 1-minute chart, the profile fully recalculates every 60 seconds when the new candle opens.
🎨 RENDERING OPTIMIZATION = 500-bar future limit management
TradingView limits drawing objects to 500 bars into the future. The indicator calculates safe offsets: maxFutureBar = bar_index + 499, then caps all box/line/label positions to stay under this limit. Example: Current bar_index = 1000. Max future = 1499. Display offset wanted = 200. Safe offset = min(200, 400 - 100) = min(200, 300) = 200 ✓ safe.
───────────────────────────────────────────────────────────────────────────────
💡 INTERPRETATION TIPS
───────────────────────────────────────────────────────────────────────────────
🔢 Understanding Percentages:
- Delta 0-30%: Weak bias, essentially balanced
- Delta 30-60%: Moderate bias, one side has control
- Delta 60-85%: Strong bias, one side dominated
- Delta 85-100%: Extreme bias, one-sided market (exhaustion likely)
📊 Volume Trend Interpretation:
- Trend -1.0 to -0.3: Strong decline in participation
- Trend -0.3 to -0.1: Moderate decline
- Trend -0.1 to +0.1: Stable/flat volume
- Trend +0.1 to +0.3: Moderate increase
- Trend +0.3 to +1.0: Strong increase in participation
🎯 Balance Score Ranges:
- 0.0-0.3: Heavily imbalanced, strong directional bias
- 0.3-0.5: Moderate imbalance, rotation forming
- 0.5-0.7: Balanced rotation zone
- 0.7-1.0: Perfect equilibrium, range-bound
⚡ Momentum Thresholds:
- <10: Negligible momentum change
- 10-20: Moderate acceleration
- 20-40: Strong acceleration (arrow appears)
- >40: Extreme acceleration (very rare, very significant)
═══════════════════════════════════════════════════════════════════════════════
Understanding these calculations helps you know WHY the indicator is showing what it's showing. When you see "FLOW SHIFT ↑", you now know it calculated a >40% delta flip with increasing volume. When you see MICRO-SR, you know that level has >60% of max volume, >20% of max hits, and active participation. When you see ⇈, you know delta jumped significantly above its 3-bin average. Use this knowledge to trust the signals and understand their strength.
═══════════════════════════════════════════════════════════════════════════════
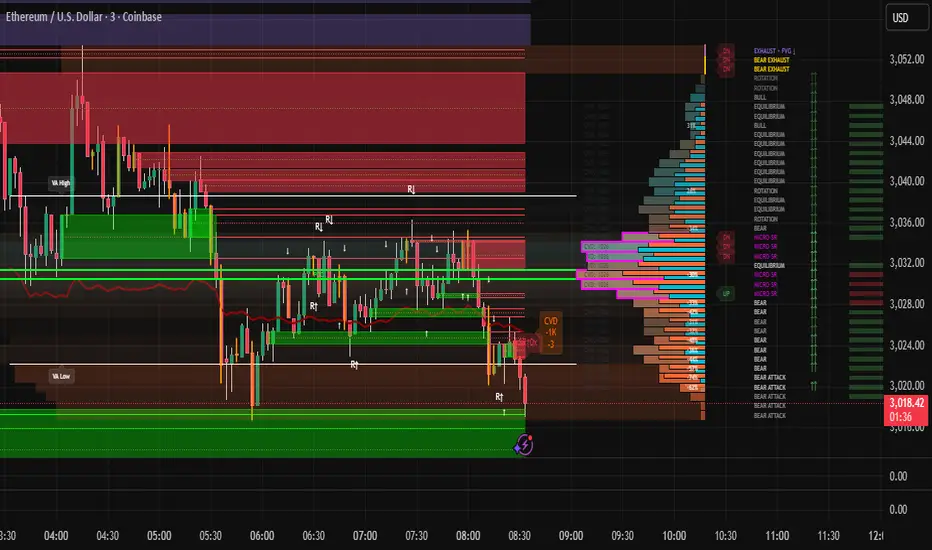
Algorithm Predator - ProAlgorithm Predator - Pro: Advanced Multi-Agent Reinforcement Learning Trading System
Algorithm Predator - Pro combines four specialized market microstructure agents with a state-of-the-art reinforcement learning framework . Unlike traditional indicator mashups, this system implements genuine machine learning to automatically discover which detection strategies work best in current market conditions and adapts continuously without manual intervention.
Core Innovation: Rather than forcing traders to interpret conflicting signals, this system uses 15 different multi-armed bandit algorithms and a full reinforcement learning stack (Q-Learning, TD(λ) with eligibility traces, and Policy Gradient with REINFORCE) to learn optimal agent selection policies. The result is a self-improving system that gets smarter with every trade.
Target Users: Swing traders, day traders, and algorithmic traders seeking systematic signal generation with mathematical rigor. Suitable for stocks, forex, crypto, and futures on liquid instruments (>100k daily volume).
Why These Components Are Combined
The Fundamental Problem
No single indicator works consistently across all market regimes. What works in trending markets fails in ranging conditions. Traditional solutions force traders to manually switch indicators (slow, error-prone) or interpret all signals simultaneously (cognitive overload).
This system solves the problem through automated meta-learning: Deploy multiple specialized agents designed for specific market microstructure conditions, then use reinforcement learning to discover which agent (or combination) performs best in real-time.
Why These Specific Four Agents?
The four agents provide orthogonal failure mode coverage —each agent's weakness is another's strength:
Spoofing Detector - Optimal in consolidation/manipulation; fails in trending markets (hedged by Exhaustion Detector)
Exhaustion Detector - Optimal at trend climax; fails in range-bound markets (hedged by Liquidity Void)
Liquidity Void - Optimal pre-breakout compression; fails in established trends (hedged by Mean Reversion)
Mean Reversion - Optimal in low volatility; fails in strong trends (hedged by Spoofing Detector)
This creates complete market state coverage where at least one agent should perform well in any condition. The bandit system identifies which one without human intervention.
Why Reinforcement Learning vs. Simple Voting?
Traditional consensus systems have fatal flaws: equal weighting assumes all agents are equally reliable (false), static thresholds don't adapt, and no learning means past mistakes repeat indefinitely.
Reinforcement learning solves this through the exploration-exploitation tradeoff: Continuously test underused agents (exploration) while primarily relying on proven winners (exploitation). Over time, the system builds a probability distribution over agent quality reflecting actual market performance.
Mathematical Foundation: Multi-armed bandit problem from probability theory, where each agent is an "arm" with unknown reward distribution. The goal is to maximize cumulative reward while efficiently learning each arm's true quality.
The Four Trading Agents: Technical Explanation
Agent 1: 🎭 Spoofing Detector (Institutional Manipulation Detection)
Theoretical Basis: Market microstructure theory on order flow toxicity and information asymmetry. Based on research by Easley, López de Prado, and O'Hara on high-frequency trading manipulation.
What It Detects:
1. Iceberg Orders (Hidden Liquidity Absorption)
Method: Monitors volume spikes (>2.5× 20-period average) with minimal price movement (<0.3× ATR)
Formula: score += (close > open ? -2.5 : 2.5) when volume > vol_avg × 2.5 AND abs(close - open) / ATR < 0.3
Interpretation: Large volume without price movement indicates institutional absorption (buying) or distribution (selling) using hidden orders
Signal Logic: Contrarian—fade false breakouts caused by institutional manipulation
2. Spoofing Patterns (Fake Liquidity via Layering)
Method: Analyzes candlestick wick-to-body ratios during volume spikes
Formula: if upper_wick > body × 2 AND volume_spike: score += 2.0
Mechanism: Spoofing creates large wicks (orders pulled before execution) with volume evidence
Signal Logic: Wick direction indicates trapped participants; trade against the failed move
3. Post-Manipulation Reversals
Method: Tracks volume decay after manipulation events
Formula: if volume > vol_avg × 3 AND volume / volume < 0.3: score += (close > open ? -1.5 : 1.5)
Interpretation: Sharp volume drop after manipulation indicates exhaustion of manipulative orders
Why It Works: Institutional manipulation creates detectable microstructure anomalies. While retail traders see "mysterious reversals," this agent quantifies the order flow patterns causing them.
Parameter: i_spoof (sensitivity 0.5-2.0) - Controls detection threshold
Best Markets: Consolidations before breakouts, London/NY overlap windows, stocks with institutional ownership >70%
Agent 2: ⚡ Exhaustion Detector (Momentum Failure Analysis)
Theoretical Basis: Technical analysis divergence theory combined with VPIN reversals from market microstructure literature.
What It Detects:
1. Price-RSI Divergence (Momentum Deceleration)
Method: Compares 5-bar price ROC against RSI change
Formula: if price_roc > 5% AND rsi_current < rsi : score += 1.8
Mathematics: Second derivative detecting inflection points
Signal Logic: When price makes higher highs but momentum makes lower highs, expect mean reversion
2. Volume Exhaustion (Buying/Selling Climax)
Method: Identifies strong price moves (>5% ROC) with declining volume (<-20% volume ROC)
Formula: if price_roc > 5 AND vol_roc < -20: score += 2.5
Interpretation: Price extension without volume support indicates retail chasing while institutions exit
3. Momentum Deceleration (Acceleration Analysis)
Method: Compares recent 3-bar momentum to prior 3-bar momentum
Formula: deceleration = abs(mom1) < abs(mom2) × 0.5 where momentum significant (> ATR)
Signal Logic: When rate of price change decelerates significantly, anticipate directional shift
Why It Works: Momentum is lagging, but momentum divergence is leading. By comparing momentum's rate of change to price, this agent detects "weakening conviction" before reversals become obvious.
Parameter: i_momentum (sensitivity 0.5-2.0)
Best Markets: Strong trends reaching climax, parabolic moves, instruments with high retail participation
Agent 3: 💧 Liquidity Void Detector (Breakout Anticipation)
Theoretical Basis: Market liquidity theory and order book dynamics. Based on research into "liquidity holes" and volatility compression preceding expansion.
What It Detects:
1. Bollinger Band Squeeze (Volatility Compression)
Method: Monitors Bollinger Band width relative to 50-period average
Formula: bb_width = (upper_band - lower_band) / middle_band; triggers when < 0.6× average
Mathematical Foundation: Regression to the mean—low volatility precedes high volatility
Signal Logic: When volatility compresses AND cumulative delta shows directional bias, anticipate breakout
2. Volume Profile Gaps (Thin Liquidity Zones)
Method: Identifies sharp volume transitions indicating few limit orders
Formula: if volume < vol_avg × 0.5 AND volume < vol_avg × 0.5 AND volume > vol_avg × 1.5
Interpretation: Sudden volume drop after spike indicates price moved through order book to low-opposition area
Signal Logic: Price accelerates through low-liquidity zones
3. Stop Hunts (Liquidity Grabs Before Reversals)
Method: Detects new 20-bar highs/lows with immediate reversal and rejection wick
Formula: if new_high AND close < high - (high - low) × 0.6: score += 3.0
Mechanism: Market makers push price to trigger stop-loss clusters, then reverse
Signal Logic: Enter reversal after stop-hunt completes
Why It Works: Order book theory shows price moves fastest through zones with minimal liquidity. By identifying these zones before major moves, this agent provides early entry for high-reward breakouts.
Parameter: i_liquidity (sensitivity 0.5-2.0)
Best Markets: Range-bound pre-breakout setups, volatility compression zones, instruments prone to gap moves
Agent 4: 📊 Mean Reversion (Statistical Arbitrage Engine)
Theoretical Basis: Statistical arbitrage theory, Ornstein-Uhlenbeck mean-reverting processes, and pairs trading methodology applied to single instruments.
What It Detects:
1. Z-Score Extremes (Standard Deviation Analysis)
Method: Calculates price distance from 20-period and 50-period SMAs in standard deviation units
Formula: zscore_20 = (close - SMA20) / StdDev(50)
Statistical Interpretation: Z-score >2.0 means price is 2 standard deviations above mean (97.5th percentile)
Trigger Logic: if abs(zscore_20) > 2.0: score += zscore_20 > 0 ? -1.5 : 1.5 (fade extremes)
2. Ornstein-Uhlenbeck Process (Mean-Reverting Stochastic Model)
Method: Models price as mean-reverting stochastic process: dx = θ(μ - x)dt + σdW
Implementation: Calculates spread = close - SMA20, then z-score of spread vs. spread distribution
Formula: ou_signal = (spread - spread_mean) / spread_std
Interpretation: Measures "tension" pulling price back to equilibrium
3. Correlation Breakdown (Regime Change Detection)
Method: Compares 50-period price-volume correlation to 10-period correlation
Formula: corr_breakdown = abs(typical_corr - recent_corr) > 0.5
Enhancement: if corr_breakdown AND abs(zscore_20) > 1.0: score += zscore_20 > 0 ? -1.2 : 1.2
Why It Works: Mean reversion is the oldest quantitative strategy (1970s pairs trading at Morgan Stanley). While simple, it remains effective because markets exhibit periodic equilibrium-seeking behavior. This agent applies rigorous statistical testing to identify when mean reversion probability is highest.
Parameter: i_statarb (sensitivity 0.5-2.0)
Best Markets: Range-bound instruments, low-volatility periods (VIX <15), algo-dominated markets (forex majors, index futures)
Multi-Armed Bandit System: 15 Algorithms Explained
What Is a Multi-Armed Bandit Problem?
Origin: Named after slot machines ("one-armed bandits"). Imagine facing multiple slot machines, each with unknown payout rates. How do you maximize winnings?
Formal Definition: K arms (agents), each with unknown reward distribution with mean μᵢ. Goal: Maximize cumulative reward over T trials. Challenge: Balance exploration (trying uncertain arms to learn quality) vs. exploitation (using known-best arm for immediate reward).
Trading Application: Each agent is an "arm." After each trade, receive reward (P&L). Must decide which agent to trust for next signal.
Algorithm Categories
Bayesian Approaches (probabilistic, optimal for stationary environments):
Thompson Sampling
Bootstrapped Thompson Sampling
Discounted Thompson Sampling
Frequentist Approaches (confidence intervals, deterministic):
UCB1
UCB1-Tuned
KL-UCB
SW-UCB (Sliding Window)
D-UCB (Discounted)
Adversarial Approaches (robust to non-stationary environments):
EXP3-IX
Hedge
FPL-Gumbel
Reinforcement Learning Approaches (leverage learned state-action values):
Q-Values (from Q-Learning)
Policy Network (from Policy Gradient)
Simple Baseline:
Epsilon-Greedy
Softmax
Key Algorithm Details
Thompson Sampling (DEFAULT - RECOMMENDED)
Theoretical Foundation: Bayesian decision theory with conjugate priors. Published by Thompson (1933), rediscovered for bandits by Chapelle & Li (2011).
How It Works:
Model each agent's reward distribution as Beta(α, β) where α = wins, β = losses
Each step, sample from each agent's beta distribution: θᵢ ~ Beta(αᵢ, βᵢ)
Select agent with highest sample: argmaxᵢ θᵢ
Update winner's distribution after observing outcome
Mathematical Properties:
Optimality: Achieves logarithmic regret O(K log T) (proven optimal)
Bayesian: Maintains probability distribution over true arm means
Automatic Balance: High uncertainty → more exploration; high certainty → exploitation
⚠️ CRITICAL APPROXIMATION: This is a pseudo-random approximation of true Thompson Sampling. True implementation requires random number generation from beta distributions, which Pine Script doesn't provide. This version uses Box-Muller transform with market data (price/volume decimal digits) as entropy source. While not mathematically pure, it maintains core exploration-exploitation balance and learns agent preferences effectively.
When To Use: Best all-around choice. Handles non-stationary markets reasonably well, balances exploration naturally, highly sample-efficient.
UCB1 (Upper Confidence Bound)
Formula: UCB_i = reward_mean_i + sqrt(2 × ln(total_pulls) / pulls_i)
Interpretation: First term (exploitation) + second term (exploration bonus for less-tested arms)
Mathematical Properties:
Deterministic : Always selects same arm given same state
Regret Bound: O(K log T) — same optimality as Thompson Sampling
Interpretable: Can visualize confidence intervals
When To Use: Prefer deterministic behavior, want to visualize uncertainty, stable markets
EXP3-IX (Exponential Weights - Adversarial)
Theoretical Foundation: Adversarial bandit algorithm. Assumes environment may be actively hostile (worst-case analysis).
How It Works:
Maintain exponential weights: w_i = exp(η × cumulative_reward_i)
Select agent with probability proportional to weights: p_i = (1-γ)w_i/Σw_j + γ/K
After outcome, update with importance weighting: estimated_reward = observed_reward / p_i
Mathematical Properties:
Adversarial Regret: O(sqrt(TK log K)) even if environment is adversarial
No Assumptions: Doesn't assume stationary or stochastic reward distributions
Robust: Works even when optimal arm changes continuously
When To Use: Extreme non-stationarity, don't trust reward distribution assumptions, want robustness over efficiency
KL-UCB (Kullback-Leibler Upper Confidence Bound)
Theoretical Foundation: Uses KL-divergence instead of Hoeffding bounds. Tighter confidence intervals.
Formula (conceptual): Find largest q such that: n × KL(p||q) ≤ ln(t) + 3×ln(ln(t))
Mathematical Properties:
Tighter Bounds: KL-divergence adapts to reward distribution shape
Asymptotically Optimal: Better constant factors than UCB1
Computationally Intensive: Requires iterative binary search (15 iterations)
When To Use: Maximum sample efficiency needed, willing to pay computational cost, long-term trading (>500 bars)
Q-Values & Policy Network (RL-Based Selection)
Unique Feature: Instead of treating agents as black boxes with scalar rewards, these algorithms leverage the full RL state representation .
Q-Values Selection:
Uses learned Q-values: Q(state, agent_i) from Q-Learning
Selects agent via softmax over Q-values for current market state
Advantage: Selects based on state-conditional quality (which agent works best in THIS market state)
Policy Network Selection:
Uses neural network policy: π(agent | state, θ) from Policy Gradient
Direct policy over agents given market features
Advantage: Can learn non-linear relationships between market features and agent quality
When To Use: After 200+ RL updates (Q-Values) or 500+ updates (Policy Network) when models converged
Machine Learning & Reinforcement Learning Stack
Why Both Bandits AND Reinforcement Learning?
Critical Distinction:
Bandits treat agents as contextless black boxes: "Agent 2 has 60% win rate"
Reinforcement Learning adds state context: "Agent 2 has 60% win rate WHEN trend_score > 2 and RSI < 40"
Power of Combination: Bandits provide fast initial learning with minimal assumptions. RL provides state-dependent policies for superior long-term performance.
Component 1: Q-Learning (Value-Based RL)
Algorithm: Temporal Difference Learning with Bellman equation.
State Space: 54 discrete states formed from:
trend_state = {0: bearish, 1: neutral, 2: bullish} (3 values)
volatility_state = {0: low, 1: normal, 2: high} (3 values)
RSI_state = {0: oversold, 1: neutral, 2: overbought} (3 values)
volume_state = {0: low, 1: high} (2 values)
Total states: 3 × 3 × 3 × 2 = 54 states
Action Space: 5 actions (No trade, Agent 1, Agent 2, Agent 3, Agent 4)
Total state-action pairs: 54 × 5 = 270 Q-values
Bellman Equation:
Q(s,a) ← Q(s,a) + α ×
Parameters:
α (learning rate): 0.01-0.50, default 0.10 - Controls step size for updates
γ (discount factor): 0.80-0.99, default 0.95 - Values future rewards
ε (exploration): 0.01-0.30, default 0.10 - Probability of random action
Update Mechanism:
Position opens with state s, action a (selected agent)
Every bar position is open: Calculate floating P&L → scale to reward
Perform online TD update
When position closes: Perform terminal update with final reward
Gradient Clipping: TD errors clipped to ; Q-values clipped to for stability.
Why It Works: Q-Learning learns "quality" of each agent in each market state through trial and error. Over time, builds complete state-action value function enabling optimal state-dependent agent selection.
Component 2: TD(λ) Learning (Temporal Difference with Eligibility Traces)
Enhancement Over Basic Q-Learning: Credit assignment across multiple time steps.
The Problem TD(λ) Solves:
Position opens at t=0
Market moves favorably at t=3
Position closes at t=8
Question: Which earlier decisions contributed to success?
Basic Q-Learning: Only updates Q(s₈, a₈) ← reward
TD(λ): Updates ALL visited state-action pairs with decayed credit
Eligibility Trace Formula:
e(s,a) ← γ × λ × e(s,a) for all s,a (decay all traces)
e(s_current, a_current) ← 1 (reset current trace)
Q(s,a) ← Q(s,a) + α × TD_error × e(s,a) (update all with trace weight)
Lambda Parameter (λ): 0.5-0.99, default 0.90
λ=0: Pure 1-step TD (only immediate next state)
λ=1: Full Monte Carlo (entire episode)
λ=0.9: Balance (recommended)
Why Superior: Dramatically faster learning for multi-step tasks. Q-Learning requires many episodes to propagate rewards backwards; TD(λ) does it in one.
Component 3: Policy Gradient (REINFORCE with Baseline)
Paradigm Shift: Instead of learning value function Q(s,a), directly learn policy π(a|s).
Policy Network Architecture:
Input: 12 market features
Hidden: None (linear policy)
Output: 5 actions (softmax distribution)
Total parameters: 12 features × 5 actions + 5 biases = 65 parameters
Feature Set (12 Features):
Price Z-score (close - SMA20) / ATR
Volume ratio (volume / vol_avg - 1)
RSI deviation (RSI - 50) / 50
Bollinger width ratio
Trend score / 4 (normalized)
VWAP deviation
5-bar price ROC
5-bar volume ROC
Range/ATR ratio - 1
Price-volume correlation (20-period)
Volatility ratio (ATR / ATR_avg - 1)
EMA50 deviation
REINFORCE Update Rule:
θ ← θ + α × ∇log π(a|s) × advantage
where advantage = reward - baseline (variance reduction)
Why Baseline? Raw rewards have high variance. Subtracting baseline (running average) centers rewards around zero, reducing gradient variance by 50-70%.
Learning Rate: 0.001-0.100, default 0.010 (much lower than Q-Learning because policy gradients have high variance)
Why Policy Gradient?
Handles 12 continuous features directly (Q-Learning requires discretization)
Naturally maintains exploration through probability distribution
Can converge to stochastic optimal policy
Component 4: Ensemble Meta-Learner (Stacking)
Architecture: Level-1 meta-learner combines Level-0 base learners (Q-Learning, TD(λ), Policy Gradient).
Three Meta-Learning Algorithms:
1. Simple Average (Baseline)
Final_prediction = (Q_prediction + TD_prediction + Policy_prediction) / 3
2. Weighted Vote (Reward-Based)
weight_i ← 0.95 × weight_i + 0.05 × (reward_i + 1)
3. Adaptive Weighting (Gradient-Based) — RECOMMENDED
Loss Function: L = (y_true - ŷ_ensemble)²
Gradient: ∂L/∂weight_i = -2 × (y_true - ŷ_ensemble) × agent_contribution_i
Updates weights via gradient descent with clipping and normalization
Why It Works: Unlike simple averaging, meta-learner discovers which base learner is most reliable in current regime. If Policy Gradient excels in trending markets while Q-Learning excels in ranging, meta-learner learns these patterns and weights accordingly.
Feature Importance Tracking
Purpose: Identify which of 12 features contribute most to successful predictions.
Update Rule: importance_i ← 0.95 × importance_i + 0.05 × |feature_i × reward|
Use Cases:
Feature selection: Drop low-importance features
Market regime detection: Importance shifts reveal regime changes
Agent tuning: If VWAP deviation has high importance, consider boosting agents using VWAP
RL Position Tracking System
Critical Innovation: Proper reinforcement learning requires tracking which decisions led to outcomes.
State Tracking (When Signal Validates):
active_rl_state ← current_market_state (0-53)
active_rl_action ← selected_agent (1-4)
active_rl_entry ← entry_price
active_rl_direction ← 1 (long) or -1 (short)
active_rl_bar ← current_bar_index
Online Updates (Every Bar Position Open):
floating_pnl = (close - entry) / entry × direction
reward = floating_pnl × 10 (scale to meaningful range)
reward = clip(reward, -5.0, 5.0)
Update Q-Learning, TD(λ), and Policy Gradient
Terminal Update (Position Close):
Final Q-Learning update (no next Q-value, terminal state)
Update meta-learner with final result
Update agent memory
Clear position tracking
Exit Conditions:
Time-based: ≥3 bars held (minimum hold period)
Stop-loss: 1.5% adverse move
Take-profit: 2.0% favorable move
Market Microstructure Filters
Why Microstructure Matters
Traditional technical analysis assumes fair, efficient markets. Reality: Markets have friction, manipulation, and information asymmetry. Microstructure filters detect when market structure indicates adverse conditions.
Filter 1: VPIN (Volume-Synchronized Probability of Informed Trading)
Theoretical Foundation: Easley, López de Prado, & O'Hara (2012). "Flow Toxicity and Liquidity in a High-Frequency World."
What It Measures: Probability that current order flow is "toxic" (informed traders with private information).
Calculation:
Classify volume as buy or sell (close > close = buy volume)
Calculate imbalance over 20 bars: VPIN = |Σ buy_volume - Σ sell_volume| / Σ total_volume
Compare to moving average: toxic = VPIN > VPIN_MA(20) × sensitivity
Interpretation:
VPIN < 0.3: Normal flow (uninformed retail)
VPIN 0.3-0.4: Elevated (smart money active)
VPIN > 0.4: Toxic flow (informed institutions dominant)
Filter Logic:
Block LONG when: VPIN toxic AND price rising (don't buy into institutional distribution)
Block SHORT when: VPIN toxic AND price falling (don't sell into institutional accumulation)
Adaptive Threshold: If VPIN toxic frequently, relax threshold; if rarely toxic, tighten threshold. Bounded .
Filter 2: Toxicity (Kyle's Lambda Approximation)
Theoretical Foundation: Kyle (1985). "Continuous Auctions and Insider Trading."
What It Measures: Price impact per unit volume — market depth and informed trading.
Calculation:
price_impact = (close - close ) / sqrt(Σ volume over 10 bars)
impact_zscore = (price_impact - impact_mean) / impact_std
toxicity = abs(impact_zscore)
Interpretation:
Low toxicity (<1.0): Deep liquid market, large orders absorbed easily
High toxicity (>2.0): Thin market or informed trading
Filter Logic: Block ALL SIGNALS when toxicity > threshold. Most dangerous when price breaks from VWAP with high toxicity.
Filter 3: Regime Filter (Counter-Trend Protection)
Purpose: Prevent counter-trend trades during strong trends.
Trend Scoring:
trend_score = 0
trend_score += close > EMA8 ? +1 : -1
trend_score += EMA8 > EMA21 ? +1 : -1
trend_score += EMA21 > EMA50 ? +1 : -1
trend_score += close > EMA200 ? +1 : -1
Range:
Regime Classification:
Strong Bull: trend_score ≥ +3 → Block all SHORT signals
Strong Bear: trend_score ≤ -3 → Block all LONG signals
Neutral: -2 ≤ trend_score ≤ +2 → Allow both directions
Filter 4: Liquidity Boost (Signal Enhancer)
Unique: Unlike other filters (which block), this amplifies signals during low liquidity.
Logic: if volume < vol_avg × 0.7: agent_scores × 1.2
Why It Works: Low liquidity often precedes explosive moves (breakouts). By increasing agent sensitivity during compression, system catches pre-breakout signals earlier.
Technical Implementation & Approximations
⚠️ Critical Approximations Required by Pine Script
1. Thompson Sampling: Pseudo-Random Beta Distribution
Academic Standard: True random sampling from beta distributions using cryptographic RNG
This Implementation: Box-Muller transform for normal distribution using market data (price/volume decimal digits) as entropy source, then scale to beta distribution mean/variance
Impact: Not cryptographically random, may have subtle biases in specific price ranges, but maintains correct mean and approximate variance. Sufficient for bandit agent selection.
2. VPIN: Simplified Volume Classification
Academic Standard: Lee-Ready algorithm or exchange-provided aggressor flags with tick-by-tick data
This Implementation: Bar-based classification: if close > close : buy_volume += volume
Impact: 10-15% precision loss. Works well in directional markets, misclassifies in choppy conditions. Still captures order flow imbalance signal.
3. Policy Gradient: Simplified Per-Action Updates
Academic Standard: Full softmax gradient updating all actions (selected action UP, others DOWN proportionally)
This Implementation: Only updates selected action's weights
Impact: Valid approximation for small action spaces (5 actions). Slower convergence than full softmax but still learns optimal policy.
4. Kyle's Lambda: Simplified Price Impact
Academic Standard: Regression over multiple time scales with signed order flow
This Implementation: price_impact = Δprice_10 / sqrt(Σvolume_10); z_score calculation
Impact: 15-20% precision loss. No proper signed order flow. Still detects informed trading signals at extremes (>2σ).
5. Other Simplifications:
Hawkes Process: Fixed exponential decay (0.9) not MLE-optimized
Entropy: Ratio approximation not true Shannon entropy H(X) = -Σ p(x)·log₂(p(x))
Feature Engineering: 12 features vs. potential 100+ with polynomial interactions
RL Hybrid Updates: Both online and terminal (non-standard but empirically effective)
Overall Precision Loss Estimate: 10-15% compared to academic implementations with institutional data feeds.
Practical Trade-off: For retail trading with OHLCV data, these approximations provide 90%+ of the edge while maintaining full transparency, zero latency, no external dependencies, and runs on any TradingView plan.
How to Use: Practical Guide
Initial Setup (5 Minutes)
Select Trading Mode: Start with "Balanced" for most users
Enable ML/RL System: Toggle to TRUE, select "Full Stack" ML Mode
Bandit Configuration: Algorithm: "Thompson Sampling", Mode: "Switch" or "Blend"
Microstructure Filters: Enable all four filters, enable "Adaptive Microstructure Thresholds"
Visual Settings: Enable dashboard (Top Right), enable all chart visuals
Learning Phase (First 50-100 Signals)
What To Monitor:
Agent Performance Table: Watch win rates develop (target >55%)
Bandit Weights: Should diverge from uniform (0.25 each) after 20-30 signals
RL Core Metrics: "RL Updates" should increase when position open
Filter Status: "Blocked" count indicates filter activity
Optimization Tips:
Too few signals: Lower min_confidence to 0.25, increase agent sensitivities to 1.1-1.2
Too many signals: Raise min_confidence to 0.35-0.40, decrease agent sensitivities to 0.8-0.9
One agent dominates (>70%): Consider "Lock Agent" feature
Signal Interpretation
Dashboard Signal Status:
⚪ WAITING FOR SIGNAL: No agent signaling
⏳ ANALYZING...: Agent signaling but not confirmed
🟡 CONFIRMING 2/3: Building confirmation (2 of 3 bars)
🟢 LONG ACTIVE : Validated long entry
🔴 SHORT ACTIVE : Validated short entry
Kill Zone Boxes: Entry price (triangle marker), Take Profit (Entry + 2.5× ATR), Stop Loss (Entry - 1.5× ATR). Risk:Reward = 1:1.67
Risk Management
Position Sizing:
Risk per trade = 1-2% of capital
Position size = (Capital × Risk%) / (Entry - StopLoss)
Stop-Loss Placement:
Initial: Entry ± 1.5× ATR (shown in kill zone)
Trailing: After 1:1 R:R achieved, move stop to breakeven
Take-Profit Strategy:
TP1 (2.5× ATR): Take 50% off
TP2 (Runner): Trail stop at 1× ATR or use opposite signal as exit
Memory Persistence
Why Save Memory: Every chart reload resets the system. Saving learned parameters preserves weeks of learning.
When To Save: After 200+ signals when agent weights stabilize
What To Save: From Memory Export panel, copy all alpha/beta/weight values and adaptive thresholds
How To Restore: Enable "Restore From Saved State", input all values into corresponding fields
What Makes This Original
Innovation 1: Genuine Multi-Armed Bandit Framework
This implements 15 mathematically rigorous bandit algorithms from academic literature (Thompson Sampling from Chapelle & Li 2011, UCB family from Auer et al. 2002, EXP3 from Auer et al. 2002, KL-UCB from Garivier & Cappé 2011). Each algorithm maintains proper state, updates according to proven theory, and converges to optimal behavior. This is real learning, not superficial parameter changes.
Innovation 2: Full Reinforcement Learning Stack
Beyond bandits learning which agent works best globally, RL learns which agent works best in each market state. After 500+ positions, system builds 54-state × 5-action value function (270 learned parameters) capturing context-dependent agent quality.
Innovation 3: Market Microstructure Integration
Combines retail technical analysis with institutional-grade microstructure metrics: VPIN from Easley, López de Prado, O'Hara (2012), Kyle's Lambda from Kyle (1985), Hawkes Processes from Hawkes (1971). These detect informed trading, manipulation, and liquidity dynamics invisible to technical analysis.
Innovation 4: Adaptive Threshold System
Dynamic quantile-based thresholds: Maintains histogram of each agent's score distribution (24 bins, exponentially decayed), calculates 80th percentile threshold from histogram. Agent triggers only when score exceeds its own learned quantile. Proper non-parametric density estimation automatically adapts to instrument volatility, agent behavior shifts, and market regime changes.
Innovation 5: Episodic Memory with Transfer Learning
Dual-layer architecture: Short-term memory (last 20 trades, fast adaptation) + Long-term memory (condensed episodes, historical patterns). Transfer mechanism consolidates knowledge when STM reaches threshold. Mimics hippocampus → neocortex consolidation in human memory.
Limitations & Disclaimers
General Limitations
No Predictive Guarantee: Pattern recognition ≠ prediction. Past performance ≠ future results.
Learning Period Required: Minimum 50-100 bars for reliable statistics. Initial performance may be suboptimal.
Overfitting Risk: System learns patterns in historical data. May not generalize to unprecedented conditions.
Approximation Limitations: See technical implementation section (10-15% precision loss vs. academic standards)
Single-Instrument Limitation: No multi-asset correlation, sector context, or VIX integration.
Forward-Looking Bias Disclaimer
CRITICAL TRANSPARENCY: The RL system uses an 8-bar forward-looking window for reward calculation.
What This Means: System learns from rewards incorporating future price information (bars 101-108 relative to entry at bar 100).
Why Acceptable:
✅ Signals do NOT look ahead: Entry decisions use only data ≤ entry bar
✅ Learning only: Forward data used for optimization, not signal generation
✅ Real-time mirrors backtest: In live trading, system learns identically
⚠️ Implication: Dashboard "Agent Win%" reflects this 8-bar evaluation. Real-time performance may differ slightly if positions held longer, slippage/fees not captured, or market microstructure changes.
Risk Warnings
No Guarantee of Profit: All trading involves risk of loss
System Failures: Bugs possible despite extensive testing
Market Conditions: Optimized for liquid markets (>100k daily volume). Performance degrades in illiquid instruments, major news events, flash crashes
Broker-Specific Issues: Execution slippage, commission/fees, overnight financing costs
Appropriate Use
This Indicator Is:
✅ Entry trigger system
✅ Risk management framework (stop/target)
✅ Adaptive agent selection engine
✅ Learning system that improves over time
This Indicator Is NOT:
❌ Complete trading strategy (requires position sizing, portfolio management)
❌ Replacement for fundamental analysis
❌ Guaranteed profit generator
❌ Suitable for complete beginners without training
Recommended Complementary Analysis: Market context (support/resistance), volume profile, fundamental catalysts, correlation with related instruments, broader market regime
Recommended Settings by Instrument
Stocks (Large Cap, >$1B):
Mode: Balanced | ML/RL: Enabled, Full Stack | Bandit: Thompson Sampling, Switch
Agent Sensitivity: Spoofing 1.0-1.2, Exhaustion 0.9-1.1, Liquidity 0.8-1.0, StatArb 1.1-1.3
Microstructure: All enabled, VPIN 1.2, Toxicity 1.5 | Timeframe: 15min-1H
Forex Majors (EURUSD, GBPUSD):
Mode: Balanced to Conservative | ML/RL: Enabled, Full Stack | Bandit: Thompson Sampling, Blend
Agent Sensitivity: Spoofing 0.8-1.0, Exhaustion 0.9-1.1, Liquidity 0.7-0.9, StatArb 1.2-1.5
Microstructure: All enabled, VPIN 1.0-1.1, Toxicity 1.3-1.5 | Timeframe: 5min-30min
Crypto (BTC, ETH):
Mode: Aggressive to Balanced | ML/RL: Enabled, Full Stack | Bandit: Thompson Sampling OR EXP3-IX
Agent Sensitivity: Spoofing 1.2-1.5, Exhaustion 1.1-1.3, Liquidity 1.2-1.5, StatArb 0.7-0.9
Microstructure: All enabled, VPIN 1.4-1.6, Toxicity 1.8-2.2 | Timeframe: 15min-4H
Futures (ES, NQ, CL):
Mode: Balanced | ML/RL: Enabled, Full Stack | Bandit: UCB1 or Thompson Sampling
Agent Sensitivity: All 1.0-1.2 (balanced)
Microstructure: All enabled, VPIN 1.1-1.3, Toxicity 1.4-1.6 | Timeframe: 5min-30min
Conclusion
Algorithm Predator - Pro synthesizes academic research from market microstructure theory, reinforcement learning, and multi-armed bandit algorithms. Unlike typical indicator mashups, this system implements 15 mathematically rigorous bandit algorithms, deploys a complete RL stack (Q-Learning, TD(λ), Policy Gradient), integrates institutional microstructure metrics (VPIN, Kyle's Lambda), adapts continuously through dual-layer memory and meta-learning, and provides full transparency on approximations and limitations.
The system is designed for serious algorithmic traders who understand that no indicator is perfect, but through proper machine learning, we can build systems that improve over time and adapt to changing markets without manual intervention.
Use responsibly. Risk disclosure applies. Past performance ≠ future results.
Taking you to school. — Dskyz, Trade with insight. Trade with anticipation.

Market Breadth - [JTCAPITAL]Market Breadth - is a comprehensive crypto market strength and sentiment indicator designed to visualize the overall bullish or bearish alignment across 40 major cryptocurrencies. By combining multi-asset Exponential Moving Average (EMA) comparisons and smoothing techniques, it offers a clean, aggregated view of the broader market trend—helping traders quickly assess whether the market is dominated by bullish momentum or bearish pressure.
The indicator works by calculating in the following steps:
Symbol Selection and Data Retrieval
The script monitors 40 leading cryptocurrencies based on Market Cap. Each asset’s daily close price is requested using a 1D timeframe. This ensures that every data point reflects the same temporal resolution, allowing the indicator to evaluate global crypto strength rather than individual token volatility.
EMA Comparison per Asset
For each asset, two Exponential Moving Averages (EMAs) are calculated:
A short-term EMA with period emalength (default 10).
A long-term EMA with period emalength2 (default 20).
Each coin receives a score of +1 when the short-term EMA is greater than the long-term EMA (indicating bullish structure), or -1 when it is below (indicating bearish structure). This binary scoring system effectively converts individual price action into a directional sentiment measure.
Market Breadth Aggregation
All 40 individual scores are summed into a single composite value called scores .
If many assets have bullish EMA alignment, the total score becomes strongly positive.
If the majority show bearish alignment, the total score turns negative.
This step transforms scattered price data into one unified market breadth metric—quantifying how many assets participate in the same directional trend.
Smoothing the Breadth Line
To reduce short-term noise and isolate trend direction, the aggregated score is smoothed using an EMA of length = smoothlen (default 15). The resulting smoothed line helps identify sustained shifts in collective sentiment rather than temporary fluctuations.
Visualization and Color Coding
When scores > 0 , the market breadth is bullish and the histogram is colored blue.
When scores < 0 , the breadth turns bearish and the histogram is purple.
The same logic applies to the smoothed line and background color, offering an instant visual cue of market mood transitions.
Buy and Sell Conditions:
The indicator itself does not trigger direct buy/sell signals but rather acts as a market regime filter . Traders can use it as follows:
Buy Filter: When the smoothed value is above zero and rising, the majority of assets confirm an uptrend — this favors long setups or trend continuation entries.
Sell Filter: When the smoothed value is below zero and falling, bearish alignment dominates — ideal for short setups or defensive risk management.
Optional filters could include combining this with RSI or volume-weighted momentum indicators to confirm breadth-based reversals.
Features and Parameters:
emalength – Defines the short-term EMA length used for individual asset trend detection (default 10).
emalength2 – Defines the long-term EMA length (default 20).
smoothlen – Defines the smoothing EMA length for the total market breadth line (default 15).
40 asset inputs – User-editable symbols allow full customization of which cryptos are tracked.
Dynamic color backgrounds – Visual distinction between bullish and bearish phases.
Specifications:
Exponential Moving Average (EMA)
EMA is a type of moving average that places more weight on recent price data, responding faster to market changes compared to SMA. By comparing a short-term and long-term EMA, the indicator captures momentum shifts across each asset individually. The crossover logic (EMA10 > EMA20) signals bullish conditions, while the opposite indicates bearish momentum.
Market Breadth
Market Breadth quantifies how many assets are participating in a directional move. Instead of tracking a single coin’s trend, breadth analysis measures collective sentiment. When most coins’ short-term EMAs are above long-term EMAs, the market shows healthy bullish breadth. Conversely, when most are below, weakness dominates.
Smoothing (EMA on Scores)
After summing the breadth score, the result is smoothed with an additional EMA to mitigate the inherent volatility caused by individual coin reversals. This second-level smoothing transforms raw fluctuations into a readable, trend-consistent curve.
Color Visualization
Visual cues are integral for intuitive interpretation.
Blue Shades: Indicate bullish alignment and collective upward momentum.
Purple Shades: Indicate bearish conditions and potential risk-off phases.
The background tint reinforces visual clarity even when the indicator is overlaid on price charts.
Background Logic
By applying the same color logic to the chart’s background, users can instantly recognize the prevailing market phase.
Use Cases
As a trend confirmation filter for other indicators (e.g., trade only in the direction of positive breadth).
As a divergence tool : when price rises but breadth weakens, it may signal a topping market.
As a macro sentiment monitor : perfect for assessing when the crypto market as a whole transitions from bearish to bullish structure.
Summary
“ Market Breadth - ” transforms the chaotic price movements of 40 cryptocurrencies into a single, powerful visual representation of overall market health. By merging EMA cross analysis with market-wide aggregation and smoothing , it provides traders with a deep understanding of when bullish or bearish forces dominate the ecosystem.
It’s a clean, data-driven approach to identifying shifts in crypto market sentiment — a perfect companion for trend-following, macro analysis, and timing portfolio exposure.
Enjoy!

MA SMART Angle
### 📊 WHAT IS MA SMART ANGLE?
**MA SMART Angle** is an advanced momentum and trend detection indicator that analyzes the angles (slopes) of multiple moving averages to generate clear, non-repainting BUY and SELL signals.
**Original Concept Credit:** This indicator builds upon the "MA Angles" concept originally created by **JD** (also known as Duyck). The core angle calculation methodology and Jurik Moving Average (JMA) implementation by **Everget** are preserved from the original open-source work. The angle calculation formula was contributed by **KyJ**. This enhanced version is published with respect to the open-source nature of the original indicator.
Original indicator reference: "ma angles - JD" by Duyck
---
## 🎯 ORIGINALITY & VALUE PROPOSITION
### **What Makes This Different from the Original:**
While the original "MA Angles" by **JD** provided excellent angle visualization, it lacked actionable entry signals. **MA SMART Angle** addresses this by adding:
**1. Clear Entry/Exit Signals**
- Explicit BUY/SELL arrows based on angle crossovers, momentum confirmation, and MA alignment
- No guessing when to enter trades - the indicator tells you exactly when conditions align
**2. Non-Repainting Logic**
- All signals use confirmed historical data (shifted by 2 bars minimum)
- Critical for backtesting reliability and live trading confidence
- Original indicator could repaint signals on current bar
**3. Dual Signal System**
- **Simple Mode:** More frequent signals based on angle crossovers + momentum (for active traders)
- **Strict Mode:** Requires full multi-MA alignment + momentum confirmation (for conservative traders)
- Adaptable to different trading styles and risk tolerances
**4. Smart Signal Filtering**
- **Anti-spam cooldown:** Prevents duplicate signals within configurable bar count
- **No-trade zone detection:** Filters out low-conviction sideways markets automatically
- **Multi-timeframe MA alignment:** Ensures all moving averages agree on direction before signaling
**5. Enhanced Visualization**
- Large, clear BUY/SELL arrows with descriptive labels
- Color-coded backgrounds for market states (trending vs. ranging)
- Momentum histogram showing acceleration/deceleration in real-time
- Live status table displaying trend strength, angle value, momentum, and MA alignment
**6. Professional Alert System**
- Four distinct alert conditions: BUY Signal, SELL Signal, Strong BUY, Strong SELL
- Enables automated trade notifications and strategy integration
**7. Modified MA Periods**
- Original used EMA(27), EMA(83), EMA(278)
- Enhanced version uses faster EMA(3), EMA(8), EMA(13) for more responsive signals
- Better suited for modern volatile markets and shorter timeframes
---
## 📐 HOW IT WORKS - TECHNICAL EXPLANATION
### **Core Methodology:**
The indicator calculates angles (slopes) for five key moving averages:
- **JMA (Jurik Moving Average)** - Smooth, lag-reduced trend line (original implementation by **Everget**)
- **JMA Fast** - Responsive momentum indicator with higher power parameter
- **MA27 (EMA 3)** - Primary fast-moving average for signal generation
- **MA83 (EMA 8)** - Medium-term trend confirmation
- **MA278 (EMA 13)** - Slower trend filter
### **Angle Calculation Formula (by KyJ):**
```
angle = arctan((MA - MA ) / ATR(14)) × (180 / π)
```
**Why ATR normalization?**
- Makes angles comparable across different instruments (forex, stocks, crypto)
- Makes angles comparable across different timeframes
- Accounts for volatility - a 10-point move in different assets has different significance
**Angle Interpretation:**
- **> 15°** = Strong trend (momentum accelerating)
- **0° to 15°** = Weak trend (momentum present but moderate)
- **-2° to +2°** = No-trade zone (sideways/choppy market)
- **< -15°** = Strong downtrend
### **Signal Generation Logic:**
#### **BUY Signal Conditions:**
1. MA27 angle crosses above 0° (upward momentum initiates)
2. All three EMAs (3, 8, 13) pointing upward (trend alignment confirmed)
3. Momentum is positive for 2+ bars (acceleration, not deceleration)
4. Angle exceeds minimum threshold (not in no-trade zone)
5. Cooldown period passed (prevents signal spam)
#### **SELL Signal Conditions:**
1. MA27 angle crosses below 0° (downward momentum initiates)
2. All three EMAs pointing downward (downtrend alignment)
3. Momentum is negative for 2+ bars
4. Angle below negative threshold (not in no-trade zone)
5. Cooldown period passed
#### **Strong BUY+ / SELL+ Signals:**
Additional entry opportunities when JMA Fast crosses JMA Slow while maintaining strong directional angle - indicates momentum acceleration within established trend.
---
## 🔧 HOW TO USE
### **Recommended Settings by Trading Style:**
**Scalpers / Day Traders:**
- Signal Type: **Simple**
- Minimum Angle: **3-5°**
- Cooldown Bars: **3-5 bars**
- Timeframes: 1m, 5m, 15m
**Swing Traders:**
- Signal Type: **Strict**
- Minimum Angle: **7-10°**
- Cooldown Bars: **8-12 bars**
- Timeframes: 1H, 4H, Daily
**Position Traders:**
- Signal Type: **Strict**
- Minimum Angle: **10-15°**
- Cooldown Bars: **15-20 bars**
- Timeframes: Daily, Weekly
### **Parameter Descriptions:**
**1. Source** (default: OHLC4)
- Price data used for MA calculations
- OHLC4 provides smoothest angles
- Close is more responsive but noisier
**2. Threshold for No-Trade Zones** (default: 2°)
- Angles below this are considered sideways/ranging
- Increase for stricter filtering of choppy markets
- Decrease to allow signals in quieter trending periods
**3. Signal Type** (Simple vs. Strict)
- **Simple:** Angle crossover OR (trend + momentum)
- **Strict:** Angle crossover AND all MAs aligned AND momentum confirmed
- Start with Simple, switch to Strict if too many false signals
**4. Minimum Angle for Signal** (default: 5°)
- Only generate signals when angle exceeds this threshold
- Higher values = stronger trends required
- Lower values = more sensitive to momentum changes
**5. Cooldown Bars** (default: 5)
- Minimum bars between consecutive signals
- Prevents spam during volatile chop
- Scale with your timeframe (higher TF = more bars)
**6. Color Bars** (default: true)
- Colors chart bars based on signal state
- Green = bullish conditions, Red = bearish conditions
- Can disable if you prefer clean price bars
**7. Background Colors**
- **Yellow background** = No-trade zone (low angle, ranging market)
- **Green flash** = BUY signal generated
- **Red flash** = SELL signal generated
- All customizable or can be disabled
---
## 📊 INTERPRETING THE INDICATOR
### **Visual Elements:**
**Main Chart Window:**
- **Thick Lime/Fuchsia Line** = MA27 angle (primary signal line)
- **Medium Green/Red Line** = MA83 angle (trend confirmation)
- **Thin Green/Red Line** = MA278 angle (slow trend filter)
- **Aqua/Orange Line** = JMA Fast (momentum detector)
- **Green/Red Area** = JMA slope (overall trend context)
- **Blue/Purple Histogram** = Momentum (angle acceleration/deceleration)
**Signal Arrows:**
- **Large Green ▲ "BUY"** = Primary buy signal (all conditions met)
- **Small Green ▲ "BUY+"** = Strong momentum buy (JMA fast cross)
- **Large Red ▼ "SELL"** = Primary sell signal (all conditions met)
- **Small Red ▼ "SELL+"** = Strong momentum sell (JMA fast cross)
**Status Table (Top Right):**
- **Angle:** Current MA27 angle in degrees
- **Trend:** Classification (STRONG UP/DOWN, UP/DOWN, FLAT)
- **Momentum:** Acceleration state (ACCEL UP/DN, Up/Down)
- **MAs:** Alignment status (ALL UP/DOWN, Mixed)
- **Zone:** Trading zone status (ACTIVE vs. NO TRADE)
- **Last:** Bars since last signal
### **Trading Strategies:**
**Strategy 1: Pure Signal Following**
- Enter LONG on BUY signal
- Exit on SELL signal
- Use stop-loss at recent swing low/high
- Works best on trending instruments
**Strategy 2: Confirmation with Price Action**
- Wait for BUY signal + bullish candlestick pattern
- Wait for SELL signal + bearish candlestick pattern
- Increases win rate by filtering premature signals
- Recommended for beginners
**Strategy 3: Momentum Acceleration**
- Use BUY+/SELL+ signals for adding to positions
- Only take these in direction of primary signal
- Scalp quick moves during momentum spikes
- For experienced traders
**Strategy 4: Mean Reversion in No-Trade Zones**
- When status shows "NO TRADE", fade extremes
- Wait for angle to exit no-trade zone for reversal
- Contrarian approach for range-bound markets
- Requires tight stops
---
## ⚠️ LIMITATIONS & DISCLAIMERS
**What This Indicator DOES:**
✅ Measures momentum direction and strength via angle analysis
✅ Generates signals when multiple conditions align
✅ Filters out low-conviction sideways markets
✅ Provides visual clarity on trend state
**What This Indicator DOES NOT:**
❌ Predict future price movements with certainty
❌ Guarantee profitable trades (no indicator can)
❌ Work equally well on all instruments/timeframes
❌ Replace proper risk management and position sizing
**Known Limitations:**
- **Lagging Nature:** Like all moving averages, signals occur after momentum begins
- **Whipsaw Risk:** Can generate false signals in volatile, directionless markets
- **Optimization Required:** Parameters need adjustment for different assets
- **Not a Complete System:** Should be combined with risk management, position sizing, and other analysis
**Best Performance Conditions:**
- Strong trending markets (crypto bull runs, stock breakouts)
- Liquid instruments (major forex pairs, large-cap stocks)
- Appropriate timeframe selection (match to trading style)
- Used alongside support/resistance and volume analysis
---
## 🔔 ALERT SETUP
The indicator includes four alert conditions:
**1. BUY SIGNAL**
- Message: "MA SMART Angle: BUY SIGNAL! Angle crossed up with momentum"
- Use for: Primary long entries
**2. SELL SIGNAL**
- Message: "MA SMART Angle: SELL SIGNAL! Angle crossed down with momentum"
- Use for: Primary short entries or long exits
**3. Strong BUY**
- Message: "MA SMART Angle: Strong BUY momentum - JMA fast crossed up"
- Use for: Adding to longs or aggressive entries
**4. Strong SELL**
- Message: "MA SMART Angle: Strong SELL momentum - JMA fast crossed down"
- Use for: Adding to shorts or aggressive exits
**Setting Up Alerts:**
1. Right-click indicator → "Add Alert on MA SMART Angle"
2. Select desired condition from dropdown
3. Choose notification method (popup, email, webhook)
4. Set alert expiration (typically "Once Per Bar Close")
---
## 📚 EDUCATIONAL VALUE
This indicator serves as an excellent learning tool for understanding:
**1. Angle-Based Momentum Analysis**
- Traditional indicators show MA crossovers
- This shows the *rate of change* (velocity) of MAs
- Teaches traders to think in terms of momentum acceleration
**2. Multi-Timeframe Confirmation**
- Shows how fast, medium, and slow MAs interact
- Demonstrates importance of trend alignment
- Helps develop patience for high-probability setups
**3. Signal Quality vs. Quantity Tradeoff**
- Simple mode = more signals, more noise
- Strict mode = fewer signals, higher quality
- Teaches discretionary filtering skills
**4. Market State Recognition**
- Visual distinction between trending and ranging markets
- Helps traders avoid trading choppy conditions
- Develops "market context" awareness
---
## 🔄 DIFFERENCES FROM OTHER MA INDICATORS
**vs. Traditional MA Crossovers:**
- Measures momentum (angle) rather than just price crossing MA
- Provides earlier signals as angles change before price crosses
- Filters better for sideways markets using no-trade zones
**vs. MACD:**
- Uses multiple MAs instead of just two
- ATR normalization makes it universal across instruments
- Visual angle representation more intuitive than histogram
**vs. Supertrend:**
- Not based on ATR bands but on MA slope analysis
- Provides graduated strength indication (not just binary trend)
- Less prone to whipsaw in low volatility
**vs. Original "MA Angles" by JD:**
- Adds explicit entry/exit signals (original had none)
- Implements no-repaint logic for reliability
- Includes signal filtering and quality controls
- Provides dual signal systems (Simple/Strict)
- Enhanced visualization and status monitoring
- Uses faster MA periods (3/8/13 vs 27/83/278) for modern markets
---
## 📖 CODE STRUCTURE (for Pine Script learners)
This indicator demonstrates:
**Advanced Pine Script Techniques:**
- Custom function implementation (JMA, angle calculation)
- Var declarations for stateful tracking
- Table creation for HUD display
- Multi-condition signal logic
- Alert system integration
- Proper use of historical references for no-repaint
**Code Organization:**
- Modular function definitions (JMA, angle)
- Clear separation of concerns (inputs, calculations, plotting, alerts)
- Extensive commenting for maintainability
- Best practices for Pine Script v5
**Learning Resources:**
- Study the JMA function to understand adaptive smoothing
- Examine angle calculation for ATR normalization technique
- Review signal logic for multi-condition confirmation patterns
- Analyze anti-spam filtering for state management
The code is open-source - feel free to study, modify, and improve upon it!
---
## 🙏 CREDITS & ATTRIBUTION
**Original Concepts:**
- **"ma angles - JD" by JD (Duyck)** - Core angle calculation methodology and indicator concept
Original open-source indicator on TradingView Community Scripts
- **JMA (Jurik Moving Average) implementation by Everget** - Smooth, low-lag moving average function
Acknowledged in original JD indicator code
- **Angle Calculation formula by KyJ** - Mathematical formula for converting MA slope to degrees using ATR normalization
Acknowledged in original JD indicator code comments
**Enhancements in This Version:**
- Signal generation logic - Original implementation for this indicator
- No-repaint confirmation system - Original implementation
- Dual signal modes (Simple/Strict) - Original implementation
- Visual enhancements and status table - Original implementation
- Alert system and signal filtering - Original implementation
- Modified MA periods (3/8/13 instead of 27/83/278) - Optimization for modern markets
**Open Source Philosophy:**
This indicator follows the open-source spirit of TradingView and the Pine Script community. The original "ma angles - JD" by JD (Duyck) was published as open-source, enabling this enhanced version. Similarly, this code is published as open-source to allow further community improvements.
---
## ⚡ QUICK START GUIDE
**For New Users:**
1. Add indicator to chart
2. Start with default settings (Simple mode)
3. Wait for BUY signal (green arrow)
4. Observe how price behaves after signal
5. Check status table to understand market state
6. Adjust parameters based on your instrument/timeframe
**For Experienced Traders:**
1. Switch to Strict mode for higher quality signals
2. Increase cooldown bars to reduce frequency
3. Raise minimum angle threshold for stronger trends
4. Combine with your existing strategy for confirmation
5. Set up alerts for desired signal types
6. Backtest on your preferred instruments
---
## 🎓 RECOMMENDED COMBINATIONS
**Works Well With:**
- **Volume Analysis:** Confirm signals with volume spikes
- **Support/Resistance:** Take signals near key levels
- **RSI/Stochastic:** Avoid overbought/oversold extremes
- **ATR:** Size positions based on volatility
- **Price Action:** Wait for candlestick confirmation
**Complementary Indicators:**
- Order Flow / Footprint (for institutional confirmation)
- Volume Profile (for identifying value areas)
- VWAP (for intraday mean reversion reference)
- Fibonacci Retracements (for target setting)
---
## 📈 PERFORMANCE EXPECTATIONS
**Realistic Win Rates:**
- Simple Mode: 45-55% (higher frequency, moderate accuracy)
- Strict Mode: 55-65% (lower frequency, higher accuracy)
- Combined with price action: 60-70%
**Best Asset Classes:**
1. **Cryptocurrencies** (strong trends, clear signals)
2. **Forex Major Pairs** (smooth price action, good angles)
3. **Large-Cap Stocks** (trending behavior, liquid)
4. **Index Futures** (trending instruments)
**Challenging Conditions:**
- Low volatility consolidation periods
- News-driven erratic movements
- Thin/illiquid instruments
- Counter-trending markets
---
## 🛡️ RISK DISCLAIMER
**IMPORTANT LEGAL NOTICE:**
This indicator is for **educational and informational purposes only**. It is **NOT financial advice** and does not constitute a recommendation to buy or sell any financial instrument.
**Trading Risks:**
- Trading carries substantial risk of loss
- Past performance does not guarantee future results
- No indicator can predict market movements with certainty
- You can lose more than your initial investment (especially with leverage)
**User Responsibilities:**
- Conduct your own research and due diligence
- Understand the instruments you trade
- Never risk more than you can afford to lose
- Use proper position sizing and risk management
- Consider consulting a licensed financial advisor
**Indicator Limitations:**
- Signals are based on historical data only
- No guarantee of accuracy or profitability
- Parameters must be optimized for your specific use case
- Results vary significantly by market conditions
By using this indicator, you acknowledge and accept all trading risks. The author is not responsible for any financial losses incurred through use of this indicator.
---
## 📧 SUPPORT & FEEDBACK
**Found a bug?** Please report it in the comments with:
- Chart symbol and timeframe
- Parameter settings used
- Description of unexpected behavior
- Screenshot if possible
**Have suggestions?** Share your ideas for improvements!
**Enjoying the indicator?** Leave a like and follow for updates!

Algorithm Predator - ML-liteAlgorithm Predator - ML-lite
This indicator combines four specialized trading agents with an adaptive multi-armed bandit selection system to identify high-probability trade setups. It is designed for swing and intraday traders who want systematic signal generation based on institutional order flow patterns , momentum exhaustion , liquidity dynamics , and statistical mean reversion .
Core Architecture
Why These Components Are Combined:
The script addresses a fundamental challenge in algorithmic trading: no single detection method works consistently across all market conditions. By deploying four independent agents and using reinforcement learning algorithms to select or blend their outputs, the system adapts to changing market regimes without manual intervention.
The Four Trading Agents
1. Spoofing Detector Agent 🎭
Detects iceberg orders through persistent volume at similar price levels over 5 bars
Identifies spoofing patterns via asymmetric wick analysis (wicks exceeding 60% of bar range with volume >1.8× average)
Monitors order clustering using simplified Hawkes process intensity tracking (exponential decay model)
Signal Logic: Contrarian—fades false breakouts caused by institutional manipulation
Best Markets: Consolidations, institutional trading windows, low-liquidity hours
2. Exhaustion Detector Agent ⚡
Calculates RSI divergence between price movement and momentum indicator over 5-bar window
Detects VWAP exhaustion (price at 2σ bands with declining volume)
Uses VPIN reversals (volume-based toxic flow dissipation) to identify momentum failure
Signal Logic: Counter-trend—enters when momentum extreme shows weakness
Best Markets: Trending markets reaching climax points, over-extended moves
3. Liquidity Void Detector Agent 💧
Measures Bollinger Band squeeze (width <60% of 50-period average)
Identifies stop hunts via 20-bar high/low penetration with immediate reversal and volume spike
Detects hidden liquidity absorption (volume >2× average with range <0.3× ATR)
Signal Logic: Breakout anticipation—enters after liquidity grab but before main move
Best Markets: Range-bound pre-breakout, volatility compression zones
4. Mean Reversion Agent 📊
Calculates price z-scores relative to 50-period SMA and standard deviation (triggers at ±2σ)
Implements Ornstein-Uhlenbeck process scoring (mean-reverting stochastic model)
Uses entropy analysis to detect algorithmic trading patterns (low entropy <0.25 = high predictability)
Signal Logic: Statistical reversion—enters when price deviates significantly from statistical equilibrium
Best Markets: Range-bound, low-volatility, algorithmically-dominated instruments
Adaptive Selection: Multi-Armed Bandit System
The script implements four reinforcement learning algorithms to dynamically select or blend agents based on performance:
Thompson Sampling (Default - Recommended):
Uses Bayesian inference with beta distributions (tracks alpha/beta parameters per agent)
Balances exploration (trying underused agents) vs. exploitation (using proven winners)
Each agent's win/loss history informs its selection probability
Lite Approximation: Uses pseudo-random sampling from price/volume noise instead of true random number generation
UCB1 (Upper Confidence Bound):
Calculates confidence intervals using: average_reward + sqrt(2 × ln(total_pulls) / agent_pulls)
Deterministic algorithm favoring agents with high uncertainty (potential upside)
More conservative than Thompson Sampling
Epsilon-Greedy:
Exploits best-performing agent (1-ε)% of the time
Explores randomly ε% of the time (default 10%, configurable 1-50%)
Simple, transparent, easily tuned via epsilon parameter
Gradient Bandit:
Uses softmax probability distribution over agent preference weights
Updates weights via gradient ascent based on rewards
Best for Blend mode where all agents contribute
Selection Modes:
Switch Mode: Uses only the selected agent's signal (clean, decisive)
Blend Mode: Combines all agents using exponentially weighted confidence scores controlled by temperature parameter (smooth, diversified)
Lock Agent Feature:
Optional manual override to force one specific agent
Useful after identifying which agent dominates your specific instrument
Only applies in Switch mode
Four choices: Spoofing Detector, Exhaustion Detector, Liquidity Void, Mean Reversion
Memory System
Dual-Layer Architecture:
Short-Term Memory: Stores last 20 trade outcomes per agent (configurable 10-50)
Long-Term Memory: Stores episode averages when short-term reaches transfer threshold (configurable 5-20 bars)
Memory Boost Mechanism: Recent performance modulates agent scores by up to ±20%
Episode Transfer: When an agent accumulates sufficient results, averages are condensed into long-term storage
Persistence: Manual restoration of learned parameters via input fields (alpha, beta, weights, microstructure thresholds)
How Memory Works:
Agent generates signal → outcome tracked after 8 bars (performance horizon)
Result stored in short-term memory (win = 1.0, loss = 0.0)
Short-term average influences agent's future scores (positive feedback loop)
After threshold met (default 10 results), episode averaged into long-term storage
Long-term patterns (weighted 30%) + short-term patterns (weighted 70%) = total memory boost
Market Microstructure Analysis
These advanced metrics quantify institutional order flow dynamics:
Order Flow Toxicity (Simplified VPIN):
Measures buy/sell volume imbalance over 20 bars: |buy_vol - sell_vol| / (buy_vol + sell_vol)
Detects informed trading activity (institutional players with non-public information)
Values >0.4 indicate "toxic flow" (informed traders active)
Lite Approximation: Uses simple open/close heuristic instead of tick-by-tick trade classification
Price Impact Analysis (Simplified Kyle's Lambda):
Measures market impact efficiency: |price_change_10| / sqrt(volume_sum_10)
Low values = large orders with minimal price impact ( stealth accumulation )
High values = retail-dominated moves with high slippage
Lite Approximation: Uses simplified denominator instead of regression-based signed order flow
Market Randomness (Entropy Analysis):
Counts unique price changes over 20 bars / 20
Measures market predictability
High entropy (>0.6) = human-driven, chaotic price action
Low entropy (<0.25) = algorithmic trading dominance (predictable patterns)
Lite Approximation: Simple ratio instead of true Shannon entropy H(X) = -Σ p(x)·log₂(p(x))
Order Clustering (Simplified Hawkes Process):
Tracks self-exciting event intensity (coordinated order activity)
Decays at 0.9× per bar, spikes +1.0 when volume >1.5× average
High intensity (>0.7) indicates clustering (potential spoofing/accumulation)
Lite Approximation: Simple exponential decay instead of full λ(t) = μ + Σ α·exp(-β(t-tᵢ)) with MLE
Signal Generation Process
Multi-Stage Validation:
Stage 1: Agent Scoring
Each agent calculates internal score based on its detection criteria
Scores must exceed agent-specific threshold (adjusted by sensitivity multiplier)
Agent outputs: Signal direction (+1/-1/0) and Confidence level (0.0-1.0)
Stage 2: Memory Boost
Agent scores multiplied by memory boost factor (0.8-1.2 based on recent performance)
Successful agents get amplified, failing agents get dampened
Stage 3: Bandit Selection/Blending
If Adaptive Mode ON:
Switch: Bandit selects single best agent, uses only its signal
Blend: All agents combined using softmax-weighted confidence scores
If Adaptive Mode OFF:
Traditional consensus voting with confidence-squared weighting
Signal fires when consensus exceeds threshold (default 70%)
Stage 4: Confirmation Filter
Raw signal must repeat for consecutive bars (default 3, configurable 2-4)
Minimum confidence threshold: 0.25 (25%) enforced regardless of mode
Trend alignment check: Long signals require trend_score ≥ -2, Short signals require trend_score ≤ 2
Stage 5: Cooldown Enforcement
Minimum bars between signals (default 10, configurable 5-15)
Prevents over-trading during choppy conditions
Stage 6: Performance Tracking
After 8 bars (performance horizon), signal outcome evaluated
Win = price moved in signal direction, Loss = price moved against
Results fed back into memory and bandit statistics
Trading Modes (Presets)
Pre-configured parameter sets:
Conservative: 85% consensus, 4 confirmations, 15-bar cooldown
Expected: 60-70% win rate, 3-8 signals/week
Best for: Swing trading, capital preservation, beginners
Balanced: 70% consensus, 3 confirmations, 10-bar cooldown
Expected: 55-65% win rate, 8-15 signals/week
Best for: Day trading, most traders, general use
Aggressive: 60% consensus, 2 confirmations, 5-bar cooldown
Expected: 50-58% win rate, 15-30 signals/week
Best for: Scalping, high-frequency trading, active management
Elite: 75% consensus, 3 confirmations, 12-bar cooldown
Expected: 58-68% win rate, 5-12 signals/week
Best for: Selective trading, high-conviction setups
Adaptive: 65% consensus, 2 confirmations, 8-bar cooldown
Expected: Varies based on learning
Best for: Experienced users leveraging bandit system
How to Use
1. Initial Setup (5 Minutes):
Select Trading Mode matching your style (start with Balanced)
Enable Adaptive Learning (recommended for automatic agent selection)
Choose Thompson Sampling algorithm (best all-around performance)
Keep Microstructure Metrics enabled for liquid instruments (>100k daily volume)
2. Agent Tuning (Optional):
Adjust Agent Sensitivity multipliers (0.5-2.0):
<0.8 = Highly selective (fewer signals, higher quality)
0.9-1.2 = Balanced (recommended starting point)
1.3 = Aggressive (more signals, lower individual quality)
Monitor dashboard for 20-30 signals to identify dominant agent
If one agent consistently outperforms, consider using Lock Agent feature
3. Bandit Configuration (Advanced):
Blend Temperature (0.1-2.0):
0.3 = Sharp decisions (best agent dominates)
0.5 = Balanced (default)
1.0+ = Smooth (equal weighting, democratic)
Memory Decay (0.8-0.99):
0.90 = Fast adaptation (volatile markets)
0.95 = Balanced (most instruments)
0.97+ = Long memory (stable trends)
4. Signal Interpretation:
Green triangle (▲): Long signal confirmed
Red triangle (▼): Short signal confirmed
Dashboard shows:
Active agent (highlighted row with ► marker)
Win rate per agent (green >60%, yellow 40-60%, red <40%)
Confidence bars (█████ = maximum confidence)
Memory size (short-term buffer count)
Colored zones display:
Entry level (current close)
Stop-loss (1.5× ATR)
Take-profit 1 (2.0× ATR)
Take-profit 2 (3.5× ATR)
5. Risk Management:
Never risk >1-2% per signal (use ATR-based stops)
Signals are entry triggers, not complete strategies
Combine with your own market context analysis
Consider fundamental catalysts and news events
Use "Confirming" status to prepare entries (not to enter early)
6. Memory Persistence (Optional):
After 50-100 trades, check Memory Export Panel
Record displayed alpha/beta/weight values for each agent
Record VPIN and Kyle threshold values
Enable "Restore From Memory" and input saved values to continue learning
Useful when switching timeframes or restarting indicator
Visual Components
On-Chart Elements:
Spectral Layers: EMA8 ± 0.5 ATR bands (dynamic support/resistance, colored by trend)
Energy Radiance: Multi-layer glow boxes at signal points (intensity scales with confidence, configurable 1-5 layers)
Probability Cones: Projected price paths with uncertainty wedges (15-bar projection, width = confidence × ATR)
Connection Lines: Links sequential signals (solid = same direction continuation, dotted = reversal)
Kill Zones: Risk/reward boxes showing entry, stop-loss, and dual take-profit targets
Signal Markers: Triangle up/down at validated entry points
Dashboard (Configurable Position & Size):
Regime Indicator: 4-level trend classification (Strong Bull/Bear, Weak Bull/Bear)
Mode Status: Shows active system (Adaptive Blend, Locked Agent, or Consensus)
Agent Performance Table: Real-time win%, confidence, and memory stats
Order Flow Metrics: Toxicity and impact indicators (when microstructure enabled)
Signal Status: Current state (Long/Short/Confirming/Waiting) with confirmation progress
Memory Panel (Configurable Position & Size):
Live Parameter Export: Alpha, beta, and weight values per agent
Adaptive Thresholds: Current VPIN sensitivity and Kyle threshold
Save Reminder: Visual indicator if parameters should be recorded
What Makes This Original
This script's originality lies in three key innovations:
1. Genuine Meta-Learning Framework:
Unlike traditional indicator mashups that simply display multiple signals, this implements authentic reinforcement learning (multi-armed bandits) to learn which detection method works best in current conditions. The Thompson Sampling implementation with beta distribution tracking (alpha for successes, beta for failures) is statistically rigorous and adapts continuously. This is not post-hoc optimization—it's real-time learning.
2. Episodic Memory Architecture with Transfer Learning:
The dual-layer memory system mimics human learning patterns:
Short-term memory captures recent performance (recency bias)
Long-term memory preserves historical patterns (experience)
Automatic transfer mechanism consolidates knowledge
Memory boost creates positive feedback loops (successful strategies become stronger)
This architecture allows the system to adapt without retraining , unlike static ML models that require batch updates.
3. Institutional Microstructure Integration:
Combines retail-focused technical analysis (RSI, Bollinger Bands, VWAP) with institutional-grade microstructure metrics (VPIN, Kyle's Lambda, Hawkes processes) typically found in academic finance literature and professional trading systems, not standard retail platforms. While simplified for Pine Script constraints, these metrics provide insight into informed vs. uninformed trading , a dimension entirely absent from traditional technical analysis.
Mashup Justification:
The four agents are combined specifically for risk diversification across failure modes:
Spoofing Detector: Prevents false breakout losses from manipulation
Exhaustion Detector: Prevents chasing extended trends into reversals
Liquidity Void: Exploits volatility compression (different regime than trending)
Mean Reversion: Provides mathematical anchoring when patterns fail
The bandit system ensures the optimal tool is automatically selected for each market situation, rather than requiring manual interpretation of conflicting signals.
Why "ML-lite"? Simplifications and Approximations
This is the "lite" version due to necessary simplifications for Pine Script execution:
1. Simplified VPIN Calculation:
Academic Implementation: True VPIN uses volume bucketing (fixed-volume bars) and tick-by-tick buy/sell classification via Lee-Ready algorithm or exchange-provided trade direction flags
This Implementation: 20-bar rolling window with simple open/close heuristic (close > open = buy volume)
Impact: May misclassify volume during ranging/choppy markets; works best in directional moves
2. Pseudo-Random Sampling:
Academic Implementation: Thompson Sampling requires true random number generation from beta distributions using inverse transform sampling or acceptance-rejection methods
This Implementation: Deterministic pseudo-randomness derived from price and volume decimal digits: (close × 100 - floor(close × 100)) + (volume % 100) / 100
Impact: Not cryptographically random; may have subtle biases in specific price ranges; provides sufficient variation for agent selection
3. Hawkes Process Approximation:
Academic Implementation: Full Hawkes process uses maximum likelihood estimation with exponential kernels: λ(t) = μ + Σ α·exp(-β(t-tᵢ)) fitted via iterative optimization
This Implementation: Simple exponential decay (0.9 multiplier) with binary event triggers (volume spike = event)
Impact: Captures self-exciting property but lacks parameter optimization; fixed decay rate may not suit all instruments
4. Kyle's Lambda Simplification:
Academic Implementation: Estimated via regression of price impact on signed order flow over multiple time intervals: Δp = λ × Δv + ε
This Implementation: Simplified ratio: price_change / sqrt(volume_sum) without proper signed order flow or regression
Impact: Provides directional indicator of impact but not true market depth measurement; no statistical confidence intervals
5. Entropy Calculation:
Academic Implementation: True Shannon entropy requires probability distribution: H(X) = -Σ p(x)·log₂(p(x)) where p(x) is probability of each price change magnitude
This Implementation: Simple ratio of unique price changes to total observations (variety measure)
Impact: Measures diversity but not true information entropy with probability weighting; less sensitive to distribution shape
6. Memory System Constraints:
Full ML Implementation: Neural networks with backpropagation, experience replay buffers (storing state-action-reward tuples), gradient descent optimization, and eligibility traces
This Implementation: Fixed-size array queues with simple averaging; no gradient-based learning, no state representation beyond raw scores
Impact: Cannot learn complex non-linear patterns; limited to linear performance tracking
7. Limited Feature Engineering:
Advanced Implementation: Dozens of engineered features, polynomial interactions (x², x³), dimensionality reduction (PCA, autoencoders), feature selection algorithms
This Implementation: Raw agent scores and basic market metrics (RSI, ATR, volume ratio); minimal transformation
Impact: May miss subtle cross-feature interactions; relies on agent-level intelligence rather than feature combinations
8. Single-Instrument Data:
Full Implementation: Multi-asset correlation analysis (sector ETFs, currency pairs, volatility indices like VIX), lead-lag relationships, risk-on/risk-off regimes
This Implementation: Only OHLCV data from displayed instrument
Impact: Cannot incorporate broader market context; vulnerable to correlated moves across assets
9. Fixed Performance Horizon:
Full Implementation: Adaptive horizon based on trade duration, volatility regime, or profit target achievement
This Implementation: Fixed 8-bar evaluation window
Impact: May evaluate too early in slow markets or too late in fast markets; one-size-fits-all approach
Performance Impact Summary:
These simplifications make the script:
✅ Faster: Executes in milliseconds vs. seconds (or minutes) for full academic implementations
✅ More Accessible: Runs on any TradingView plan without external data feeds, APIs, or compute servers
✅ More Transparent: All calculations visible in Pine Script (no black-box compiled models)
✅ Lower Resource Usage: <500 bars lookback, minimal memory footprint
⚠️ Less Precise: Approximations may reduce statistical edge by 5-15% vs. academic implementations
⚠️ Limited Scope: Cannot capture tick-level dynamics, multi-order-book interactions, or cross-asset flows
⚠️ Fixed Parameters: Some thresholds hardcoded rather than dynamically optimized
When to Upgrade to Full Implementation:
Consider professional Python/C++ versions with institutional data feeds if:
Trading with >$100K capital where precision differences materially impact returns
Operating in microsecond-competitive environments (HFT, market making)
Requiring regulatory-grade audit trails and reproducibility
Backtesting with tick-level precision for strategy validation
Need true real-time adaptation with neural network-based learning
For retail swing/day trading and position management, these approximations provide sufficient signal quality while maintaining usability, transparency, and accessibility. The core logic—multi-agent detection with adaptive selection—remains intact.
Technical Notes
All calculations use standard Pine Script built-in functions ( ta.ema, ta.atr, ta.rsi, ta.bb, ta.sma, ta.stdev, ta.vwap )
VPIN and Kyle's Lambda use simplified formulas optimized for OHLCV data (see "Lite" section above)
Thompson Sampling uses pseudo-random noise from price/volume decimal digits for beta distribution sampling
No repainting: All calculations use confirmed bar data (no forward-looking)
Maximum lookback: 500 bars (set via max_bars_back parameter)
Performance evaluation: 8-bar forward-looking window for reward calculation (clearly disclosed)
Confidence threshold: Minimum 0.25 (25%) enforced on all signals
Memory arrays: Dynamic sizing with FIFO queue management
Limitations and Disclaimers
Not Predictive: This indicator identifies patterns in historical data. It cannot predict future price movements with certainty.
Requires Human Judgment: Signals are entry triggers, not complete trading strategies. Must be confirmed with your own analysis, risk management rules, and market context.
Learning Period Required: The adaptive system requires 50-100 bars minimum to build statistically meaningful performance data for bandit algorithms.
Overfitting Risk: Restoring memory parameters from one market regime to a drastically different regime (e.g., low volatility to high volatility) may cause poor initial performance until system re-adapts.
Approximation Limitations: Simplified calculations (see "Lite" section) may underperform academic implementations by 5-15% in highly efficient markets.
No Guarantee of Profit: Past performance, whether backtested or live-traded, does not guarantee future performance. All trading involves risk of loss.
Forward-Looking Bias: Performance evaluation uses 8-bar forward window—this creates slight look-ahead for learning (though not for signals). Real-time performance may differ from indicator's internal statistics.
Single-Instrument Limitation: Does not account for correlations with related assets or broader market regime changes.
Recommended Settings
Timeframe: 15-minute to 4-hour charts (sufficient volatility for ATR-based stops; adequate bar volume for learning)
Assets: Liquid instruments with >100k daily volume (forex majors, large-cap stocks, BTC/ETH, major indices)
Not Recommended: Illiquid small-caps, penny stocks, low-volume altcoins (microstructure metrics unreliable)
Complementary Tools: Volume profile, order book depth, market breadth indicators, fundamental catalysts
Position Sizing: Risk no more than 1-2% of capital per signal using ATR-based stop-loss
Signal Filtering: Consider external confluence (support/resistance, trendlines, round numbers, session opens)
Start With: Balanced mode, Thompson Sampling, Blend mode, default agent sensitivities (1.0)
After 30+ Signals: Review agent win rates, consider increasing sensitivity of top performers or locking to dominant agent
Alert Configuration
The script includes built-in alert conditions:
Long Signal: Fires when validated long entry confirmed
Short Signal: Fires when validated short entry confirmed
Alerts fire once per bar (after confirmation requirements met)
Set alert to "Once Per Bar Close" for reliability
Taking you to school. — Dskyz, Trade with insight. Trade with anticipation.

Fair Value Gap Pro by Bifrost InstituteFair Value Gap Pro brings institutional-style FVGs to TradingView with the precision and controls traders actually need. It detects clean 3-candle gaps on any higher timeframe, projects them onto your active chart, and overlays precise buy/sell volume ratios so you can judge the quality of a gap at a glance. Everything is customizable—from colors and line styles to tag markers, and volume display—so the tool adapts to your workflow instead of the other way around.
🔭 Multi-Timeframe Engine
Higher Timeframe Detection: Choose any HTF (M5, H1, H4, D1, etc.) and view those gaps on any lower-TF chart
Smart Gap Detection: Strict 3-candle mode ensures only successive bars form gaps—automatically rejects weekend gaps and market closures
Configurable History: Scan back 1-500+ bars with intelligent processing
Extend Until Filled: Gaps dynamically extend forward until price fills them, or use fixed-width mode
Advanced Fill Logic: Fill Rules - Close only, wick only, or close/wick; Fill Depth: TouchAny (immediate edge touch) or TouchMid (requires 50% penetration)
TouchMid Margin: Fine-tune difficulty with -50% to +50% adjustment (e.g., -10% = easier fill at 40% depth)
Weekend Gap Protection: Prevents false fills from market gaps—only real price action counts
📊 HTF-Accurate Volumetrics
True HTF Volume: Uses higher timeframe bar data for accurate volume matching across all chart timeframes
Buy vs Sell Delta: Integrated volume analysis for every FVG shows institutional pressure
Display Formats: Decimal ratios, percentages, or raw values (with K/M/B suffixes)
Volume Modes: Bar Delta (fast & reliable, recommended), Tick Delta (optional, feed-dependent)
Clear "+" (buy) and "–" (sell) prefixes for instant reading
🎨 Fully Customizable Appearance
Color Control: Color pickers for Bullish/Bearish FVG fills & Filled state colors (different from active), Band lines, midlines, and text labels.
Formation and fill tag markers
Line Styling: Color & Width
🔔 Alerts
Toggle formation/fill alerts independently
🏷 Tags
Visual Tags: Show markers - Text / Icon per event type
Icon choices: Circle, Square, Diamond, Star, Up/Down Arrow
Independent colors for formation vs fill tags
Auto-remove "formed" tag when "filled" tag appears
Configurable size and positioning
🧩 Rendering & Fill Display
Triple-Band Display: Upper, mid, and lower boundary lines with configurable styles
Filled Rectangle: Semi-transparent fill between boundaries for clear visualization
Fill State Management: Hide filled gaps completely, or keep them visible with distinct "filled" colors.
"Use Filled Colours" option for easy state identification
Quality Filters: Minimum body size filter (in chart points) to exclude noise from low-volatility periods
⚙️ Quality-of-Life Features
Performance Optimized: Efficient HTF/LTF time mapping with binary search algorithms
Cross-Symbol Compatible: Robust handling across all symbols and data feeds
Sensible Defaults: Works beautifully out of the box—tweak only what you need
Minimal Chart Clutter: Designed to keep critical information visible without overwhelming your workspace
💡 Perfect For
Institutional gap traders who need precision and control
Multi-timeframe analysts requiring HTF context on LTF charts
Volume profile traders seeking buy/sell pressure confirmation
Traders who value clean, professional chart aesthetics
Anyone tired of indicators that force rigid workflows
Fair Value Gap Pro doesn't just show you gaps—it gives you the complete institutional picture with the flexibility to trade your way.

Squeeze Go Momentum Pro [KingThies] █ OVERVIEW
The Squeeze Momentum Pro indicator identifies volatility compression phases and breakout opportunities by comparing Bollinger Bands to Keltner Channels. When price consolidates (squeeze), the bands contract inside the channels, signaling an imminent breakout. The momentum histogram shows directional bias, helping traders anticipate which way price will move when the squeeze releases.
This indicator displays in a separate panel below the price chart, providing clear visual signals without cluttering price action.
█ KEY FEATURES
Momentum Histogram
The histogram is the primary visual element, displaying momentum strength and direction with four distinct color states:
• Dark Green (#00C853) — Strong bullish momentum that is increasing. This signals strengthening upward pressure and potential continuation.
• Light Green (#26A69A) — Bullish momentum that is decreasing. Price remains in bullish territory but upward force is weakening.
• Dark Red (#D32F2F) — Strong bearish momentum that is increasing. This signals strengthening downward pressure and potential continuation.
• Light Red (#EF5350) — Bearish momentum that is decreasing. Price remains in bearish territory but downward force is weakening.
The color intensity provides immediate feedback on momentum strength and trend health.
Squeeze State Indicator
Colored dots on the zero line communicate the current volatility state:
• Orange Dots — Squeeze is ON. Bollinger Bands have contracted inside Keltner Channels, indicating consolidation and low volatility.
A breakout is building and traders should prepare for directional movement.
• Green Dots — Squeeze is OFF. Bollinger Bands have expanded outside Keltner Channels, indicating active momentum and higher volatility.
Price is moving with conviction in the current direction.
• Gray Dots — Neutral state. The bands are transitioning between squeeze states.
Release Triangles
Triangle shapes mark the exact bar when a squeeze releases, providing precise entry timing:
• Green Triangle Up — Bullish squeeze release. The squeeze has ended with positive momentum, suggesting a long setup opportunity.
• Red Triangle Down — Bearish squeeze release. The squeeze has ended with negative momentum, suggesting a short setup opportunity.
Information Panel
A compact dashboard in the top-right corner displays real-time trading intelligence:
• Squeeze Status — Current state: ON, OFF, or NEUTRAL with color coding
• Momentum Direction — Current bias: BULL or BEAR
• Momentum Value — Precise numerical reading of momentum strength
• Trading Signal — Actionable status: LONG SETUP, SHORT SETUP, WAIT, or MONITOR
Configurable Parameters
All calculation inputs are adjustable to match your trading style and timeframe:
• BB Length — Bollinger Bands period (default: 20)
• BB StdDev — Bollinger Bands standard deviation multiplier (default: 2.0)
• KC Length — Keltner Channels period (default: 20)
• KC ATR Multiplier — Keltner Channels range multiplier (default: 1.5)
• Momentum Length — Linear regression period for momentum calculation (default: 20)
Alert System
Four alert conditions notify you of critical trading opportunities:
• Bullish Squeeze Release — Squeeze has released with bullish momentum, indicating a potential long entry
• Bearish Squeeze Release — Squeeze has released with bearish momentum, indicating a potential short entry
• Squeeze Started — Volatility compression detected, prepare for upcoming breakout
• Squeeze Ended — Volatility expansion confirmed, breakout is active
█ TRADING METHODOLOGY
The indicator follows a clear four-step process for identifying and trading squeeze breakouts:
1 - Wait for Orange Dots . When orange dots appear on the zero line, a squeeze is building. This indicates price consolidation and declining volatility.
Do not enter trades during this phase. Instead, prepare by identifying key support and resistance levels and potential breakout directions.
2 - Watch for Release Triangle . When a triangle appears, the squeeze has released and a breakout is beginning. This is your entry signal.
The triangle color (green up or red down) combined with the histogram direction indicates the breakout direction.
3 - Confirm with Histogram Direction . Check the momentum histogram for directional confirmation:
• Green histogram + green triangle up = Go long. Bullish momentum supports upward breakout.
• Red histogram + red triangle down = Go short. Bearish momentum supports downward breakout.
4 - Monitor Momentum Intensity . Stay in the trade while histogram bars maintain their dark, intense color.
When colors lighten (dark green to light green, or dark red to light red), momentum is weakening and you should consider taking profits or tightening stops.
█ INTERPRETATION GUIDE
Squeeze Detection Logic
A squeeze occurs when Bollinger Bands contract inside Keltner Channels. This happens when:
• Standard deviation of price decreases (BB narrows)
• Price consolidates within a tight range
• Volatility compresses to unsustainable levels
The orange dots signal this condition, warning traders that explosive movement is imminent.
Squeeze Release Logic
A squeeze releases when Bollinger Bands expand outside Keltner Channels. This happens when:
• Price volatility increases sharply
• Price breaks out of consolidation
• Volume typically expands (check volume separately)
The green dots and release triangles signal this condition, indicating the direction and timing of the breakout.
Momentum Reading
The histogram uses linear regression to calculate momentum relative to the midpoint of the recent range:
• Above Zero : Price is trading above the range midpoint with bullish pressure
• Below Zero : Price is trading below the range midpoint with bearish pressure
• Increasing Bars : Momentum is strengthening in the current direction (darker color)
• Decreasing Bars : Momentum is weakening in the current direction (lighter color)
█ BEST PRACTICES
• Timeframe Selection — The indicator works on all timeframes but performs best on 15-minute to daily charts.
Lower timeframes may produce more false signals due to noise.
• Confluence Trading — Combine squeeze releases with support/resistance levels, trend lines, or other indicators for higher probability setups.
• Volume Confirmation — Check that squeeze releases occur with increasing volume. Low volume breakouts are more likely to fail.
• Multiple Timeframe Analysis — Check higher timeframes for overall trend direction. Trade squeeze releases that align with the larger trend.
• Parameter Adjustment — Increase BB and KC lengths for smoother signals on higher timeframes. Decrease for more sensitive signals on lower timeframes.
█ LIMITATIONS
• The indicator does not predict breakout direction before the squeeze releases. The momentum histogram provides bias but is not definitive until the breakout occurs.
• False breakouts can occur, particularly in choppy or low-volume market conditions. Always use proper risk management and stop losses.
• The indicator works best in trending markets. In deeply ranging markets with no clear direction, squeeze signals may be less reliable.
• Momentum calculations use linear regression which can lag during extremely fast price movements. Confirm signals with price action.
█ NOTES
This implementation uses linear regression for momentum calculation rather than simple moving averages, providing more responsive and accurate directional signals. The four-color histogram system gives traders nuanced feedback on momentum strength that binary color schemes cannot provide.
The indicator automatically adjusts to any symbol and timeframe without modification, making it suitable for stocks, forex, crypto, and futures markets.
█ CREDITS
Squeeze methodology inspired by John Carter's TTM Squeeze indicator. Momentum calculation and visual design optimized for modern trading workflows.
