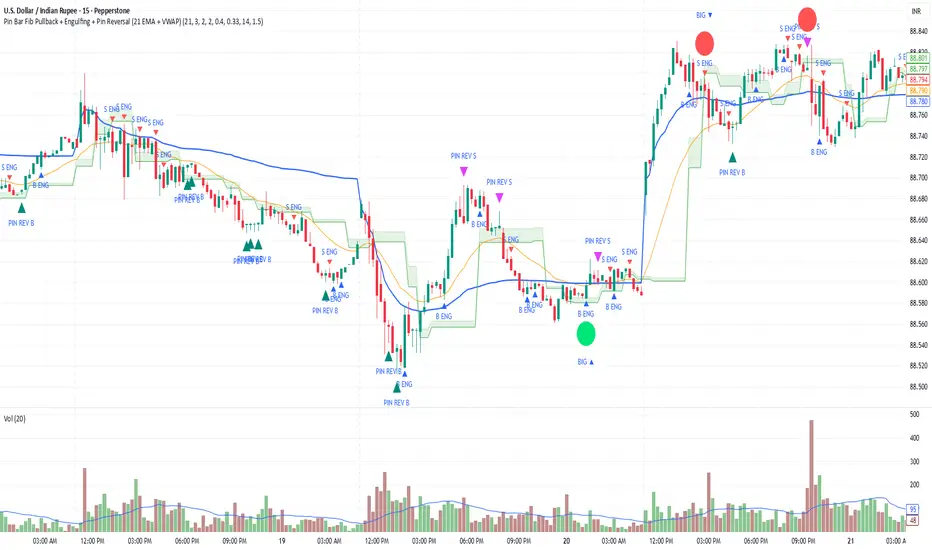
Pin Bar Fib Pullback + Engulfing + Pin Reversal (21 EMA + VWAP)Dear Traders
Pin bar fib pullback continuation (in 0.50–0.618 zone)
Bullish/Bearish engulfing
Pin bar reversals (bottom/top)
Then we ask: did the next candle move at least atrMult × ATR away from the signal close in the right direction?
For a long signal: next high ≥ signal close + ATR * atrMult
For a short signal: next low ≤ signal close − ATR * atrMult
If yes, that signal gets a big circle with text:
BIG ▲ for long
BIG ▼ for short
drawn on the original signal bar (using offset = -1 trick).
You can tune how “big” you want:
Increase ATR length for smoother ATR
Increase ATR * (e.g., from 1.5 → 2.0) to only mark really strong moves.
Wyszukaj w skryptach "bar"
VIX Calm vs Choppy (Bar Version, VIX High Threshold)This indicator tracks market stability by measuring how long the VIX stays below or above a chosen intraday threshold. Instead of looking at VIX closes, it uses VIX high, so even a brief intraday spike will flip the regime into “choppy.”
The tool builds a running clock of consecutive bars spent in each regime:
Calm regime: VIX high stays below the threshold
Choppy regime: VIX high hits or exceeds the threshold
Calm streaks plot as positive bars (light blue background).
Choppy streaks plot as negative bars (dark pink background).
This gives a clean picture of how long the market has been stable vs volatile — useful for trend traders, breakout traders, and anyone who watches risk-on/risk-off conditions. A table shows the current regime and streak length for quick reference.

RSI Bars - OnlyFlowThis indicator applies the RSI (Relative Strength Index) to candle coloring so that bar colors reflect momentum conditions instead of a fixed scheme.
RSI Logic: Bars shift color when RSI values move into overbought or oversold regions, with intensity scaled by how far RSI extends beyond the thresholds.
Gradient / Step Mode: Choose between a smooth gradient or a 3-step palette to visualize strength.
Directional Neutral Colors: Neutral zones can follow candle direction for clearer trend context.
Customization: Overbought/oversold levels and color palettes are user-configurable.
Optional RSI Panel: An RSI plot with overbought/oversold lines can be enabled in a separate pane if desired.
This tool is meant to give traders a more intuitive view of RSI conditions directly on price bars, helping to quickly see momentum extremes without needing to glance away from the chart.

Body-Based Inside/Outside Bars (wicks excluded)This indicator shows inside/outside bars EXCLUDING the wicks. The yellow vertical line indicates an inside bar (body only) and the blue vertical line indicates outside bars (candle body only).

AymaN Entry Signal – With HTF + Pin Bar + Multi TP + BE + V1Ayman Entry Signal – Indicator Description
Overview
Ayman Entry Signal – With HTF + Pin Bar + Multi TP + BE + Stats Panel (V1)
This is a professional-grade Pine Script indicator designed for scalping and intraday trading, with full trade management, multi-confirmation logic, and advanced visualization. The tool is ideal for traders focused on XAUUSD (Gold), Forex, and other volatile instruments who seek both precision entries and structured exits with dynamic risk control.
Main Features
Advanced Entry Logic:
- EMA fast/slow crossovers (configurable)
- Optional conditions: Break of Structure (BoS), Order Block (OB), Fair Value Gap (FVG), Liquidity sweeps, Pin Bars
- HTF confirmation using EMA or BoS
- Real-time entry condition display
Trade Management:
- Dynamic calculation of Entry, SL (with ATR buffer), TP1, TP2
- Supports Partial Close and Break Even logic after TP1
- Visual PnL label (dynamic and color-coded)
Statistics Panel:
- Shows total trades, win/loss/breakeven count, cumulative PnL
- Filter by custom date or session
- Fully customizable panel appearance
Trade Visualization:
- Trade box includes all trade levels (Entry, SL, TP1, TP2)
- Visual display of trade conditions and PnL result
- Option to keep previous trades on chart
Alert System:
- Alerts for Buy and Sell entries
- Compatible with webhook automation systems like MT5/MT4
Customization & Inputs
- Capital & risk per trade
- Value per pip/point
- SL buffer (ATR-based)
- Manual EMA override
- Enable/disable: EMA, BoS, OB, FVG, Liquidity, Pin Bars
- HTF: timeframe + confirmation logic
- Trade box/labels visibility
- Full color customization
- PnL label position: top, center, or bottom
Recommended Use
- Ideal for Gold scalping (XAUUSD), also effective for Forex
- Best on 1m–15m charts; use HTF confirmation from 15m–4H
- Pairs well with semi-automated systems using alerts and webhooks
Disclaimer
Note: This is a non-executing indicator. It does not place trades but provides visual and statistical guidance for professional manual or semi-automated trading.

BarUtils: Get Bar Index from DateLibrary "BarUtils"
getBarIndexFromDate(targetTimestamp)
Parameters:
targetTimestamp (int)
**Description**:
This utility provides a reliable way to calculate the `bar_index` of a specific calendar date, regardless of chart resolution. It's especially useful for anchoring scripts to historical events, labeling macroeconomic moments, or marking custom time-based signals that must remain consistent across timeframes.
Unlike hardcoded `bar_index - N` approaches, this function dynamically estimates the number of bars between a given `timestamp()` and the current bar using the actual time-per-bar (`time - time `). It works correctly on intraday, daily, weekly, and monthly charts.
### 💡 **Function Provided**:
import TradeTitan120/BarUtils/1
* `getBarIndexFromDate(int targetTimestamp)`
→ Returns the estimated `bar_index` that aligns with a given timestamp
### ✅ **Use Cases**:
* Marking past events like FOMC meetings, market crashes, or personal signals
* Backtesting entry/exit conditions from specific calendar dates
* Anchoring visual elements (shapes, lines, labels) across resolutions
This tool is simple, fast, and built for accuracy. Use it to enhance multi-timeframe compatibility in any script.
Double Inside Body Candles with Box & Alert + 5-Bar LinesThis indicator identifies Double Inside Body Candle patterns, where:
Candle 1 is completely inside Candle 2,
Candle 2 is completely inside Candle 3 (the parent candle),
Candle 3 has a real body (not a doji or negligible body size).
Once the pattern is detected:
A label appears below the current candle.
A highlight box is drawn around Candle 3 (the parent candle) body range.
Horizontal lines are drawn from the top and bottom of Candle 3’s body and extend forward for exactly 5 bars to visualize potential breakout levels.
The script also detects and highlights breakouts:
🔼 Bullish breakout: if price closes above Candle 3's body high.
🔽 Bearish breakout: if price closes below Candle 3's body low.
Alerts are available for:
Double Inside Body pattern detection
Bullish breakout
Bearish breakout
Traders can use this script to identify consolidation periods (double inside bars), then monitor for breakout opportunities in either direction, using the 5-bar lines as short-term breakout levels.

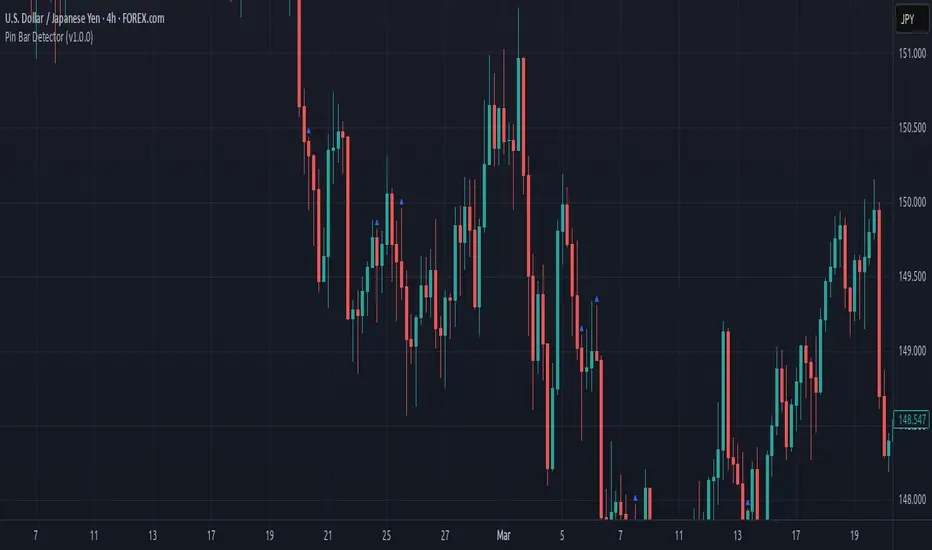
Pin Bar Detector (v1.0.0) Description:
This script detects Pin Bar candlestick patterns based on their shadows and body size.
It analyzes the candle's structure and trend direction using moving averages
to determine valid Pin Bars in an uptrend or downtrend.
The purpose of this script is to help traders identify potential reversal points
by spotting Pin Bar formations in line with the prevailing market trend.
Sunil 2 Bar Breakout StrategyDetailed Explanation of the Sunil 2 Bar Breakout Strategy
Introduction
The Sunil 2 Bar Breakout Strategy is a simple yet effective price-action-based approach designed to identify breakout opportunities in financial markets. This strategy analyzes the movement of the last three candles to detect momentum and initiates trades in the direction of the breakout. It is equipped with a built-in stop-loss mechanism to protect capital, making it suitable for traders looking for a structured and disciplined trading system.
The strategy works well across different timeframes and asset classes, including indices, stocks, forex, and cryptocurrencies. Its versatility makes it ideal for both intraday and swing trading.
Core Concept
The strategy revolves around two primary conditions: breakout identification and risk management.
Breakout Identification:
Long Trade Setup: The strategy identifies bullish breakouts when:
The current candle's closing price is higher than the previous candle's closing price.
The high of the previous candle is greater than the highs of the two candles before it.
Short Trade Setup: The strategy identifies bearish breakouts when:
The current candle's closing price is lower than the previous candle's closing price.
The low of the previous candle is lower than the lows of the two candles before it.
Risk Management:
Stop-Loss: For each trade, a stop-loss is automatically set:
For long trades, the stop-loss is set to the low of the previous candle.
For short trades, the stop-loss is set to the high of the previous candle.
This ensures that losses are minimized if the breakout fails.
Exit Logic:
The trade is closed automatically when the stop-loss is hit.
This approach maintains discipline and prevents emotional trading.
Strategy Workflow
Entry Criteria:
Long Entry: A long trade is triggered when:
The current close is greater than the previous close.
The high of the previous candle exceeds the highs of the two candles before it.
Short Entry: A short trade is triggered when:
The current close is less than the previous close.
The low of the previous candle is below the lows of the two candles before it.
Stop-Loss Placement:
For long trades, the stop-loss is set at the low of the previous candle.
For short trades, the stop-loss is set at the high of the previous candle.
Trade Management:
Trades are exited automatically if the stop-loss level is hit.
The strategy avoids re-entering trades until new breakout conditions are met.
Default Settings
Position Sizing:
The default position size is set to 1% of the account equity. This ensures proper risk management and prevents overexposure to the market.
Stop-Loss:
Stop-loss levels are automatically calculated based on the previous candle’s high or low.
Timeframes:
The strategy is versatile and works across multiple timeframes. However, it is recommended to test it on 15-minute, 1-hour, and daily charts for optimal performance.
Key Features
Automated Trade Execution:
The strategy handles both trade entry and exit automatically based on pre-defined conditions.
Built-In Risk Management:
The automatic stop-loss placement ensures losses are minimized on failed breakouts.
Works Across Markets:
The strategy is compatible with a wide range of instruments, including indices, stocks, forex, and cryptocurrencies.
Clear Signals:
Entry and exit points are straightforward and based on objective conditions, reducing ambiguity.
Versatility:
Can be used for both day trading and swing trading, depending on the chosen timeframe.
Best Practices for Using This Strategy
Backtesting:
Test the strategy on your chosen instrument and timeframe using TradingView's Strategy Tester to evaluate its performance.
Market Conditions:
The strategy performs best in trending markets or during periods of high volatility. Avoid using it in range-bound or choppy markets.
Position Sizing:
Use the default position size (1% of equity) or adjust based on your risk tolerance and account size.
Instrument Selection:
Focus on instruments with good liquidity and volatility, such as indices (e.g., NIFTY, BANKNIFTY), forex pairs, or major cryptocurrencies (e.g., Bitcoin, Ethereum).
Potential Enhancements
To make the strategy even more robust, consider adding the following optional features:
Stop-Loss Multiplier:
Allow users to customize the stop-loss distance as a multiple of the default level (e.g., 1.5x the low or high of the previous candle).
Take-Profit Levels:
Add user-defined take-profit levels, such as a fixed risk-reward ratio (e.g., 1:2).
Time Filter:
Include an option to restrict trading to specific market hours (e.g., avoid low-liquidity times).
Conclusion
The Sunil 2 Bar Breakout Strategy is an excellent tool for traders looking to capitalize on breakout opportunities while maintaining disciplined risk management. Its simplicity, combined with its effectiveness, makes it suitable for traders of all experience levels. By adhering to the clearly defined rules, traders can achieve consistent results while avoiding emotional trading decisions.
This strategy is a reliable addition to any trader’s toolbox and is designed to work seamlessly across different market conditions and instruments.

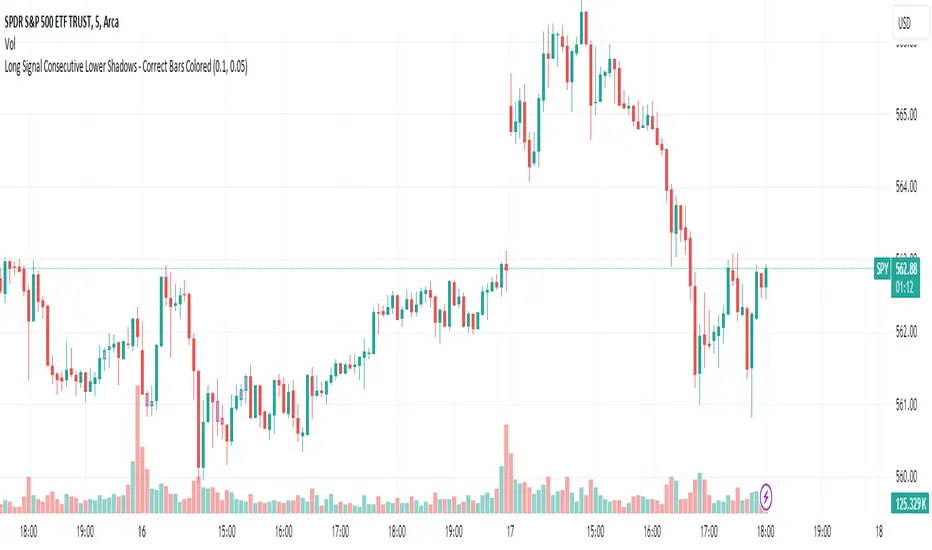
Long Signal Consecutive Lower Shadows - Correct Bars ColoredThis script identifies and highlights consecutive lower shadows on candlesticks in TradingView. A lower shadow is the portion of the candlestick between the low price and the lower of the open or close prices, often indicating price rejection at lower levels.
Key Features:
Threshold Settings: The user can customize the minimum length of the lower shadow (lowerShadowThreshold) and the maximum allowable price difference between consecutive lows (priceDifferenceThreshold).
Bar Coloring: When two consecutive bars meet the lower shadow condition, both bars are colored (default green).
Alerts: An alert is triggered when consecutive lower shadows are detected, allowing users to be notified of potential market reversals or buy opportunities.
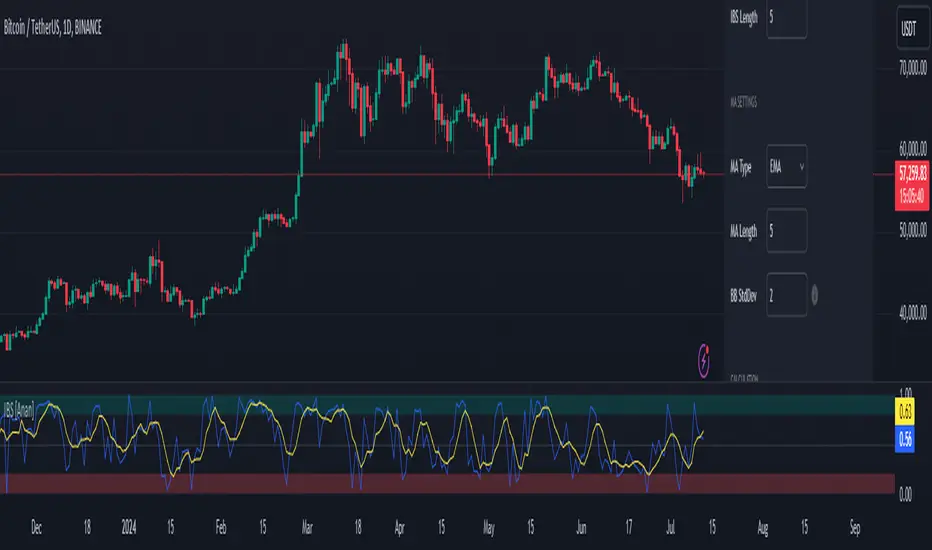
Internal Bar Strength IBS [Anan]This indicator calculates and displays the Internal Bar Strength (IBS) along with its moving average. The IBS is a measure that represents where the closing price is relative to the high-low range of a given period.
█ Main Formula
The core of this indicator is the Internal Bar Strength (IBS) calculation. The basic IBS formula is:
ibs = (close - low) / (high - low)
I enhanced the original formula by incorporating a user-defined length parameter. This modification allows for greater flexibility in analysis and interpretation. The extended version enables users to adjust the indicator's length according to their specific needs or market conditions. Notably, setting the length parameter to 1 reproduces the behavior of the original formula, maintaining backward compatibility while offering expanded functionality:
ibs = (close - ta.lowest(low, ibs_length)) / (ta.highest(high, ibs_length) - ta.lowest(low, ibs_length))
Where:
- `close` is the closing price of the current bar
- `lowest low` is the lowest low price over the specified IBS length
- `highest high` is the highest high price over the specified IBS length
█ Key Features
- Calculates IBS using a user-defined length
- Applies a moving average to the IBS values
- Offers multiple moving average types
- Includes optional Bollinger Bands or Donchian Channel overlays
- Visualizes bull and bear areas
█ Inputs
- IBS Length: The period used for IBS calculation
- MA Type: The type of moving average applied to IBS (options: SMA, EMA, SMMA, WMA, VWMA, Bollinger Bands, Donchian)
- MA Length: The period used for the moving average calculation
- BB StdDev: Standard deviation multiplier for Bollinger Bands
█ How to Use and Interpret
1. IBS Line Interpretation:
- IBS values range from 0 to 1
- Values close to 1 indicate the close was near the high, suggesting a bullish sentiment
- Values close to 0 indicate the close was near the low, suggesting a bearish sentiment
- Values around 0.5 suggest the close was near the middle of the range
2. Overbought/Oversold Conditions:
- IBS values above 0.8 (teal zone) may indicate overbought conditions
- IBS values below 0.2 (red zone) may indicate oversold conditions
- These zones can be used to identify potential reversal points
3. Trend Identification:
- Consistent IBS values above 0.5 may indicate an uptrend
- Consistent IBS values below 0.5 may indicate a downtrend
4. Using Moving Averages:
- The yellow MA line can help smooth out IBS fluctuations
- Crossovers between the IBS and its MA can signal potential trend changes
5. Bollinger Bands/Donchian Channel:
- When enabled, these can provide additional context for overbought/oversold conditions
- IBS touching or exceeding the upper band may indicate overbought conditions
- IBS touching or falling below the lower band may indicate oversold conditions
Remember that no single indicator should be used in isolation. Always combine IBS analysis with other technical indicators, price action analysis, and broader market context for more reliable trading decisions.
[LCS] Bar HeatmapThe script is an overlay aimed at making price action within a range more comprehensible, i.e. what is the “story” that the band range is telling in relation to the price. You’ll see bars become brighter as they come near the upper or lower band, and dimmer around the average/middle of the two bands. This makes it easier to spot when the price is within an oversold or overbought area or when its experiencing a strong trend movement. The color shift from one to the other can also give a sense as to whether the price action is changing character (going from bullish to bearish or vice versa).
Settings are available for customization to the user's liking.
How to use:
1. Add the indicator.
2. Add another indicator to use as the source, such as Bollinger Bands, which provides upper and lower plots for a channel range.
3. Click the gear icon to access the indicator settings.
4. Mandatory: Select the Upper Band and Lower Band settings as the upper and lower plots from your source indicator of choice to define the range.
5. Save settings. You should now see bars on your chart.
6. Access the Chart Settings (not the indicator settings) and hide the Body, Borders, and Wick for the default candle bars to avoid overlap.
You may need to perform additional configuration steps in your source indicator to appropriately size the range of the upper and lower band plots for a meaningful visualization.

S/R and Reversal BarsToday I'm proposing an idea to form S/R with a slightly different basic idea. This is a combination of CCI and candlestick study, and we will use this to mark possible reversal candles and possible S/R lines.
This is nothing complicated, I've used a basic CCI indicator with certain rules/system to mark S/R levels on the chart. (Have loaded traditional CCI indicator on bottom for comparison)
S/R levels are market as followed
Cross -
Lime = Support
Red = Resistance
Zero/Balance line - Yellow circles
The idea is to use this indicator to trade sideways market more successfully, in trending market this can be futile if you are not waiting for the break-out or breakdowns with confirmation.
Since this is based on CCI, it will give static result only when bar is closed, till then it will be susceptible for repaint. This is inherited nature from CCI readings on current bar. I could change this to only making reading on closed bar (historical bar), but that takes away from the uniqueness of this indicator in giving early indications.
This is a great tool for intraday scalping, but it does work on all timeframes, it's not bound by granularity.
This is for education purpose only.
Past success or seemingly positive results on published posts are not indication of future success.

Advanced Price Direction bar colorsIn the advanced price direction algorithm situations of faltering price directions (fda) are identified.
These are very interesting, because this happens at tops, flags and trend turns.
I got the idea of coloring the bars with fda in a distinguishing color, reddish gray for fda down and blueish gray for faltering up.
The remaining bars retain standard color, but now this color 'confirms' the trend.
To show that this is true, I also plot a simple moving average (sma) with the same length in the chart.
It turns out that somehow the bars react to being above or below the sma, but also react to the direction of the sma.
Very interesting.
Have fun

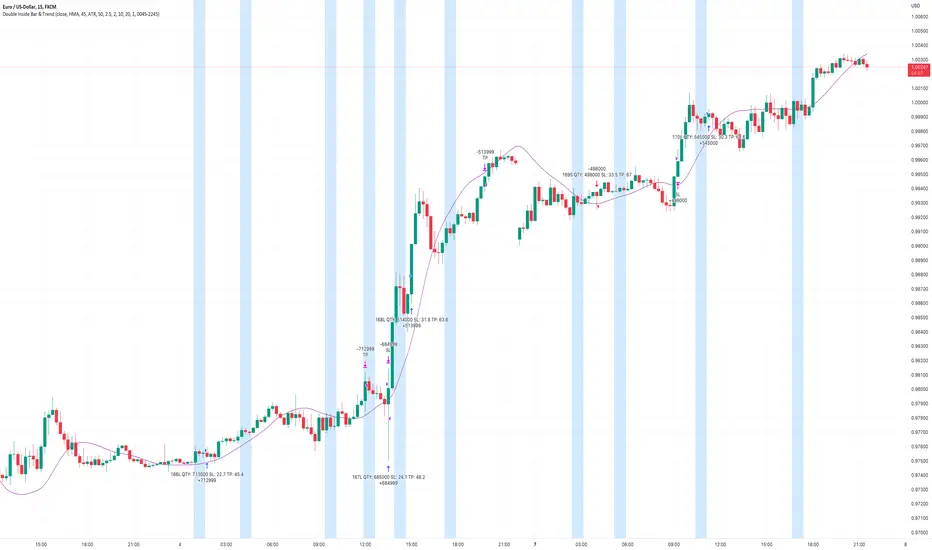
Double Inside Bar & Trend Strategy - KaspricciDouble Inside Bar & Trend Strategy - Kaspricci
This strategy combines the Double Inside Bar candlestick pattern with a trend filter. Once the second inside bar closes and price is above trend moving average, a buy stop order is placed at high of the candle. If price is below trend moving average, a sell stop order is placed at the low of the candle.
This strategy is for educational purposes only! It is not meant to be a financial advice.
Settings
Trend source, type of moving average and length for calculating trend
Stop Loss Type - default: ATR. You can switch between stop loss calculation based on Average True Range value or fixed value.
ATR Length / Factor / TP Ratio - default: 14 / 2.0 / 2.0. Used to calculate the Stop Loss as ATR * Factor and Take Profit as Stop Loss * TP Ratio.
FIX Stop Loss / Take Profit - default: 10 pips / 20 pips. In case you select Stop Loss Type = FIX, these value swill be used.
Risk in % - default: 1%, option to adjust the quantity of a trade based on a defined risk percentage. If enabled, it will overwrite the quantity parameter of the strategy settings.
On top you can filter trades by start and end date as well as time of the day.
NumberOfVisibleBarsLibrary "NumberOfVisibleBars"
This library calculates the number of visible bars on the user screen
NumberOfVisibleBars(No)
Calculates the number of visible bars on the user screen
Parameters:
No : paramters needed
Returns: The numbers of visible bars on the user screen (int)

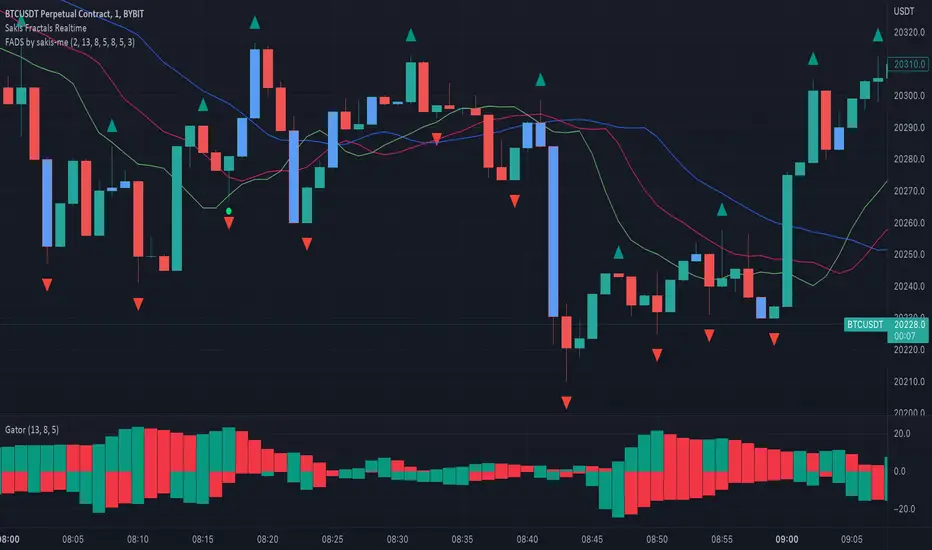
Fractals + Alligator + Divergent Bars + Squat BarsFractals + Alligator + Divergent Bars + Squat Bars Williams Indicators
All combined in one
MTF MACD BarOVERVIEW
This indicator shows MACD(Moving Average Convergence/Divergence) is up or down, represented by a bar. This indicator is compatible with MTF.
CONCEPTS
What do you want to know about market analysis?
Do you want a hard analysis? You can look for it.
All I want to know is whether the commonly known technical analysis is 'UP' or 'DOWN'.
All I want to know is whether the current market price is going up or down. Not only for the current, but also for the monthly, weekly, and daily status.
I want to make a decision in a moment. Without even thinking about it.
That is why I created a color-coded bar indicator to show the status.
No need to frown anymore.
DETAILS
You need more information about MACD, click here.
tradingview.com
MACD histogram Green ⇒ Bar is green.
MACD histogramRed ⇒ Bar is red.

[FR]Custom Candles/FVG/nSideBarCustom Candles /FVG/ nSideBar
- I used this as a learning project for understanding plot()'s Better
- My goal was to see if I could use normal plots to cleanly plot FVGs on the chart using only plots with out and boxes/lines
The problem was if multiple FVGs were on back to back bars the plot fill would fill the line to the next FVG/Bar
I solved this by using 4 plots and alternating them if consecutive FVGs form
- 2 MODES
- Slim
- Normal
//////////////////////////////////////////////////////////////////////////////////////////////////////////////////////////////////////////////////////////////////////////////
-Slim
Uses 3 plotcandle() parts and divides the candle between body/wicks/open and close
by manipulating the ohlc inputs and the colors I was able to pretty make them full customizable
all components are customizable with up/down colors
-Normal
These are your normal candles but they are full customize able from components to individual up/down colors
--------------------------------------------------------------------------------------------------------------------------------------------------------------------------------------------------------------------------------------------------------
- FVGs
There are 2 FVG settings can be used with both MODES
- Big
These are the FVGs that use plots and since there isn't a 500 object limit on plots you don't need to manage them in the code and they are there how ever far you need to look back
- Slim
These use a Line and the width of the line can be adjusted for user preferences
--------------------------------------------------------------------------------------------------------------------------------------------------------------------------------------------------------------------------------------------------------
- INSIDE-BARS
These will change the color of the body of either SLIM or NORMAL Candles
--------------------------------------------------------------------------------------------------------------------------------------------------------------------------------------------------------------------------------------------------------
Drawing Snap Features Work Just Fine!
I suggest hiding your chart candles with the eye in the top left of the screen and moving the indicator to the top of your object tree
I understand that the candles in the chart pictures are impractical I was just demonstrating the functionality of the tool
Hope You Enjoy!!
FFriZz

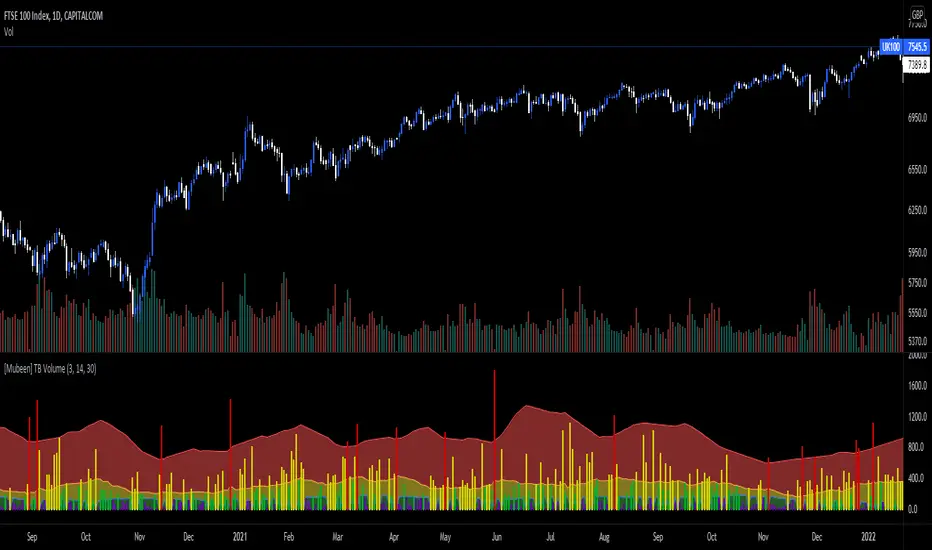
[Mubeen] True Bar VolumeTrue Bar Volume, or TB Volume, is an indicator that measures the volume against the price action that has occurred.
Volume can sometimes be miss leading as it does not necessary show whether it had an impact on the price of the underlying, as one individual (represented as one volume) who has put $100 into the underlying can impact the underlying the same as hundred individuals (represented as hundred volume) putting $1 into the underlying: but the volume will widely differ and can cause confusion for outsiders. With the True Bar indicator, it aims to show abnormal behaviour in the price change against the amount of volume that was stated. It visualises the effect of the volume on the underlying by colour coding the different levels of True Bar results, divided into Red, Yellow, Green, Purple.
Red indicates that the price has changed way out of portion compared with the volume that was seen. It is compared against the highest TB Volume values through selected periods and once the volume as broken out of the high, it is considered an anomaly.
Yellow indicates that the TB Volume values are representing the mean values so it is considered as normal trading activity. Spikes in yellow values can also be seen as rise in high interest in the underlying.
Green indicates that the TB Volume values are under performing in market activity.
Purple indicates that is it a null result as investors might be looking for a better entry into a market, or seen as interest is low in the market.
TB Volume should not be used on it's own as it only gives a reporting measurement of the volume performance, which may be meaningless without the supplementation of other indicators.
Current bar predicted volumeDrag this indicator in the same panel with the volume in the object tree, then right click on the scale bar and set "merge all scale into one" for a correct visualization.
This indicator multiply the current traded volume of a candle with the total time of that candle. This offer a prediction of where, in case the volumes would keep trading at a comparable magnitude, the volume bar would close when the candle will close.
The predicted volume is indicated with a blue short line above the current volume bar, and updates in real time.
I find this indicator extremely useful to offer at a glance an idea of an ascending or descending volume pattern, that can serve as confirmation for a reversal or breakout for example.
Very suitable for short time frames, where decisions have to be taken fast.
Enjoy,
Luca.

TrendStrength Turbo Bars - Directional TrendsMy interpretation of Danielle Shay's popular SimplerTrading TrendStrength Turbo indicator.
The TrendStrength indicator is based on a Fibonacci-based stacked EMA arrangement using the 5, 8, 13, 21 and 34 EMAs:
-> Green bars indicate an uptrend i.e. when the EMAs are positively stacked - there is more upward pressure than downward pressure in the price;
-> Red bars indicate a downtrend i.e. i.e. when the EMAs are negatively stacked - there is more downward pressure on the price; and
-> Yellow bars indicate no strong directional trend and potential for a reversal.
Volume spikes 50% above average volume are then flagged as dots at the bottom of the chart further confirming price momentum.
This indicator should compliment other popular indicators, as confirmation whether to stay in a position or not.
1St Bar GAP+BkOut Screener v2 by RMFirst Bar Gap and subsequent conditions are used as one of the several strategies for Day traders.
This script runs on first bar and checks if the stocks has an initial Gap (up or down), then checks for next bars to be inside the boundaries of the first candle
you can customize this screener according to your requirement. There are a number of very clever people I have taken bits of code and ideas, thanks to you all :)
Used part of this code as published by @PineCoders and Public Libraries. Also add some power query code to help you create the symbols input in the script
Disclaimer: This is not a Financial advisory tool. For education purposes only. * Use at your own risk *
Outline:
gap up/ gap down on 1 min first candle -> good
2nd candle inside 1st candle -> good
3rd to nth candle to break out from first candle range -> good /alert/ Plot flag
//M (Excel power query) code to load and format watchlist from txt file format
//Input: , Output:
let
// replace and for the correspondign values in your computer
Source = Csv.Document(File.Contents("C:\ \ "), ),
#"Transposed Table" = Table.Transpose(Source),
#"Sorted Rows" = Table.Sort(#"Transposed Table",{{"Column1", Order.Ascending}}),
#"Added Index" = Table.AddIndexColumn(#"Sorted Rows", "Index", 1, 1, Int64.Type),
#"Changed Type1" = Table.TransformColumnTypes(#"Added Index",{{"Index", type text}}),
#"Inserted Merged Column1" = Table.AddColumn(#"Changed Type1", "Merged", each Text.Combine({"0", }), type text),
#"Inserted First Characters" = Table.AddColumn(#"Inserted Merged Column1", "Two Characters", each Text.End( , 2), type text),
#"Removed Columns" = Table.RemoveColumns(#"Inserted First Characters",{"Index", "Merged"}),
#"Inserted Merged Column" = Table.AddColumn(#"Removed Columns", "Merged", each Text.Combine({"s", , " = input( '", , "' , type=input.string)"}), type text)
in
#"Inserted Merged Column"
//--> once input string is created Copy&Paste in this code after // Symbols _ Use Power Query in Excel
// end of M code to load watchlist from txt format
