CAGR - Candle based BackTesterThe "CAGR - Candle based BackTester" is a tool for traders and investors seeking precise insights into individual candle performance!
Do you want to backtest based on candles and understand their CAGR? Curious about the average CAGR of all candles? Interested in comparing how an individual candle performs against others? Then this tool is your go-to solution.
How It Works:
Candle Selection: Specify a start date, and watch as the script tracks investments from that point forward.
Dynamic Calculations: Experience real-time CAGR calculations that adapt as market conditions evolve.
CAGR Display: At the final candle, gain insights into individual CAGR, average CAGR of all candles, alpha (difference), and outperformance percentage—all conveniently displayed for informed decision-making.
Key Features:
Accurate Candle-based CAGR Calculation: Gain clarity on investment performance with precise CAGR metrics.
Lumpsum Investment Tracking: Track lumpsum investments seamlessly with detailed share and investment calculations.
Outperformance Metrics: Measure how your investment performs relative to others with dedicated outperformance metrics.
User-Friendly Visualization: Access intuitive charts and visuals that simplify complex financial data.
Wyszukaj w skryptach "backtest"

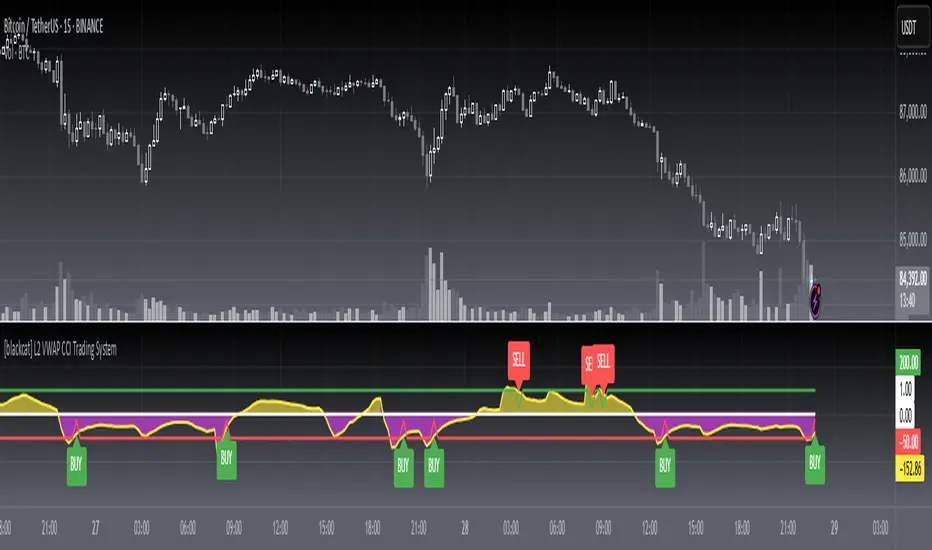
[blackcat] L2 VWAP CCI Trading SystemLevel: 2
Background
Volume-Weighted Average Price (VWAP) is a trading benchmark used by traders that indicates the average price that a security has traded for throughout the day based on volume and price. This is important as it gives traders insight into the trend and value of a security.
The Commodity Channel Index (CCI) indicator was created to identify bullish and bearish market cycles, as well as to define market turning points and the strongest and weakest market periods. CCI was developed for commodities and quickly found application in other markets, including forex.
Function
blackcat L2 VWAP CCI Trading System is an innovative indicator that combines vwap and cci indicator together. Not only long and short entries can be disclosed, but also the overbought and oversold zones are clearly observed.
Key Signal
cci ---> vwap cci indicator output
long --> long entry condition
short --> short entry condition
backtest --> indicator backtest scheme "NLX-L3 Backtest" required input source for strategy backtest
longentry --> visual long entry
shortentry --> visual short entry
Pros and Cons
Pros:
1. exact long and short entries are produced by overbought and oversold conditions
2. support "NLX-L3 Backtest" framework
Cons:
1. noise may be produced under extreme market condition
2. due to this is un-optimized version, time frame and trading pairs need to be selected
Remarks
Courtesy of @nilux "NLX-L3 Backtest" easy backtest framework for dummies.
Step by step backtest guide with "NLX-L3 Backtest" framework:
STEP1: Add this indicator into your chart
STEP2: Add "NLX-L3 Backtest" into your chart
STEP3: Click "Settings" gear icon of "NLX-L3 Backtest" to select "Select L2 Indicator" in the 1st line as "blackcat L2 VWAP CCI Trading System: backtest"
STEP4: Configure your backtest other settings under "NLX-L3 Backtest" framework
STEP5: Click "OK" and view the results in "Strategy Tester" tab
Readme
In real life, I am a prolific inventor. I have successfully applied for more than 60 international and regional patents in the past 12 years. But in the past two years or so, I have tried to transfer my creativity to the development of trading strategies. Tradingview is the ideal platform for me. I am selecting and contributing some of the hundreds of scripts to publish in Tradingview community. Welcome everyone to interact with me to discuss these interesting pine scripts.
The scripts posted are categorized into 5 levels according to my efforts or manhours put into these works.
Level 1 : interesting script snippets or distinctive improvement from classic indicators or strategy. Level 1 scripts can usually appear in more complex indicators as a function module or element.
Level 2 : composite indicator/strategy. By selecting or combining several independent or dependent functions or sub indicators in proper way, the composite script exhibits a resonance phenomenon which can filter out noise or fake trading signal to enhance trading confidence level.
Level 3 : comprehensive indicator/strategy. They are simple trading systems based on my strategies. They are commonly containing several or all of entry signal, close signal, stop loss, take profit, re-entry, risk management, and position sizing techniques. Even some interesting fundamental and mass psychological aspects are incorporated.
Level 4 : script snippets or functions that do not disclose source code. Interesting element that can reveal market laws and work as raw material for indicators and strategies. If you find Level 1~2 scripts are helpful, Level 4 is a private version that took me far more efforts to develop.
Level 5 : indicator/strategy that do not disclose source code. private version of Level 3 script with my accumulated script processing skills or a large number of custom functions. I had a private function library built in past two years. Level 5 scripts use many of them to achieve private trading strategy.
Customizable MACD (how to detect a strong convergence)Helloooo traders
I wondered once if a MACD was based on an EMA/EMA/SMA or SMA/SMA/EMA (or WHATEVA/WHATEVA/WHATEVA).
Seems they're so many alternatives out there.
I decided to empower my audience more by choosing the type of moving averages you want for your MACD.
More options doesn't always mean better performance - but who knows - some might find a config that they like with it for their favorite asset/timeframe.
I added also a multi-timeframe component because I'm a nice guy ^^
Convergence is my BEST friend
An oscillator (like MACD) is to measure how strong a momentum is - generally, traders use those indicators to confirm a trend.
So understand that a MACD (or any other indicator not based on convergence ) won't likely be sufficient for doing great on the market.
Combined with your favorite indicator, however, you may get great results.
My indicators fav cocktail is mixing :
1) an oscillator (momentum confirmation)
2) a trendline/key level break (momentum confirmation)
3) adding-up on a different trading method but still converging with the first entry.
The reason I'm deep with convergence detection is because I'm obsessed with removing those fakeout signals. You know which ones I'm talking about :)
Those trades when the market goes sideways but our capital goes South (pun 100% intended) - 2 days later, the price hasn't changed much but some lost some capital due to fees, being overexposed, buying the top/selling the bottom of a range they didn't identify.
It's publicly known that ranges are the worst traders' enemy. It's boring, not fun, and .... end up moving in the direction we expected when we go to sleep or outside.
NO ONE/BROKER/EX-GF is tracking your computer - I checked also for mine as it happened for me way too often in the past.
I surely preferred blaming a few external unknown conditions than improving my TA back in the days #bad #dave
But my backtest sir...
Our backtests show what they're being told to show . A backtest without a stop-loss/hard exit logic will show incredible results.
Then trying that backtest with live trading is like in the Matrix movie - discovering the real world is tough and we must choose between the blue pill (learning how to evaluate properly risk/opportunity caught) and the red pill (increasing the position sizing, not setting a stop loss, holding the positions hoping for the best)
Last few words
Convergences aren't invented because it's cool to mix indicators with others. (it is actually and even fun)
They're created to remove most of the fakeouts . For those that can't be removed - a strong risk management would cut most of the remaining potential big losses.
No system works 100% of the time - so a convergence system needs a back-up plan in case the converged signal is wrong (could be stop-loss, hard exit, reducing position sizing, ...)
Wishing you the BEST and happy beginning of your week
Daveatt

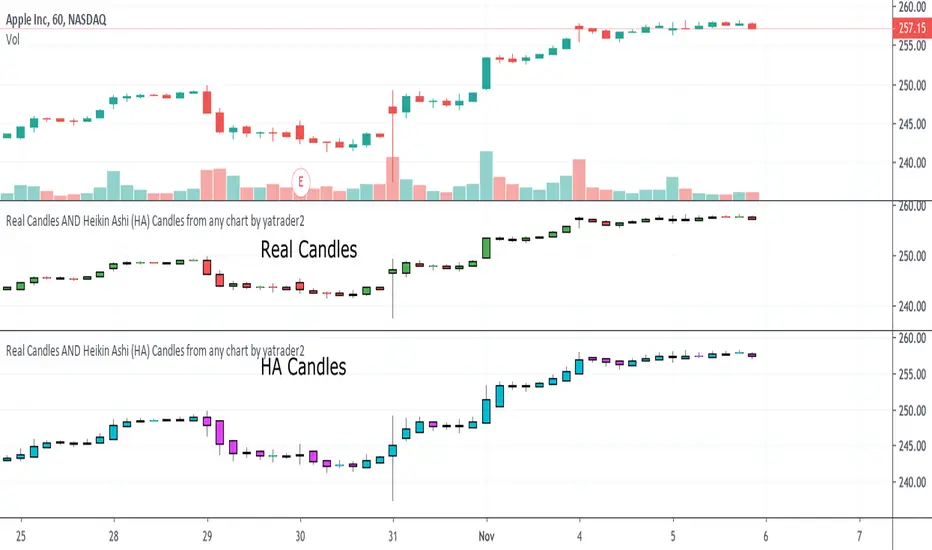
Real Candles Heikin Ashi (HA) Candle functionsThis script plots both real and HA candles regardless or which are used on the chart in TV settings.
(and has the functions for you to use.)
Lots of people seem to misunderstand backtesting (or scam people) based on HA candles.
Backtesting with HA candles leads to impossible trades. ALWAYS backtest with real candles.
That doesn't mean you might not want to look at HA candle values to make trading decisions.
Add the code below to calculate HA candles from real and use that in your HA trading algo,
but test it on real charts.
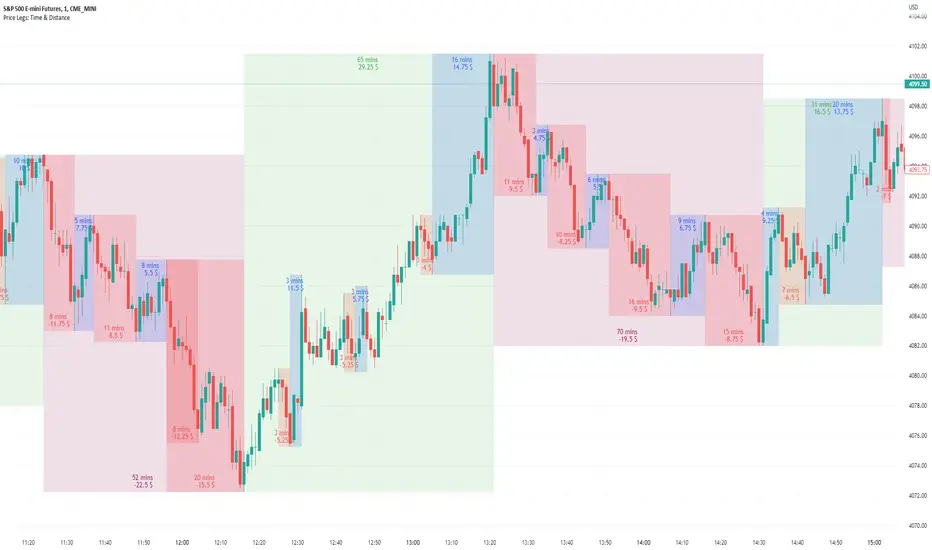
Price Legs: Time & Distance. Measuring moves in time & price-Tool to measure price legs in terms of both time and price; gives an idea of frequency of market movements and their typical extent and duration.
-Written for backtesting: seeing times of day where setups are most likely to unfold dynamically; getting an idea of typical and minimum sizes of small/large legs.
-Two sets of editable lookback numbers to measure both small and large legs independently.
-Works across timeframes and assets (units = mins/hours/days dependent on timeframe; units = '$' for indices & futures, 'pips' for FX).
~toggle on/off each set of bull/bear boxes.
~choose lookback/forward length for each set. Increase number for larger legs, decrease for smaller legs.
(for assets outside of the big Indices and FX, you may want to edit the multiplier, pMult, on lines 23-24)
small legs
large legs
Divergence BacktesterThere is n number of possible ways in which we can backtest divergence and this is just a start :)
In this script, we are trying to count how many times the pivots made HH, HL, LH, LL after a particular divergence state.
An example of using data is as below:
The script keeps track of each pivot sentiment and resulting next pivot state. As mentioned in the chart snapshot, we can look at two of the previous pivot states and collect stats on how each of these state impacted price action.
As mentioned before, this is just tip of iceberg. Further combinations for which we can do backtest are:
1. m X n combinations of last pivot and last to last pivot divergence state
2. divergence combined with double divergence state.
Only issue to explore further is lack of space on the chart as tables can take up huge space.
PS: As you can see based on historical stats, probability of divergence impacting the change of trend is very low in most cases.

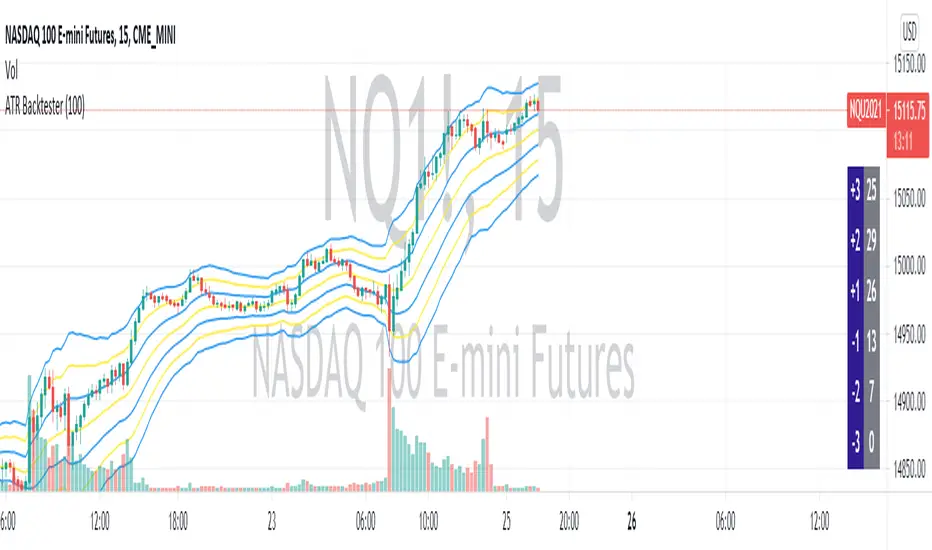
ATR BacktesterATR backtester... input the desired number of bars backwards (I'd recommend 100 or so), and then it'll spit out in the columns on the right side of the screen how many times each ATR was hit. Helps to tell at a glance where bullish and bearish is for the stock. May not be insanely useful since you can just look at the chart, but feel free to use the code yourself for something.
Breakout Probability (Expo)█ Overview
Breakout Probability is a valuable indicator that calculates the probability of a new high or low and displays it as a level with its percentage. The probability of a new high and low is backtested, and the results are shown in a table— a simple way to understand the next candle's likelihood of a new high or low. In addition, the indicator displays an additional four levels above and under the candle with the probability of hitting these levels.
The indicator helps traders to understand the likelihood of the next candle's direction, which can be used to set your trading bias.
█ Calculations
The algorithm calculates all the green and red candles separately depending on whether the previous candle was red or green and assigns scores if one or more lines were reached. The algorithm then calculates how many candles reached those levels in history and displays it as a percentage value on each line.
█ Example
In this example, the previous candlestick was green; we can see that a new high has been hit 72.82% of the time and the low only 28.29%. In this case, a new high was made.
█ Settings
Percentage Step
The space between the levels can be adjusted with a percentage step. 1% means that each level is located 1% above/under the previous one.
Disable 0.00% values
If a level got a 0% likelihood of being hit, the level is not displayed as default. Enable the option if you want to see all levels regardless of their values.
Number of Lines
Set the number of levels you want to display.
Show Statistic Panel
Enable this option if you want to display the backtest statistics for that a new high or low is made. (Only if the first levels have been reached or not)
█ Any Alert function call
An alert is sent on candle open, and you can select what should be included in the alert. You can enable the following options:
Ticker ID
Bias
Probability percentage
The first level high and low price
█ How to use
This indicator is a perfect tool for anyone that wants to understand the probability of a breakout and the likelihood that set levels are hit.
The indicator can be used for setting a stop loss based on where the price is most likely not to reach.
The indicator can help traders to set their bias based on probability. For example, look at the daily or a higher timeframe to get your trading bias, then go to a lower timeframe and look for setups in that direction.
-----------------
Disclaimer
The information contained in my Scripts/Indicators/Ideas/Algos/Systems does not constitute financial advice or a solicitation to buy or sell any securities of any type. I will not accept liability for any loss or damage, including without limitation any loss of profit, which may arise directly or indirectly from the use of or reliance on such information.
All investments involve risk, and the past performance of a security, industry, sector, market, financial product, trading strategy, backtest, or individual's trading does not guarantee future results or returns. Investors are fully responsible for any investment decisions they make. Such decisions should be based solely on an evaluation of their financial circumstances, investment objectives, risk tolerance, and liquidity needs.
My Scripts/Indicators/Ideas/Algos/Systems are only for educational purposes!

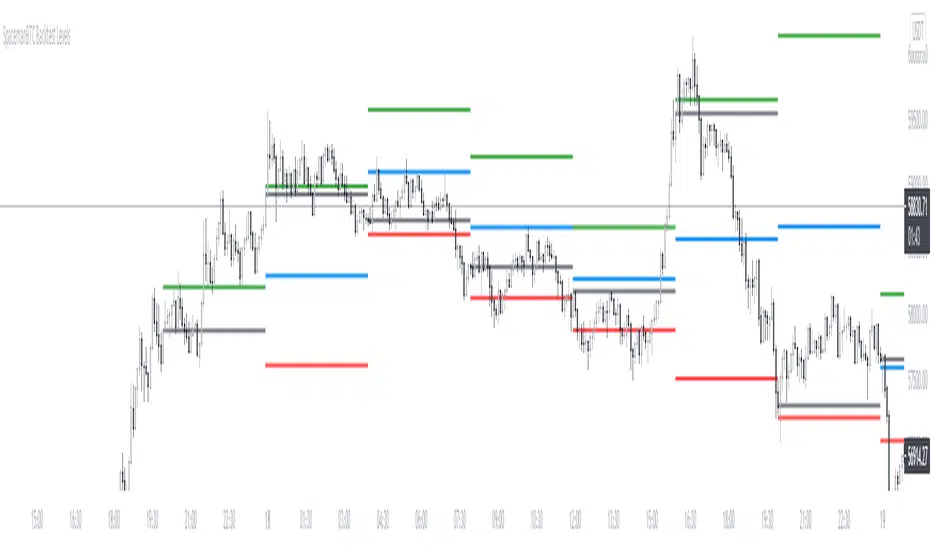
Key Levels CustomTF + Backtest: SpacemanBTCKey Levels Backtest, same logic as the key levels script, provide levels based:
High, Low, Mid and Close.
This was requested, took a long time to post as I fell sick and was given a lot of Dev Work.
Hope this helps those who use it, very useful to see liquidity grabs in my opinion.
Input time in minutes!
Result of a user request.
HL/2 Fast & Slow - Cloud Signals + Backtest + Exit AlarmsDescription:
This indicator plots two HL/2 moving averages—a fast and a slow line—on the chart, along with dynamic upper and lower bands based on the slow line and ATR. It features a colored cloud between the two averages to visualize trend direction, and it provides buy/sell signals based on the alignment of the two lines.
Key Features:
Fast & Slow HL/2 Averages
Fast and slow HL/2 lines calculated as simple moving averages.
Lines change color based on direction (up/down), configurable via style settings.
Dynamic Upper and Lower Bands
Bands calculated from the slow line using ATR to capture volatility.
Trend Cloud
Fills the area between fast and slow lines.
Green if both lines are rising, red if both are falling, gray if lines disagree.
Transparency adjustable for better visual clarity.
Buy/Sell Signals
Signals appear only when both lines align in the same direction.
Two modes available:
Series Signals: generates a signal whenever the cloud color changes.
Single Signal: generates a signal only when the slow line changes direction.
Signals are plotted as small triangles above/below bars.
Alerts can be set for both buy/sell signals.
Exit Modes and Alerts
Exit positions either on a reverse signal or when the cloud enters a neutral gray zone.
Exit alerts are available for both conditions.
Integrated Backtest Panel
Shows total trades, win rate, and cumulative profit in USD.
Considers position size and commission (configurable).
Panel color indicates profit (green) or loss (red).
Fixed position on chart for easy reference.
Inputs:
Fast and slow periods, ATR length, ATR multiplier.
Position size, commission percentage.
Signal mode (Series or Single).
Exit mode (Reverse Signal or Gray Area).
Style options for line colors and cloud colors.
Time window for backtesting (daily, weekly, monthly, or custom date range).
Usage:
Ideal for identifying trend direction and potential entry points.
Can be used for manual trading or as part of an automated strategy with alerts.
Provides a visual and statistical overview of trading performance via the backtest panel.

Portfolio Simulator & BacktesterMulti-asset portfolio simulator with different metrics and ratios, DCA modeling, and rebalancing strategies.
Core Features
Portfolio Construction
Up to 5 assets with customizable weights (must total 100%)
Support for any tradable symbol: stocks, ETFs, crypto, indices, commodities
Real-time validation of allocations
Dollar Cost Averaging
Monthly or Quarterly contributions
Applies to both portfolio and benchmark for fair comparison
Model real-world investing behavior
Rebalancing
Four strategies: None, Monthly, Quarterly, Yearly
Automatic rebalancing to target weights
Transaction cost modeling (customizable fee %)
Key Metrics Table
CAGR: Annualized compound return (S&P 500 avg: ~10%)
Alpha: Excess return vs. benchmark (positive = outperformance)
Sharpe Ratio: Return per unit of risk (>1.0 is good, >2.0 excellent)
Sortino Ratio: Like Sharpe but only penalizes downside (better metric)
Calmar Ratio: CAGR / Max Drawdown (>1.0 good, >2.0 excellent)
Max Drawdown: Largest peak-to-trough decline
Win Rate: % of positive days (doesn't indicate profitability)
Visualization
Dual-chart comparison - Portfolio vs. Benchmark
Dollar or percentage view toggle
Customizable colors and line width
Two tables: Statistics + Asset Allocation
Adjustable table position and text size
🚀 Quick Start Guide
Enter 1-5 ticker symbols (e.g., SPY, QQQ, TLT, GLD, BTCUSD)
Make sure percentage weights total 100%
Choose date range (ensure chart shows full period - zoom out!)
Configure DCA and rebalancing (optional)
Select benchmark (default: SPX)
Analyze results in statistics table
💡 Pro Tips
Chart data matters: Load SPY or your longest-history asset as main chart
If you select an asset that was not available for the selected period, the chart will not show up! E.g. BTCUSD data: Only available from ~2017 onwards.
Transaction fees: 0.1% default (adjust to match your broker)
⚠️ Important Notes
Requires visible chart data (zoom out to show full date range)
Limited by each asset's historical data availability
Transaction fees and costs are modeled, but taxes/slippage are not
Past performance ≠ future results
Use for research and education only, not financial advice
Let me know if you have any suggestions to improve this simulator.

Daily Candle Bias Backtesting Stats @MaxMaserati This indicator, is a powerful backtesting and probability tool designed to quantify the "follow-through" of specific candle types across different market sessions.
It identifies specific price action setups and tracks whether price hits a "Target" (continuation) or an "Invalidation" (reversal) first, providing real-time win rates for your favorite sessions.
The Candle Bias Stats indicator automatically categorizes every candle based on the MMM candle bias and tracks their historical success rate. It calculates how often a candle's high/low is broken before its opposite end is touched. By breaking this data down into sessions (Asian, London, NY), it identifies high-probability "time-of-day" windows where specific price action setups are most reliable.
MMM CANDLE LOGIC
Bullish Expansion & Breakout Signatures
Bullish Body Close Plus (BuBC Plus): Represents strong bullish momentum where price closes above the previous high and near its own top, signaling that buyers are in complete control.
Bullish Body Close Minus (BuBC Minus): Indicates weak bullish momentum; while the price closes above the previous high, a long top wick shows sellers pushed back, suggesting a potential retest of the previous high.
Bearish Expansion & Breakout Signatures
Bearish Body Close Plus (BeBC Plus): A very strong bearish signal where price closes below the previous low and near its own bottom, indicating sellers are dominant.
Bearish Body Close Minus (BeBC Minus): Signifies weak bearish momentum; the price breaks the previous low but finishes with a long bottom wick as buyers push back, often leading to a retest of the old ceiling.
Bullish Reversal & Trap Signatures (Affinity)
Bullish Affinity Plus (BuAF Plus): A strong bullish reversal where a new low is made, but sellers hit a wall and get trapped, causing price to finish near its top with a long bottom wick.
Bullish Affinity Minus (BuAF Minus): A weak bullish bounce where a new low is made and price finishes back inside the previous range, but buyers lack the energy for a significant move.
Bearish Reversal & Trap Signatures (Affinity)
Bearish Affinity Plus (BeAF Plus): A strong bearish reversal; buyers are trapped after making a new high, and price finishes near its bottom with a long top wick.
Bearish Affinity Minus (BeAF Minus): A weak bearish drop where sellers stop the rise but lack the energy to push price significantly lower.
Neutral & Volatility Signatures
Close Inside Bullish (CI•BuAF): Bullish neutral state where price stays inside the previous candle’s range but finishes in the top half, indicating buyers are slightly more active.
Close Inside Bearish (CI•BeAF): Bearish neutral state where price remains inside the previous box and finishes in the bottom half.
Seek & Destroy Bullish (S&D•BuAF): Bullish volatility characterized by price moving above and below the previous candle before buyers win the battle and close price near the top.
Seek & Destroy Bearish (S&D•BeAF): Bearish volatility where sellers win a high-chaos battle, closing price near the bottom after sweeping both sides of the previous candle.
H4 CANDLE EXAMPLE
Deep Dive: Analysis of the 4H Statistics
The image presents a comprehensive backtest of 4,999 total candles from September 2022 to December 2025. Here is the breakdown of what the interface is telling us:
1. The Strategy: Target vs. Invalidation
The indicator tracks BuBC (Bullish Body Close) and BeBC (Bearish Body Close).
The Target: For a Bullish candle, the target is the High. For a Bearish candle, it is the Low.
The Invalidation: The opposite end of the candle (the Low for Bullish, the High for Bearish).
The Goal: To see which level is touched first in the subsequent bars.
2. Global Performance (The Top Right Table)
Looking at the BuBC (1402 samples) section:
Target First (67.8%): In nearly 7 out of 10 cases, once a 4H candle closes "bullish" (breaking the previous high), the price continues higher to break its own high before it ever returns to take out its own low.
Both Hit (17.7%): This is a critical metric. It represents "Stop Runs" or "Wicks" where price hits the target but also hits the invalidation within the same tracking period.
Efficiency (1.3 Bars): This tells us the "follow-through" is almost immediate. If the trade doesn't work within 1 or 2 candles, the statistical edge drops off significantly.
3. The Session Breakdown (The Bottom Left Table)
This is where the "Edge" is found. Not all hours of the day are created equal.
Asian Late (02:00-06:00) – The "Star" Performer: With a 72.9% Target rate, this is labeled "BEST." It has the lowest "Both%" (6.5%), meaning moves during these hours are incredibly "clean." If a setup forms here, price usually moves directly to the target without looking back.
London Open & Overlap (06:00-14:00): These sessions maintain a high win rate (approx. 70%). This suggests that the European session provides reliable trend continuation for the S&P 500.
NY Session (14:00-18:00) – The "Trap" Zone: This is labeled "WORST" for a reason. While the win rate is basically a coin flip (49.6%), the Both% spikes to 36.7%. This means that even if you are right about the direction, the market is highly likely to "sweep" your stop loss before going to the target. It is the most volatile and "fake-out" prone time for this specific setup.
Summary of the Data
The statistics show that the S&P 500 4H Candle Bias is a highly reliable trend-following indicator, provided you trade it at the right time.
The data suggests a clear three-step logic:
Directional Edge: Both Bullish and Bearish body closes have a natural ~67% probability of continuation.
Timing is Everything: Trading during the Late Asian and London sessions increases your probability of success to over 70% with very low risk of a "fake-out."
Risk Warning: Avoid "Body Close" breakout strategies during the NY Mid-day (14:00-18:00). The statistics prove that this window is dominated by "Seek and Destroy" price action, where price is mathematically likely to hit both your target and your stop, usually hitting the stop first.

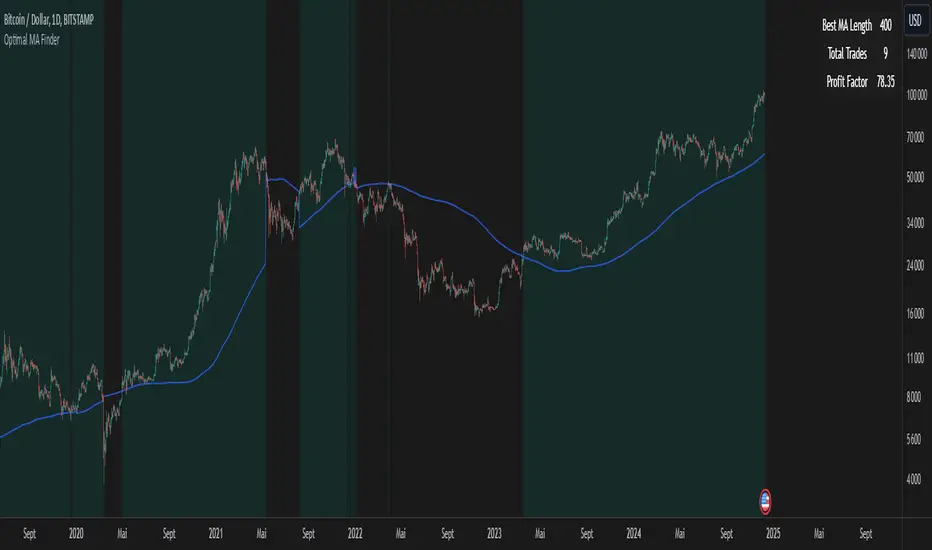
Optimal MA FinderIntroduction to the "Optimal MA Finder" Indicator
The "Optimal MA Finder" is a powerful and versatile tool designed to help traders optimize their moving average strategies. This script combines flexibility, precision, and automation to identify the most effective moving average (MA) length for your trading approach. Whether you're aiming to improve your long-only strategy or implement a buy-and-sell methodology, the "Optimal MA Finder" is your go-to solution for enhanced decision-making.
What Does It Do?
The script evaluates a wide range of moving average lengths, from 10 to 500, to determine which one produces the best results based on historical data. By calculating critical metrics such as the total number of trades and the profit factor for each MA length, it identifies the one that maximizes profitability. It supports both simple moving averages (SMA) and exponential moving averages (EMA), allowing you to tailor the analysis to your preferred method.
The logic works by backtesting each MA length against the price data and assessing the performance under two strategies:
Buy & Sell: Includes both long and short trades.
Long Only: Focuses solely on long positions for more conservative strategies.
Once the optimal MA length is identified, the script overlays it on the chart, highlighting periods when the price crosses over or under the optimal MA, helping traders identify potential entry and exit points.
Why Is It Useful?
This indicator stands out for its ability to automate a task that is often labor-intensive and subjective: finding the best MA length. By providing a clear, data-driven answer, it saves traders countless hours of manual testing while significantly enhancing the accuracy of their strategies. For example, instead of guessing whether a 50-period EMA is more effective than a 200-period SMA, the "Optimal MA Finder" will pinpoint the exact length and type of MA that has historically yielded the best results for your chosen strategy.
Key Benefits:
Precision: Identifies the MA length with the highest profit factor for maximum profitability.
Automation: Conducts thorough backtesting without manual effort.
Flexibility: Adapts to your preferred MA type (SMA or EMA) and trading strategy (Buy & Sell or Long Only).
Real-Time Feedback: Provides actionable insights by plotting the optimal MA directly on your chart and highlighting relevant trading periods.
Example of Use: Imagine you're trading a volatile stock and want to optimize your long-only strategy. By applying the "Optimal MA Finder," you discover that a 120-period EMA results in the highest profit factor. The indicator plots this EMA on your chart, showing you when to consider entering or exiting positions based on price movements relative to the EMA.
In short, the "Optimal MA Finder" empowers traders by delivering data-driven insights and improving the effectiveness of trading strategies. Its clear logic, combined with robust automation, makes it an invaluable tool for both novice and experienced traders seeking consistent results.
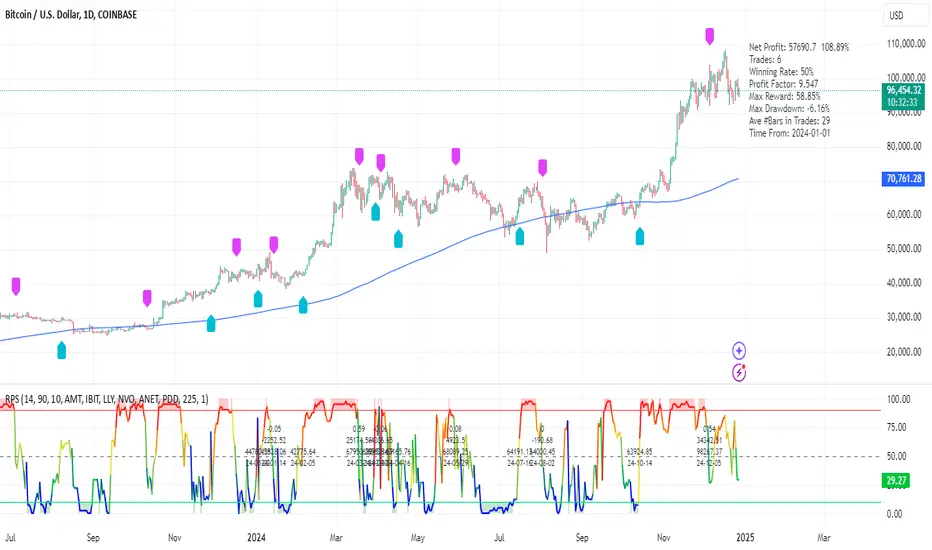
RPS Trading Signals & Backtesting
Overview:
The Enhanced Relative Price Strength (RPS) Indicator is designed for trend traders looking to identify the relative strength of stocks within a select universe. By comparing the price movements of chosen stocks over a specified period, this indicator helps traders make informed decisions about potential buying and selling opportunities.
Key Features:
Relative Strength Ranking: Our RPS indicator ranks the price performance of individual stocks against a curated selection, enabling users to pinpoint which stocks are exhibiting relative strength or weakness.
Customizable Stock Universe: The script evaluates 40 stocks, which include 30 high-weight NDX100 stocks, 4 major index ETFs (SPY, QQQ, DIA, IWM), and allows for the addition of 6 user-defined custom stocks.
Dynamic Color Gradients: The visual representation of the RPS score utilizes a gradient color scheme ranging from purple at low scores to red at high scores, leveraging the color for clear, immediate insight into stock performance.
Threshold Visualization: Users can set specific high (default 85) and low (default 15) thresholds for RPS, highlighted with solid line indicators and area fills. This visual aspect aids traders in quickly spotting entry and exit points.
Trading Signal Generation: The script includes logic for generating buy and sell signals according to defined RPS behaviors relative to the set thresholds, factoring in market conditions based on a long-term moving average.
Backtesting Capabilities: Users can backtest trading signals by inputting desired start and end dates, allowing traders to evaluate the effectiveness of the RPS strategy on historical data for various assets including stocks and cryptocurrencies (e.g., NVDA, LLY, GOOG, BTC, ETH, SOL).
User-Friendly Options: The script allows for adjustments such as moving average lengths, visibility of trading signals, and fills for ease of use and customization according to trading preferences.
How It Works:
The RPS Indicator functions by calculating the performance of stocks relative to each other. Based on the RPS trends, the indicator identifies when to enter or exit trades, providing a framework to capitalize on market movements.
Conclusion:
The Enhanced RPS Indicator aims to empower traders with a powerful analytical tool in their arsenal, tailored to simplify decision-making and bolster trading strategies. As this script evolves, we encourage feedback and collaboration from users to refine and enhance its capabilities further.
Trade Less, Earn More!
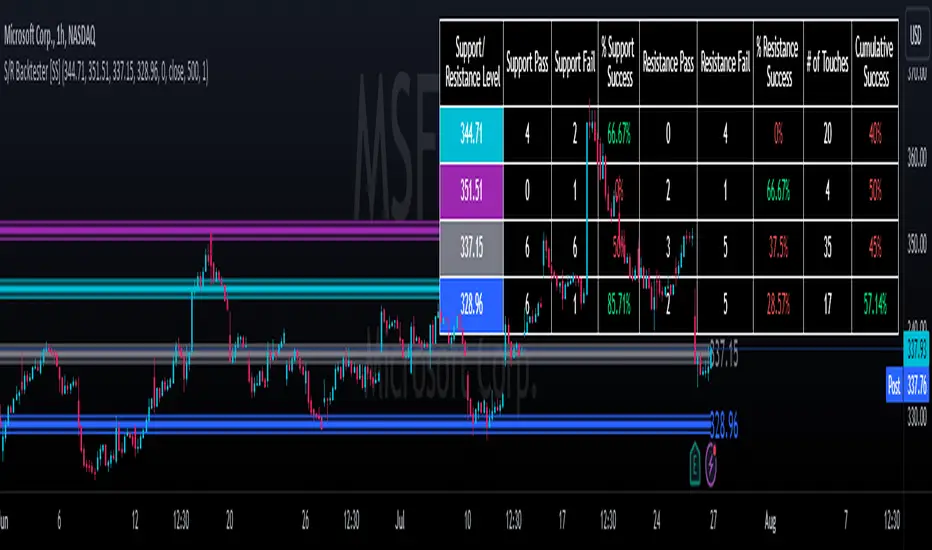
Support and Resistance Backtester [SS]Hey everyone,
Excited to release this indicator I have been working on.
I conceptualized it as an idea a while ago and had to nail down the execution part of it. I think I got it to where I am happy with it, so let me tell you about it!
What it does?
This provides the user with the ability to quantify support and resistance levels. There are plenty of back-test strategies for RSI, stochastics, MFI, any type of technical based indicator. However, in terms of day traders and many swing traders, many of the day traders I know personally do not use or rely on things like RSI, stochastics or MFI. They actually just play the support and resistance levels without attention to anything else. However, there are no tools available to these people who want to, in a way, objectively test their identified support and resistance levels.
For me personally, I use support and resistance levels that are mathematically calculated and I am always curious to see which levels:
a) Have the most touches,
b) Have provided the most support,
c) Have provided the most resistance; and,
d) Are most effective as support/resistance.
And, well, this indicator answers all four of those questions for you! It also attempts to provide some way to support and resistance traders to quantify their levels and back-test the reliability and efficacy of those levels.
How to use:
So this indicator provides a lot of functionality and I think its important to break it down part by part. We can do this as we go over the explanation of how to use it. Here is the step by step guide of how to use it, which will also provide you an opportunity to see the options and functionality.
Step 1: Input your support and resistance levels:
When we open up the settings menu, we will see the section called "Support and Resistance Levels". Here, you have the ability to input up to 5 support and resistance levels. If you have less, no problem, simply leave the S/R level as 0 and the indicator will automatically omit this from the chart and data inclusion.
Step 2: Identify your threshold value:
The threshold parameter extends the range of your support and resistance level by a desired amount. The value you input here should be the value in which you would likely stop out of your position. So, if you are willing to let the stock travel $1 past your support and resistance level, input $1 into this variable. This will extend the range for the assessment and permit the stock to travel +/- your threshold amount before it counts it as a fail or pass.
Step 3: Select your source:
The source will tell the indicator what you want to assess. If you want to assess close, it will look at where the ticker closes in relation to your support and resistance levels. If you want to see how the highs and lows behave around the S/R levels, then change the source to High or Low.
It is recommended to leave at close for optimal results and reliability however.
Step 4: Determine your lookback length:
The lookback length will be the number of candles you want the indicator to lookback to assess the support and resistance level. This is key to get your backtest results.
The recommendation is on timeframes 1 hour or less, to look back 300 candles.
On the daily, 500 candles is recommended.
Step 5: Plot your levels
You will see you have various plot settings available to you. The default settings are to plot your support and resistance levels with labels. This will look as follows:
This will plot your basic support and resistance levels for you, so you do not have to manually plot them.
However, if you want to extend the plotted support and resistance level to visually match your threshold values, you can select the "Plot Threshold Limits" option. This will extend your support and resistance areas to match the designated threshold limits.
In this case on MSFT, I have the threshold limit set at $1. When I select "Plot Threshold Limits", this is the result:
Plotting Passes and Fails:
You will notice at the bottom of the settings menu is an option to plot passes and plot fails. This will identify, via a label overlaid on the chart, where the support and resistance failures and passes resulted. I recommend only selecting one at a time as the screen can get kind of crowded with both on. here is an example on the MSFT chart:
And on the larger timeframe:
The chart
The chart displays all of the results and counts of your support and resistance results. Some things to pay attention to use the chart are:
a) The general success rate as support vs resistance
Rationale: Support levels may act as resistance more often than they do support or vice versa. Let's take a look at MSFT as an example:
The chart above shows the 334.07 level has acted as very strong support. It has been successful as support almost 82% of the time. However, as resistance, it has only been successful 33% of the time. So we could say that 334 is a strong key support level and an area we would be comfortable longing at.
b) The number of touches:
Above you will see the number of touches pointed out by the blue arrow.
Rationale: The number of touches differs from support and resistance. It counts how many times and how frequently a ticker approaches your support and/or resistance area and the duration of time spent in that area. Whereas support and resistance is determined by a candle being either above or below a s/r area, then approaching that area and then either failing or bouncing up/down, the number of touches simply assesses the time spent (in candles) around a support or resistance level. This is key to help you identify if a level has frequent touches/consolidation vs other levels and can help you filter out s/r levels that may not have a lot of touches or are infrequently touched.
Closing comments:
So this is pretty much the indicator in a nutshell. Hopefully you find it helpful and useful and enjoy it.
As always let me know your questions/comments and suggestions below.
As always I appreciate all of you who check out, try out and read about my indicators and ideas. I wish you all the safest trades and good luck!
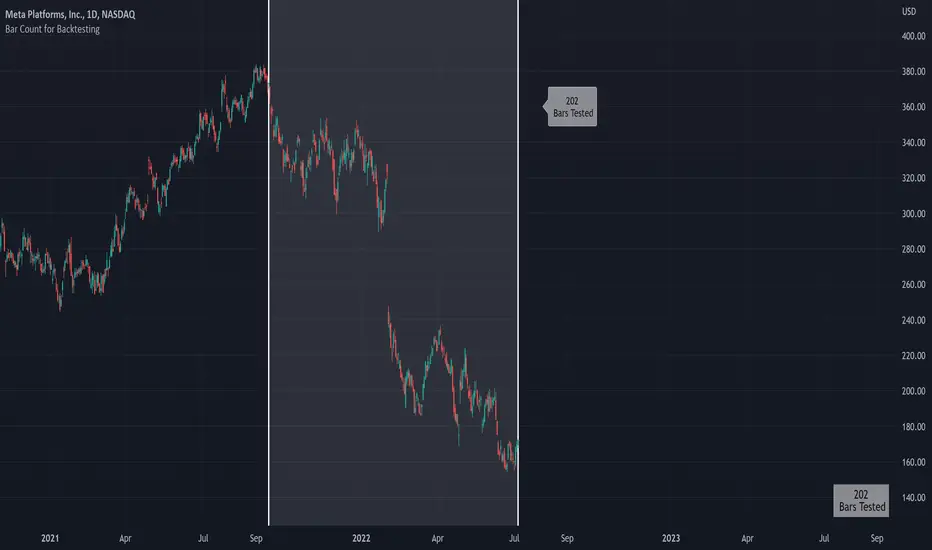
Bar Count for BacktestingHello!
Not much special about this script; you can use date & time, or bar count, to ascertain the number of bars in a time period for backtesting.
This script can be used in conjunction with large scripts incorporating complex intricacies that won't load on 20,000+ bar data sets.
If your script's load time transcends the TV allotted load time - use this script to quickly determine the number of bars in the data set.
Through trial & error you should be able to determine the approximate number of bars your script can execute on without exceeding the imposed time limit!
The image above shows a user-defined time window and, consequently, the script returns the number of bars that constitute the time period.
You can drag the white vertical lines to efficiently configure the calculated time period.
The image above shows functionality for the "Bars Back" feature.
Enjoy!
RSI Signal Backtest Bounce AlertRSI crosses below 5min signal line, bounce above 50 RSI and crosses bullish back above signal line. Once it backtests signal the indicator will fire.

Multi-MA Strategy Analyzer with BacktestMulti-MA Strategy Analyzer with Backtest
This TradingView Pine Script indicator is designed to analyze multiple moving averages (SMA or EMA) dynamically and identify the most profitable one based on historical performance.
Features
Dynamic MA Range:
Specify a minLength, maxLength, and step size.
Automatically calculates up to 20 MAs.
Custom MA Calculation:
Uses custom SMA and EMA implementations to support dynamic length values.
Buy/Sell Logic:
Buy when price crosses above a MA.
Sell when price crosses below.
Supports both long and short trades.
Performance Tracking:
Tracks PnL, number of trades, win rate, average profit, and drawdown.
Maintains individual stats for each MA.
Best MA Detection:
Automatically highlights the best-performing MA.
Optional showBestOnly toggle to focus only on the best line and its stats.
Visualization:
Up to 20 plot() calls (static) for MAs.
Green highlight for the best MA.
Color-coded result table and chart.
Table View
When showBestOnly = false, the table displays all MAs with stats.
When showBestOnly = true, the table displays only the best MA with a summary row.
Includes:
Best MA length
Total PnL
Number of trades
Win rate
Avg PnL per trade
Max Drawdown
Configuration
minLength (default: 10)
maxLength (default: 200)
step (default: 10)
useEMA: Toggle between EMA and SMA
showBestOnly: Focus on best-performing MA only
Notes
MA plotting is static, limited to 20 total.
Table supports highlighting and is optimized for performance.
Script is structured to run efficiently using arrays and simple int where required.
Potential Extensions
Add visual buy/sell arrows
Export stats to CSV
Strategy tester conversion
Custom date range filtering for backtesting
Author: Muhammad Wasim
Version: 1.0

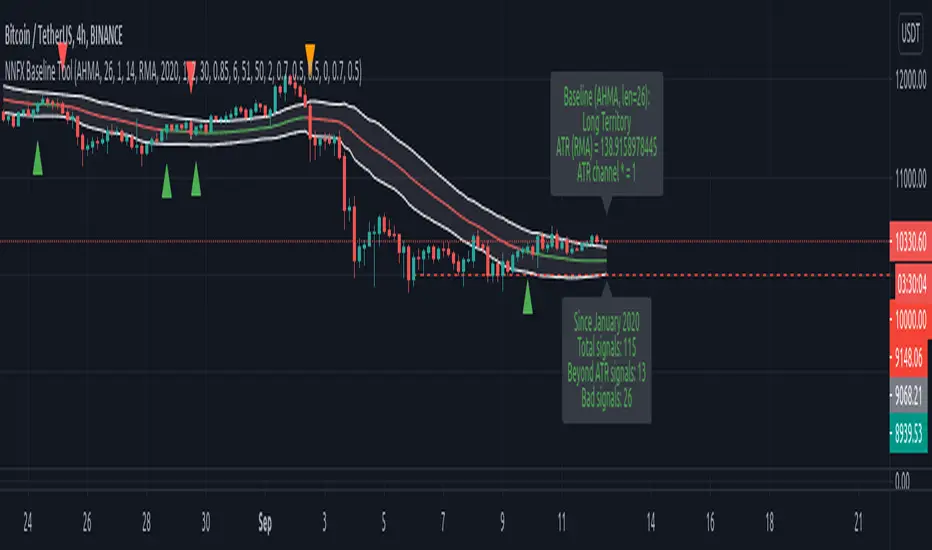
NNFX Baseline ToolNNFX All-in-One Baseline display / test tool.
This is usefull (hopefully) for the NNFX way of trading only. It's not intended to be used as a standalone tool.
Basically, this script displays and tests many types of Moving Averages as baselines.
It displays baseline signals, based on the NNFX ATR-related rule for baseline entries.
It can be used as a backtest tool, or plugged into the whole nnfx algo.
If signal display option is enabled, signals are displayed on chart : green for long, red for short, orange for crossovers beyond the ATR channel :
Many baselines available : SMA , EMA , WMA , VWMA , ALMA , AMA, SMMA , DEMA , FRAMA , HULL, KAMA , KIJUN, JURIK, LAGUERRE, MCGINLEY , TMA1, TMA2, VIDYA , MODULAR FILTER, VAMA , ZLEMA , T3, LSMA, etc.
Additional options :
- multiplying the ATR channel (and subsequent rule) by a factor (default = 1)
- plot the ATR channel (def = yes)
- fill it (def = yes)
- display signals (def = yes)
- option for add color to the baseline, for long/short territory (2 different options : baseline is colored, background is colored)
- darkmode / lightmode color option. (def = dark)
We also display panels, with general information and some test results. Tests are done within the test period.
I tried to test all the different MAs included in the script but some bugs might still be present, so use it at ur own risk.
If you'd like a new MA option added, please let me know in comments.
I included a "bad" signal detection, it can help for tweaking the settings. Signals are defined as "bad" when they are immediately followed by another signal.
When there is 2 or more bad signals next to another, you spotted a chopiness zone (a chopiness zone is defined as a zone where BL get eaten alive).
Example :
to do :
- plug it with the c1/c2 backtest tool (it's the whole point)
- add alerts,
- add more ma types
- stop to use the operator, it's not convenient at all
- add wr% calculation as a standalone feature (with TP / SL)
- add a way to measure chopiness in the test (dont know how yet)
- detect & display chopiness zones
I asked other users when I used their ideas (for some particular types of MAs). They all agreed.
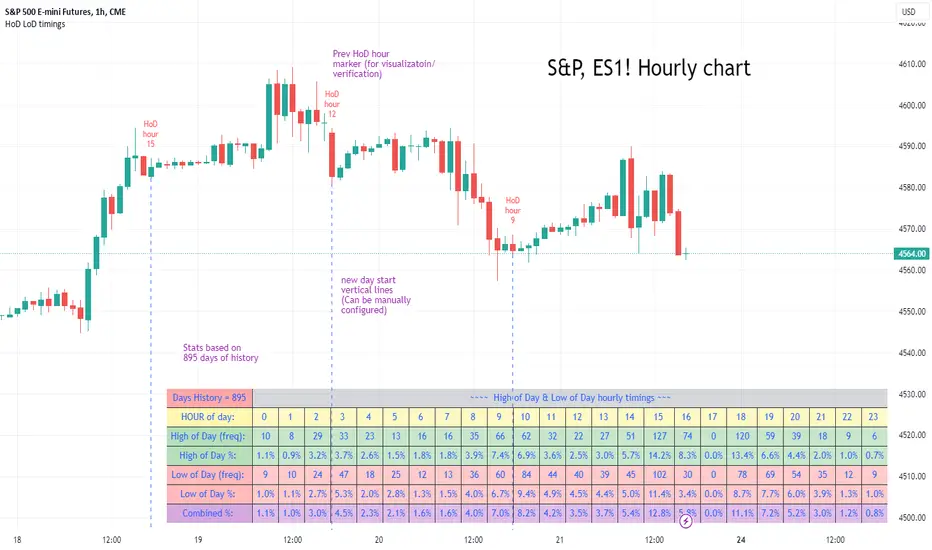
High of Day Low of Day hourly timings: Statistics. Time of day %High of Day (HoD) & Low of Day (LoD) hourly timings: Statistics. Time of day % likelihood for high and low.
//Purpose:
To collect stats on the hourly occurrences of HoD and LoD in an asset, to see which times of day price is more likely to form its highest and lowest prices.
//How it works:
Each day, HoD and LoD are calculated and placed in hourly 'buckets' from 0-23. Frequencies and Percentages are then calculated and printed/tabulated based on the full asset history available.
//User Inputs:
-Timezone (default is New York); important to make sure this matches your chart's timezone
-Day start time: (default is Tradingview's standard). Toggle Custom input box to input your own custom day start time.
-Show/hide day-start vertical lines; show/hide previous day's 'HoD hour' label (default toggled on). To be used as visual aid for setting up & verifying timezone settings are correct and table is populating correctly).
-Use historical start date (default toggled off): Use this along with bar-replay to backtest specific periods in price (i.e. consolidated vs trending, dull vs volatile).
-Standard formatting options (text color/size, table position, etc).
-Option to show ONLY on hourly chart (default toggled off): since this indicator is of most use by far on the hourly chart (most history, max precision).
// Notes & Tips:
-Make sure Timezone settings match (input setting & chart timezone).
-Play around with custom input day start time. Choose a 'dead' time (overnight) so as to ensure stats are their most meaningful (if you set a day start time when price is likely to be volatile or trending, you may get a biased / misleadingly high readout for the start-of-day/ end-of-day hour, due to price's tendency for continuation through that time.
-If you find a time of day with significantly higher % and it falls either side of your day start time. Try adjusting day start time to 'isolate' this reading and thereby filter out potential 'continuation bias' from the stats.
-Custom input start hour may not match to your chart at first, but this is not a concern: simply increment/decrement your input until you get the desired start time line on the chart; assuming your timezone settings for chart and indicator are matching, all will then work properly as designed.
-Use the the lines and labels along with bar-replay to verify HoD/LoD hours are printing correctly and table is populating correctly.
-Hour 'buckets' represent the start of said hour. i.e. hour 14 would be populated if HoD or LoD formed between 14:00 and 15:00.
-Combined % is simply the average of HoD % and LoD %. So it is the % likelihood of 'extreme of day' occurring in that hour.
-Best results from using this on Hourly charts (sub-hourly => less history; above hourly => less precision).
-Note that lower tier Tradingview subscriptions will get less data history. Premium acounts get 20k bars history => circa 900 days history on hourly chart for ES1!
-Works nicely on Btc/Usd too: any 24hr assets this will give meaningful data (whereas some commodities, such as Lean Hogs which only trade 5hrs in a day, will yield less meaningful data).
Example usage on S&P (ES1! 1hr chart): manual day start time of 11pm; New York timezone; Visual aid lines and labels toggled on. HoD LoD hour timings with 920 days history:
[MiV] Trading SessionHello, everyone!
Today I want to present my new script, which I hope will help not only me!
I'm sure that many people, like me, went through such a stage as "building their strategy". This is when you sit and test on the history how you would enter or exit a trade.
Recently I was doing the same thing and realized that my "tests" involve night time, when in reality I would be asleep and not trading! So I decided to create an indicator that would display my "working hours" so that the backtest I conduct would be as realistic as possible.
Also this indicator is able to display sessions of major exchanges and forex working hours, so it will be useful not only for cryptocurrency lovers.
In addition, we don't always trade every day and, for example, I don't trade on Sunday. That's why we added a feature that "turns off" the day and does not highlight it in color if you're not planning to trade on that day.
And finally, I added a notification of the beginning and end of the trading session. A small thing, but it may also be a useful feature for those who like to sit at the chart!
I will be glad to receive any comments and suggestions!
-----
Всем привет!
Хочу сегодня представить свой новый скрипт, который, надеюсь, поможет не только мне!
Уверен, что многие, как и я, проходили такой этап как "постройка своей стратегии". Это когда ты сидишь и тестируешь на истории то как бы ты входил или выходил из сделки.
Вот недавно я ровно также занимался этим и осознал, что мои "тесты" затрагивают и ночное время, когда в реальности я бы спал и не торговал! Поэтому я решил создать индикатор, который будет отображать мои "рабочие часы", чтобы бектест, который я провожу, был максимально реалистичным.
Также данный индикатор умеет отображать сессии крупных бирж и время работы форекса, так что полезным он будет не только для любителей криптовалюты.
Кроме того, мы же не всегда торгуем каждый день и например я не торгую в воскресенье. Поэтому добавлен функционал, который "выключает" день и не подсвечивает его цветом, если ты в этот день не планируешь торговать.
Ну и в заключении, добавил уведомление о начале и завершении торговой сессии. Мелочь, а тоже может быть полезной фичей для тех кто любит засесть за графиком!
Буду рад любым замечаниям и предложениям!

Divergence Backtester - V2Further attempts to study divergence impact on price in shorter terms.
Previous study can be found here:
In this script, we are trying to gather the stats based on last two pivot state together. For example, Individual table of Pivot High Projection is as explained below:
But, by looking at the bigger picture, we can further estimate following things regarding the current unconfirmed pivot and the new pivot which is yet to be formed.

Pump blaster based on Pump FinderThis is based on a video I watched while searching for good indicators to use for scanning pumps across the crypto market.
You can probably find the video by searching for "Pump Finder On 15 Minute Chart With Best Trading Indicators".
The approach presented uses LSMA and BB B% to detect pumps.
Results:
It does detect many pumps, it also detects many dumps...
I'm not very impressed after this first attempt but might give it another try if I come up with maybe something I'm doing wrong while trying to automate in a script the original strategy from the video.
Instructions:
This indicator is compatible with the backtest script we use.
It plots 1 for buy and 2 for sell. The rest of the plots are for debugging the strategy and can be ignored.
It's meant to be used on 15mins tf
