Wyszukaj w skryptach "backtest"

✅ BACKTEST: UT Bot + RSIRSI levels widened (60/40) — more signals.
Removed ATR volatility filter (to let trades fire).
Added inputs for TP and SL using ATR — fully dynamic.
Cleaned up conditions to ensure alignment with market structure.

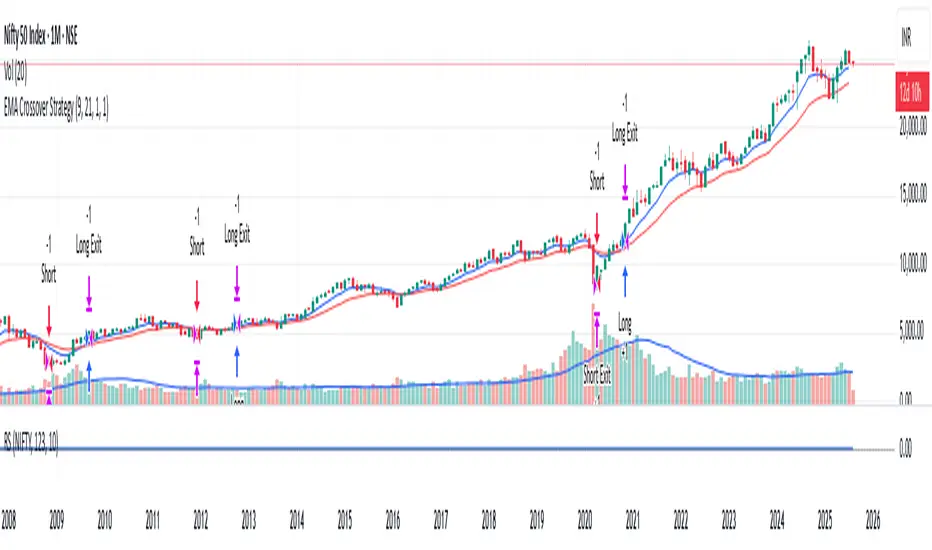
Laguerre RSI by KivancOzbilgic STRATEGYBacktesting.
" Laguerre RSI is based on John EHLERS' Laguerre Filter to avoid the noise of RSI .
Change alpha coefficient to increase/decrease lag and smoothness.
Buy when Laguerre RSI crosses upwards above 20.
Sell when Laguerre RSI crosses down below 80.
While indicator runs flat above 80 level, it means that an uptrend is strong.
While indicator runs flat below 20 level, it means that a downtrend is strong. "
Developer: John EHLERS
Author: KivancOzbilgic

VSA - Absorption - Bookmap
- Backtest on Gold, ES, major forex (liquid instruments where VSA works best).
- Filter with trend (EMA 50/200) or session (London/NY open).
- Combine with your Bookmap: use Pine signal → confirm with absorption/iceberg + delta flip.
- Risk: 0.5–1.5% per trade, 1:3+ R:R.

TG Capital Trident Setup Finder (v6, no-functions)backtest label for FVG setups of the trident pattern which TG capital talks about on chart fanatics

Backtest - Ichimoku CloudThis script find the entry position on a chart using Ichimoku clud conditions.
and also exit condition based on base line & price close w.r.t to Ichi cloud.

Momentum Breakout StrategyBacktest a strategy where, when a candlestick on a timeframe rises more than a certain %, it enters a trade.

RSI-VWAPBacktest script based on the previous RSI-VWAP indicator:
It's the popular RSI indicator with VWAP as a source instead of close:
- RSI_VWAP = rsi(vwap(close), RSI_VWAP_length)
What is the Volume Weighted Average Price ( VWAP )?
VWAP is calculated by adding up the dollars traded for every transaction (price multiplied by the number of shares traded) and then dividing by the total shares traded.
Trades are laddered to improve the average entry price and each entry is increased, improving the entry but increasing the risk of being liquidated.
It can be easily converted to study (alerts)
Settings for BINANCE:BTCUSDT at 30m

Simple Price Momentum - How To Create A Simple Trading StrategyThis script was built using a logical approach to trading systems. All the details can be found in a step by step guide below. I hope you enjoy it. I am really glad to be part of this community. Thank you all. I hope you not only succeed on your trading career but also enjoy it.
docs.google.com
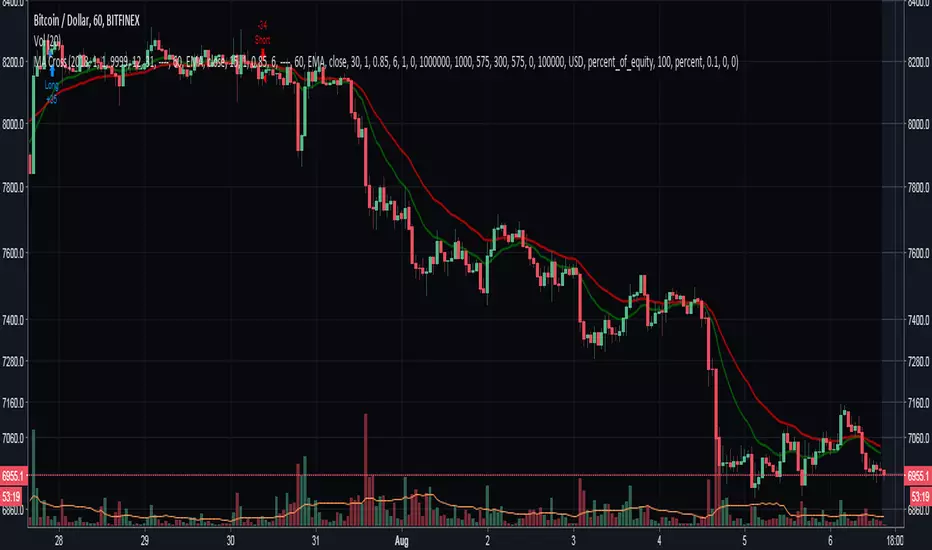
Moving Averages Cross - MTF - StrategyBacktesting Script for the following strategy
Strategy Injector Source: github.com

4H CCI Strategy 1.5Included adaptive lot size based on ATR, and also ATR based stop and take profit levels.
Risk/reward increased to 1:2 and should work in all ranging FX pairs as long as they are not trending.
Once the market starts trending it'll eat this bot alive.
Cheers,
Ivan Labrie
Time at Mode FX

Gamma of Gamma - AnticipationGamma of Gamma — Anticipation Engine
What if you could detect market inflections before they become obvious? Not react to momentum — anticipate the momentum itself.
"Gamma here refers to mathematical acceleration (2nd derivative), NOT options Gamma"
Gamma of Gamma (GoG) operates one abstraction layer above conventional indicators. While RSI tells you what momentum did , GoG tells you what momentum is about to do . This is the difference between chasing price and positioning ahead of it.
Core Innovation: Traditional indicators measure first-order effects (price change) or second-order effects (momentum/acceleration). This system measures the third derivative — the rate of change of acceleration itself. When Gamma-of-Gamma reaches extremes, it signals that pressure dynamics are about to flip — often 2-5 bars before price visibly reacts.
Target Users: Discretionary traders, scalpers, and swing traders who want early positioning signals with statistical rigor. Effective on stocks, crypto, forex, and futures with meaningful volume data.
━━━━━━━━━━━━━━━━━━━━━━━━━━━━━━━━━━━━━━━━━━━
WHY THIRD-DERIVATIVE ANALYSIS?
━━━━━━━━━━━━━━━━━━━━━━━━━━━━━━━━━━━━━━━━━━━
The Hierarchy of Market Information
Most traders operate at the wrong level of abstraction:
• Price → What happened (lagging)
• Momentum → How fast it happened (still lagging)
• Gamma (2nd Derivative) → How momentum is changing (coincident)
• Gamma of Gamma (3rd Derivative) → How FAST that change is changing ( leading )
The third derivative captures inflection acceleration — the mathematical signature of regime transition. When GoG reaches extreme values, the market is telegraphing that current pressure dynamics are unsustainable.
Why This Beats RSI
RSI measures momentum magnitude. GoG measures momentum trajectory .
Consider this scenario: RSI reads 70 (overbought). Is the move exhausted or just getting started? RSI cannot tell you. GoG can — because it measures whether buying pressure is accelerating into the high RSI reading (continuation likely) or decelerating despite high RSI (reversal imminent).
RSI answers: "How strong was the move?"
GoG answers: "Is the move strengthening or weakening right now ?"
The first is historical. The second is predictive.
━━━━━━━━━━━━━━━━━━━━━━━━━━━━━━━━━━━━━━━━━━━
MATHEMATICAL FOUNDATION
━━━━━━━━━━━━━━━━━━━━━━━━━━━━━━━━━━━━━━━━━━━
Layer 1: Cumulative Volume Delta (CVD)
The foundation is order flow approximation:
• Up bar (close > prior close): Volume classified as buying pressure
• Down bar (close < prior close): Volume classified as selling pressure
• CVD = Running sum of signed volume
Interpretation: Rising CVD indicates net aggressive buying. Falling CVD indicates net aggressive selling. CVD divergence from price often precedes reversals.
Layer 2: Gamma (Second Derivative)
Gamma measures acceleration of order flow:
Formula: Gamma = CVD - 2×CVD + CVD
This is the discrete second derivative — the rate of change of the rate of change. When Gamma spikes positive, buying pressure is accelerating . When Gamma spikes negative, selling pressure is accelerating.
Layer 3: Gamma of Gamma (Third Derivative)
GoG measures jerk — the acceleration of acceleration:
Formula: GoG = Gamma - 2×Gamma + Gamma
Critical insight: Extreme GoG readings indicate that current pressure dynamics are reaching an inflection point. The system is "overextended" in its current trajectory and will likely revert or reverse.
Layer 4: Z-Score Normalization
Raw GoG values are normalized against their 50-period distribution:
Formula: GoG_Z = (GoG - Mean_50) / StdDev_50
Benefit: Z-scores are regime-adaptive. A "2.0" reading always means "2 standard deviations from normal" regardless of whether you're trading a penny stock or ES futures. This makes thresholds consistent across instruments and timeframes.
━━━━━━━━━━━━━━━━━━━━━━━━━━━━━━━━━━━━━━━━━━━
SIGNAL GENERATION LOGIC
━━━━━━━━━━━━━━━━━━━━━━━━━━━━━━━━━━━━━━━━━━━
Long Signal (Bullish Anticipation)
Triggers when:
• GoG Z-score < -Threshold (default -2.0)
• Volume > Average Volume × Minimum Multiple (default 1.2×)
Interpretation: Selling pressure acceleration has reached an extreme negative reading. The selling is "exhausting itself" — acceleration is peaking and will soon decelerate. Buyers are likely to step in.
Short Signal (Bearish Anticipation)
Triggers when:
• GoG Z-score > +Threshold (default +2.0)
• Volume > Average Volume × Minimum Multiple (default 1.2×)
Interpretation: Buying pressure acceleration has reached an extreme positive reading. The buying is "exhausting itself" — often occurs at blow-off tops, failed breakouts, or momentum climaxes.
Why Volume Confirmation?
Gamma acceleration in thin liquidity is meaningless noise. The volume filter ensures signals occur only when meaningful participation backs the pressure dynamics. This dramatically reduces false signals during low-activity periods.
━━━━━━━━━━━━━━━━━━━━━━━━━━━━━━━━━━━━━━━━━━━
CONFIDENCE ENGINE
━━━━━━━━━━━━━━━━━━━━━━━━━━━━━━━━━━━━━━━━━━━
Not all signals are equal. The Confidence Engine quantifies signal strength:
Confidence Calculation:
Confidence = 50 + ((|Z-Score| - Threshold) / Threshold) × 100
Capped at 100%
Visual Representation:
• Small orb = Low confidence (50-65%)
• Normal orb = Medium confidence (65-80%)
• Large orb = High confidence (80-100%)
Orb transparency also adjusts — high-confidence signals appear brighter and more prominent. This creates intuitive visual hierarchy where stronger signals demand more attention.
Practical Use:
• High confidence (>80%): Consider larger position size, tighter stops
• Medium confidence (50-80%): Standard position size
• Low confidence (<50%): Reduced size or wait for confirmation
━━━━━━━━━━━━━━━━━━━━━━━━━━━━━━━━━━━━━━━━━━━
INTEGRATED BACKTESTER
━━━━━━━━━━━━━━━━━━━━━━━━━━━━━━━━━━━━━━━━━━━
Every signal system needs accountability. The onboard backtester provides real-time performance tracking:
Core Metrics:
• Total Trades
• Win Rate
• Profit Factor
• Expectancy (average P&L per trade)
• Net P&L
• Max Drawdown
• Average Win / Average Loss
Methodology:
• Positions held for configurable bar count (default 10 bars)
• Forces objective evaluation independent of discretionary exits
• Updates in real-time as new trades complete
Optimizer Mode:
Enable for parameter tuning research:
• Stability Score (0-100 points): Composite evaluation of parameter robustness
• Trade Density : Signals per 1000 bars — monitors over/under-trading
• Parameter Display : Current settings for documentation
• Robustness Rating : ROBUST / STABLE / FRAGILE / OVERFIT
Stability Scoring Breakdown:
• Win Rate ≥55%: +25 points | ≥50%: +15 points | ≥45%: +5 points
• Expectancy >0.5%: +25 points | >0.1%: +15 points | >0%: +5 points
• Total Trades ≥30: +25 points | ≥20: +15 points | ≥10: +5 points
• Profit Factor ≥1.5: +25 points | ≥1.2: +15 points | ≥1.0: +5 points
Target: 60+ points indicates stable parameters. Below 40 suggests overfitting risk.
━━━━━━━━━━━━━━━━━━━━━━━━━━━━━━━━━━━━━━━━━━━
CHART EXECUTION SIGNALS
━━━━━━━━━━━━━━━━━━━━━━━━━━━━━━━━━━━━━━━━━━━
Unique feature: Entry and exit markers display directly on the price chart via force_overlay, even though the indicator runs in a separate pane.
Visual Markers:
• ▲ Green Triangle (below bar): Long entry at exact price level
• ▼ Red Triangle (above bar): Short entry at exact price level
• ✕ Gold X-Cross : Position exit after hold period
Benefit: Immediate visual correlation between GoG signals and price action. Review historical trades without switching between panes.
━━━━━━━━━━━━━━━━━━━━━━━━━━━━━━━━━━━━━━━━━━━
DUAL DASHBOARD SYSTEM
━━━━━━━━━━━━━━━━━━━━━━━━━━━━━━━━━━━━━━━━━━━
Main Dashboard — Real-Time State
Displays:
• Current GoG regime (EXTREME HIGH / EXTREME LOW / NEUTRAL)
• GoG Z-Score (numerical)
• Raw GoG value
• Gamma value
• CVD (Cumulative Volume Delta)
• Volume status (Active/Low with ratio)
• Signal state (Scanning / Long Signal / Short Signal / In Position)
• Confidence meter with visual bar
• Entry price when in position
Backtest Dashboard — Performance Metrics
Displays all backtester metrics in compact format. Switches to Optimizer view when Optimizer Mode enabled.
Both dashboards feature:
• Configurable position (6 locations including Middle Left/Right)
• Adjustable text size (Tiny/Small/Normal/Large)
• Transparency control for visual integration
━━━━━━━━━━━━━━━━━━━━━━━━━━━━━━━━━━━━━━━━━━━
PARAMETER GUIDE
━━━━━━━━━━━━━━━━━━━━━━━━━━━━━━━━━━━━━━━━━━━
Calculation Settings
• GoG Extreme Threshold (default 2.0): Z-score level for signal generation. Higher = fewer but stronger signals. Range: 0.5-5.0
• Gamma Smoothing (default 3): SMA period for Gamma. Lower = more responsive, more noise. Higher = smoother, more lag. Range: 1-20
• GoG Smoothing (default 5): SMA period for GoG. Filters micro-spikes while preserving structural inflections. Range: 1-20
• Min Volume Multiple (default 1.2): Volume must exceed this multiple of 20-period average. Ensures signals have participation backing. Range: 0.5-3.0
Backtester Settings
• Backtest Hold Bars (default 10): Forced holding period for backtester evaluation. Adjust based on timeframe and trading style.
• Parameter Optimizer Mode : Enables extended metrics for tuning research.
Tuning by Timeframe
Scalping (1-5 min):
Threshold: 1.5-2.0 | Gamma Smooth: 2-3 | GoG Smooth: 3-4 | Hold: 5-8 bars
Day Trading (15-60 min):
Threshold: 2.0-2.5 | Gamma Smooth: 3-5 | GoG Smooth: 5-7 | Hold: 8-12 bars
Swing Trading (4H-Daily):
Threshold: 2.5-3.0 | Gamma Smooth: 5-7 | GoG Smooth: 7-10 | Hold: 10-15 bars
━━━━━━━━━━━━━━━━━━━━━━━━━━━━━━━━━━━━━━━━━━━
HOW TO USE: PRACTICAL WORKFLOW
━━━━━━━━━━━━━━━━━━━━━━━━━━━━━━━━━━━━━━━━━━━
Step 1: Identify Regime
Watch the GoG Z-score line. Most of the time it oscillates within the neutral zone (between thresholds). This is "scanning" mode — no actionable signal.
Step 2: Wait for Extreme
When Z-score crosses threshold AND volume confirms, a signal fires. The orb appears in the indicator pane; the triangle appears on price chart.
Step 3: Assess Confidence
Check orb size and dashboard confidence reading:
• Large bright orb + 80%+ confidence = High conviction setup
• Small faint orb + <60% confidence = Requires additional confirmation
Step 4: Execute with Context
GoG signals anticipate — they don't confirm. Use price structure (support/resistance), higher timeframe trend, or other confirmation before entry.
Step 5: Manage Position
Exit markers show backtester exits. For live trading, consider:
• Time-based exit (signal's hold period)
• Opposite signal exit
• Fixed R:R targets
Step 6: Review Performance
Check Backtest Dashboard regularly. If Win Rate drops below 45% or Expectancy goes negative, reassess parameters or market conditions.
━━━━━━━━━━━━━━━━━━━━━━━━━━━━━━━━━━━━━━━━━━━
WHAT THIS INDICATOR IS — AND ISN'T
━━━━━━━━━━━━━━━━━━━━━━━━━━━━━━━━━━━━━━━━━━━
This Indicator IS:
✅ State-transition detector (balance → imbalance)
✅ Early warning system for momentum shifts
✅ Anticipation tool for pre-positioning
✅ Statistical framework with built-in accountability
This Indicator IS NOT:
❌ Mechanical buy/sell system (requires discretion)
❌ Trend-following indicator
❌ Reversal-only indicator
❌ Replacement for risk management
Best Use Cases:
• Detecting early reversals before obvious confirmation
• Anticipating breakouts during volatility compression
• Timing pullback entries in established trends
• Identifying exhaustion at momentum climaxes
Challenging Conditions:
• Extremely low volume environments
• News-driven gaps (no order flow to measure)
• Instruments with unreliable volume data
━━━━━━━━━━━━━━━━━━━━━━━━━━━━━━━━━━━━━━━━━━━
ORIGINALITY STATEMENT
━━━━━━━━━━━━━━━━━━━━━━━━━━━━━━━━━━━━━━━━━━━
Innovation 1: Third-Derivative Order Flow Analysis
While first and second derivatives are common, applying third-derivative (jerk) analysis to cumulative volume delta is novel. This captures inflection points that lower-order analysis misses entirely.
Innovation 2: Z-Score Adaptive Thresholds
Rather than fixed thresholds that require per-instrument tuning, z-score normalization creates self-adapting signal levels that work consistently across any liquid instrument.
Innovation 3: Confidence-Weighted Visual System
Dynamic orb sizing and transparency based on signal strength provides intuitive visual hierarchy. Stronger signals literally appear larger and brighter.
Innovation 4: Integrated Accountability
Built-in backtester with optimizer mode enables parameter validation directly on chart. No external tools or spreadsheets required.
Innovation 5: Dual-Pane Execution Visualization
Force-overlay chart signals bridge the gap between indicator pane and price action, enabling immediate visual trade review.
━━━━━━━━━━━━━━━━━━━━━━━━━━━━━━━━━━━━━━━━━━━
LIMITATIONS & DISCLAIMERS
━━━━━━━━━━━━━━━━━━━━━━━━━━━━━━━━━━━━━━━━━━━
Technical Limitations
• Volume classification uses bar direction (close vs prior close), not tick-level aggressor data. Precision loss estimated 10-15% vs institutional-grade data.
• CVD approximation assumes volume follows price direction. Works well in trending conditions; less precise in choppy markets.
• Backtester uses fixed hold period, not optimal exit logic. Real performance may vary with proper trade management.
Market Limitations
• Requires meaningful volume data. Avoid instruments with reported volume issues.
• Signals may cluster during high-volatility events. Not every signal should be traded.
• Anticipation signals appear early by design. Patience required — price may continue against signal briefly before reversing.
Risk Disclosure
• Trading involves risk of loss. Past performance does not guarantee future results.
• This indicator provides analysis tools, not financial advice.
• Always use proper position sizing and risk management.
• Backtest results are hypothetical and do not include slippage, commissions, or fees.
━━━━━━━━━━━━━━━━━━━━━━━━━━━━━━━━━━━━━━━━━━━
RECOMMENDED SETTINGS BY MARKET
━━━━━━━━━━━━━━━━━━━━━━━━━━━━━━━━━━━━━━━━━━━
Crypto (BTC, ETH, SOL)
Threshold: 1.8-2.2 | Gamma: 3 | GoG: 5 | Volume: 1.3x | TF: 15min-4H
Notes: Higher volatility produces more signals. Consider higher threshold to filter.
Forex Majors (EURUSD, GBPUSD)
Threshold: 2.0-2.5 | Gamma: 4 | GoG: 6 | Volume: 1.2x | TF: 5min-1H
Notes: Lower volatility requires patience. Volume proxy via tick volume works adequately.
Stocks (Large Cap)
Threshold: 2.0-2.5 | Gamma: 3-4 | GoG: 5-6 | Volume: 1.2x | TF: 15min-Daily
Notes: Real volume data provides cleanest signals. Watch for opening/closing auction distortions.
Futures (ES, NQ, CL)
Threshold: 2.0-2.3 | Gamma: 3 | GoG: 5 | Volume: 1.2x | TF: 5min-1H
Notes: Excellent volume data. Session boundaries may produce false signals — consider RTH only.
━━━━━━━━━━━━━━━━━━━━━━━━━━━━━━━━━━━━━━━━━━━
CONCLUSION
━━━━━━━━━━━━━━━━━━━━━━━━━━━━━━━━━━━━━━━━━━━
Gamma of Gamma represents a fundamental shift in signal philosophy: from reacting to momentum to anticipating momentum.
By operating at the third derivative of order flow, this system detects the mathematical signatures of regime transition — the moments when current pressure dynamics become unsustainable and reversal becomes probable.
This is not another oscillator telling you what already happened. This is an anticipation engine positioning you for what's about to happen.
Stop chasing. Start anticipating.
RSI tells you where momentum was. GoG tells you where it's going.
Taking you to school. - Dskyz , Trade with probability. Trade with anticipation. Trade with GoG

Market State Engine V2# Market State Engine
**Deterministic Confidence-Scoring System for TradingView**
A professional-grade PineScript v5 indicator that scores market conditions from 0-100, helping traders identify high-quality trading opportunities through systematic structure analysis, VWAP positioning, order flow dynamics, and time-based context.
---
## 🎯 Overview
The **Market State Engine** is not a trading bot—it's a **noise-reduction and opportunity-ranking system** designed to filter market conditions and surface only the highest-quality setups.
Instead of blindly taking every signal, this indicator:
- ✅ **Scores** market conditions objectively (0-100 scale)
- ✅ **Filters** out low-probability setups automatically
- ✅ **Classifies** opportunities into A, A+, and A++ grades
- ✅ **Alerts** only on confirmed structure shifts with supporting context
- ✅ **Keeps the human in control** - provides intelligence, not automation
### Philosophy: Reduce Noise. Enforce Discipline. Surface Quality.
---
## 🚀 Key Features
- **Deterministic Scoring** - No black boxes, fully explainable logic
- **Multi-Factor Analysis** - Combines 4 independent market state components
- **Structure-First Approach** - Only alerts on confirmed pivot breaks
- **VWAP Mean Reversion Logic** - Directional filtering based on VWAP zones
- **Order Flow Proxy** - CVD divergence and confirmation detection
- **Session-Aware Scoring** - Prioritizes high-volume New York sessions
- **Alert De-Duplication** - One alert per unique structure shift
- **Zero Repainting** - Uses confirmed pivots only (left=2, right=2)
- **Fully Configurable** - All parameters exposed as inputs
- **Visual Feedback** - VWAP bands, setup labels, and real-time score panel
---
## 📊 Scoring System (0-100)
The Market State Engine evaluates **four independent components**, each contributing up to **25 points** for a maximum total score of **100**.
### 🎯 Component Breakdown
| Component | Max Points | Description |
|-----------|------------|-------------|
| **VWAP Context** | 25 | Measures price deviation from session VWAP |
| **Structure Shift** | 25 | Confirms pivot breakout (HARD GATE) |
| **CVD Alignment** | 25 | Detects order flow divergence/confirmation |
| **Time-of-Day** | 25 | Identifies high-probability trading sessions |
---
### 1️⃣ VWAP Context (Max 25 Points)
**Purpose:** Identifies extreme price deviations from fair value for mean-reversion opportunities.
VWAP (Volume-Weighted Average Price) is calculated session-anchored to New York market time, with standard deviation bands creating zones of opportunity.
#### Band Structure:
- **1st Band**: ±1σ from VWAP (fair value zone)
- **2nd Band**: ±2σ from VWAP (moderate deviation)
- **3rd Band**: ±3σ from VWAP (extreme deviation)
#### Scoring Logic (Exclusive):
```
Price in 3rd VWAP Band (>2σ and ≤3σ) → +25 points
Price in 2nd VWAP Band (>1σ and ≤2σ) → +15 points
Otherwise (inside 1σ or beyond 3σ) → 0 points
```
**Key Insight:** The further price stretches from VWAP, the higher the probability of mean reversion.
---
### 2️⃣ Structure Shift (Max 25 Points) — **HARD GATE**
**Purpose:** Confirms momentum shift through confirmed pivot breakouts.
⚠️ **CRITICAL:** Structure shift is **mandatory**. If no valid structure shift occurs, the **total score becomes 0** regardless of other factors.
#### Detection Method:
Uses TradingView's `ta.pivothigh()` and `ta.pivotlow()` functions with **locked parameters**:
- **Left bars**: 2
- **Right bars**: 2
- **Source**: Configurable (Wick or Body)
- **Break confirmation**: Candle close only
#### Bullish Structure Shift:
- ✅ Prior swing high exists (confirmed pivot)
- ✅ Current candle **closes above** swing high + tick buffer
- ✅ Must occur in VWAP 2nd or 3rd band
- ✅ **VWAP Filter**: Price must be **at or below VWAP** (lower bands)
#### Bearish Structure Shift:
- ✅ Prior swing low exists (confirmed pivot)
- ✅ Current candle **closes below** swing low - tick buffer
- ✅ Must occur in VWAP 2nd or 3rd band
- ✅ **VWAP Filter**: Price must be **at or above VWAP** (upper bands)
#### Scoring:
```
Valid structure shift → +25 points
No structure shift → Total score = 0
```
**Tick Buffer:** Default 5 ticks (configurable) - prevents false breaks from minor price noise.
---
### 3️⃣ CVD Alignment (Max 25 Points)
**Purpose:** Detects institutional order flow through volume delta analysis.
CVD (Cumulative Volume Delta) is a proxy for order flow:
```
Close > Open → +Volume (buying pressure)
Close < Open → -Volume (selling pressure)
```
#### Scoring Logic:
| Condition | Points | Description |
|-----------|--------|-------------|
| **Divergence** | +25 | Price makes higher high + CVD makes lower high (bearish)Price makes lower low + CVD makes higher low (bullish) |
| **Confirmation** | +20 | Price and CVD both make higher highs or lower lows |
| **Neutral** | 0 | No clear divergence or confirmation |
**Lookback Window:** Last 20 bars (configurable) - prevents stale divergences.
**Key Insight:** Divergences suggest weakening momentum, while confirmations validate the trend.
---
### 4️⃣ Time-of-Day Context (Max 25 Points)
**Purpose:** Prioritizes high-volume, high-volatility New York sessions.
#### Scored Sessions (America/New_York timezone):
| Session | Time Range (NY) | Points | Description |
|---------|-----------------|--------|-------------|
| **Pre-Market** | 03:00 - 04:00 | +25 | Early liquidity injection |
| **Market Open** | 09:30 - 11:30 | +25 | Highest volume period |
| **Off-Hours** | All other times | 0 | Lower probability setups |
**Key Insight:** Structure shifts during active sessions have higher follow-through probability.
---
## 🏆 Setup Classification
Setups are graded based on total score thresholds (configurable):
| Grade | Score Range | Typical Components | Quality Level |
|-------|-------------|-------------------|---------------|
| **A++ Setup** | ≥90 | All 4 factors aligned(VWAP 3rd band + Structure + CVD + Session) | Premium - Rare |
| **A+ Setup** | ≥75 | Structure + VWAP + CVD or Session(3 of 4 factors) | High - Select |
| **A Setup** | ≥60 | Structure + VWAP + Session(Minimum viable setup) | Good - Regular |
| **No Grade** | <60 | Insufficient confluence | Filtered out |
**Default Thresholds:**
- A Setup: 60 points
- A+ Setup: 75 points
- A++ Setup: 90 points
---
## 📥 Installation
### Step 1: Download the Indicator
Download the `market_state_engine.pine` file from this repository.
### Step 2: Add to TradingView
1. Open (www.tradingview.com)
2. Open the **Pine Editor** (bottom panel)
3. Click **"New"** → **"Blank indicator"**
4. Delete all default code
5. Paste the contents of `market_state_engine.pine`
6. Click **"Add to Chart"**
### Step 3: Configure for Your Symbol
1. Click the **gear icon** next to the indicator name
2. Adjust **Tick Size** for your instrument:
- ES futures: `0.25`
- NQ futures: `0.25`
- Stocks: `0.01`
3. Save settings
---
## ⚙️ Configuration
### Symbol Settings
| Parameter | Default | Description |
|-----------|---------|-------------|
| **Tick Size** | 0.25 | Minimum price movement for your symbol |
| **Tick Buffer Count** | 5 | Ticks beyond swing for valid break |
### VWAP Settings
| Parameter | Default | Description |
|-----------|---------|-------------|
| **VWAP Band 1 (σ)** | 1.0 | 1st standard deviation multiplier |
| **VWAP Band 2 (σ)** | 2.0 | 2nd standard deviation multiplier |
| **VWAP Band 3 (σ)** | 3.0 | 3rd standard deviation multiplier |
### Session Settings
| Parameter | Default | Description |
|-----------|---------|-------------|
| **Session 1** | 0300-0400 | Pre-market window (NY time) |
| **Session 2** | 0930-1130 | Market open window (NY time) |
### Score Thresholds
| Parameter | Default | Description |
|-----------|---------|-------------|
| **A Setup Threshold** | 60 | Minimum score for A grade |
| **A+ Setup Threshold** | 75 | Minimum score for A+ grade |
| **A++ Setup Threshold** | 90 | Minimum score for A++ grade |
### CVD Settings
| Parameter | Default | Description |
|-----------|---------|-------------|
| **CVD Divergence Lookback** | 20 | Maximum bars for divergence detection |
### Swing Settings
| Parameter | Default | Options | Description |
|-----------|---------|---------|-------------|
| **Swing Detection Method** | Wick | Wick / Body | Use high/low or open/close for pivots |
### Visual Settings
| Parameter | Default | Description |
|-----------|---------|-------------|
| **Show VWAP Bands** | ✅ | Display VWAP and standard deviation bands |
| **Show Setup Labels** | ✅ | Display setup markers on chart |
| **Show Score Panel** | ✅ | Display real-time score breakdown |
---
## 📖 How to Use
### Step 1: Apply to 1-Minute Chart
⚠️ **The indicator is locked to 1-minute timeframe** - do not use on other timeframes.
### Step 2: Understand the Visual Signals
#### Setup Labels
- **Green Triangle (▲)** - Bullish (Long) setup detected
- **Red Triangle (▼)** - Bearish (Short) setup detected
- Label shows **Grade** (A/A+/A++) and **Total Score**
#### VWAP Bands
- **Yellow Line** - Session VWAP (fair value)
- **Blue Bands** - ±1σ (fair value zone)
- **Purple Bands** - ±2σ (moderate deviation)
- **Red Bands** - ±3σ (extreme deviation)
#### Score Panel (Top Right)
Real-time breakdown of all four components:
```
Component Score
VWAP Zone 15/25
Structure 25/25
CVD 20/25
Session 25/25
TOTAL 85/100 (A+)
```
### Step 3: Interpret Signals
#### Valid Long Setup:
✅ Green triangle below candle
✅ Price in **lower VWAP bands** (below VWAP)
✅ Structure shift breaks swing high
✅ Score ≥60
#### Valid Short Setup:
✅ Red triangle above candle
✅ Price in **upper VWAP bands** (above VWAP)
✅ Structure shift breaks swing low
✅ Score ≥60
### Step 4: Set Up Alerts (See Alert Conditions section)
---
## 🚦 Signal Filters (VWAP Zone Logic)
The indicator uses **directional VWAP filtering** to prevent counter-trend signals:
### Long Signals (Green)
**Only allowed when price is AT or BELOW VWAP**
- ✅ Lower 2nd band (-2σ to -1σ)
- ✅ Lower 3rd band (-3σ to -2σ)
- ✅ At VWAP exactly
- ❌ **BLOCKED** in upper bands (above VWAP)
**Logic:** Longs when price is stretched below fair value (mean reversion)
### Short Signals (Red)
**Only allowed when price is AT or ABOVE VWAP**
- ✅ Upper 2nd band (+1σ to +2σ)
- ✅ Upper 3rd band (+2σ to +3σ)
- ✅ At VWAP exactly
- ❌ **BLOCKED** in lower bands (below VWAP)
**Logic:** Shorts when price is stretched above fair value (mean reversion)
---
## 🎨 Visual Elements
### Chart Overlays
| Element | Color | Description |
|---------|-------|-------------|
| **VWAP Line** | Yellow | Session-anchored fair value |
| **±1σ Bands** | Blue | Fair value zone (no score) |
| **±2σ Bands** | Purple | Moderate deviation (15 pts) |
| **±3σ Bands** | Red | Extreme deviation (25 pts) |
| **Swing Highs** | Red ▼ | Confirmed pivot highs |
| **Swing Lows** | Green ▲ | Confirmed pivot lows |
| **Session Background** | Light Green | Active high-value session |
### Setup Labels
**Bullish Setup:**
```
A+
▲ 75
```
Green label below candle, shows grade and score
**Bearish Setup:**
```
A++
▼ 90
```
Red label above candle, shows grade and score
### Score Panel
Real-time table in top-right corner:
- Individual component scores (0-25 each)
- Total score (0-100)
- Current setup grade (A/A+/A++)
- Updates in real-time as market conditions change
---
## 🔔 Alert Conditions
### Setting Up Alerts
#### Method 1: Built-in Alert Conditions
1. Click **"Create Alert"** in TradingView
2. Select **Market State Engine** as condition
3. Choose alert type:
- **Bullish Setup** - Long signals only
- **Bearish Setup** - Short signals only
- **Any Setup** - All signals
4. Set to **"Once Per Bar Close"**
5. Configure notification method (app, email, webhook)
#### Method 2: Custom Alert Message
Alert messages include full breakdown:
```
A+ Setup Detected (Score: 85)
Components: VWAP(25) + Structure(25) + CVD(20) + Time(15)
CVD State: Confirmation
Direction: Long
Timeframe: 1m
```
### Alert Behavior
✅ **One alert per unique pivot break** - no spam
✅ **Fires on candle close only** - no repainting
✅ **Minimum score filter** - only A grade or higher (≥60)
✅ **Direction-specific** - separate bullish/bearish conditions
⚠️ **No cooldown between different pivots** - multiple alerts per session allowed if different swing levels break
---
## 🔧 Technical Details
### Timeframe Lock
- **Required**: 1-minute chart only
- **Reason**: Scoring model calibrated for 1m micro-structure
- **Future**: Multi-timeframe support planned for v2
### Timezone Configuration
- **Hard-coded**: `America/New_York`
- **Session Detection**: Uses TradingView's native session functions
- **Consistency**: All time-based logic uses NY timezone
### Swing Detection Parameters
**Locked to specification:**
- `ta.pivothigh(source, left=2, right=2)`
- `ta.pivotlow(source, left=2, right=2)`
**Implications:**
- Pivots confirmed 2 bars after formation
- No repainting - historical pivots don't move
- 4-bar minimum swing structure (2 left + pivot + 2 right)
### VWAP Calculation
- **Type**: Session-anchored (resets daily)
- **Source**: Typical price `(high + low + close) / 3`
- **Weighting**: Volume-weighted
- **Standard Deviation**: True population standard deviation
### CVD Proxy Formula
```pine
barDelta = close > open ? volume : close < open ? -volume : 0
CVD = cumulative sum of barDelta (session-reset)
```
### Performance Limits
- **Max Labels**: 500 (TradingView limit)
- **Max Bars Back**: 500
- **Memory**: Lightweight - uses only essential variables
---
## 💡 Best Practices
### 1. **Use as a Filter, Not a Strategy**
❌ Don't: Blindly take every signal
✅ Do: Use score as confluence for your existing analysis
### 2. **Higher Grades = Better Probability**
- **A Setups (60-74)**: Regular opportunities, still require discretion
- **A+ Setups (75-89)**: High-quality, multiple factors aligned
- **A++ Setups (90-100)**: Rare premium opportunities, strongest edge
### 3. **Respect the VWAP Zone Filter**
The indicator **automatically blocks**:
- Longs in upper VWAP bands (counter-trend)
- Shorts in lower VWAP bands (counter-trend)
Trust this logic - it enforces mean reversion discipline.
### 4. **Monitor the Score Panel**
Watch which components are scoring to understand **why** a setup formed:
- Missing CVD score? → No order flow confirmation
- Missing Time score? → Outside high-volume sessions
- Low VWAP score? → Weak deviation from fair value
### 5. **Combine with Risk Management**
The indicator provides **opportunity scoring**, not position sizing:
- Use stop losses based on swing structure
- Scale position size with setup grade (larger on A++, smaller on A)
- Set profit targets at VWAP or opposing band
### 6. **Session Awareness**
Prioritize signals during **active sessions**:
- **03:00-04:00 NY**: Pre-market momentum
- **09:30-11:30 NY**: Highest volume, tightest spreads
Off-hours signals (0 time score) are lower probability but still valid if other factors strong.
### 7. **Understand the Hard Gate**
If **no structure shift** occurs:
- Total score = 0
- No alerts fire
- Other components irrelevant
**Why?** Structure shift confirms momentum change - without it, there's no tradable opportunity.
### 8. **Avoid Over-Optimization**
Default settings are well-calibrated:
- Don't chase "perfect" parameters
- Test changes on historical data before live use
- Document any modifications
### 9. **Leverage Alert De-Duplication**
The indicator prevents spam automatically:
- One alert per unique swing break
- New swing levels = new alerts
- No need to manually filter notifications
### 10. **Supplement with Price Action**
Use the indicator alongside:
- Support/resistance levels
- Order flow footprint charts
- Volume profile
- Market internals (breadth, TICK, etc.)
---
## 📚 Example Scenarios
### Example 1: A++ Premium Setup (Score: 95)
```
Price: In lower 3rd VWAP band (-2.8σ) → VWAP: 25 pts
Structure: Close breaks swing high → Structure: 25 pts
CVD: Price LL + CVD HL (bullish div) → CVD: 25 pts
Time: 10:15 AM NY (market open) → Time: 25 pts
Direction: LONG (price below VWAP) → Valid
Grade: A++ (95/100)
```
**Interpretation:** All factors aligned - premium mean-reversion long opportunity.
---
### Example 2: A+ Strong Setup (Score: 80)
```
Price: In upper 2nd VWAP band (+1.5σ) → VWAP: 15 pts
Structure: Close breaks swing low → Structure: 25 pts
CVD: Price HH + CVD LH (bearish div) → CVD: 25 pts
Time: 2:00 PM NY (off-hours) → Time: 0 pts
Direction: SHORT (price above VWAP) → Valid
Grade: A+ (65/100)
```
**Interpretation:** Strong setup despite off-hours, bearish divergence adds confidence.
---
### Example 3: Filtered Setup (Score: 0)
```
Price: In upper 3rd VWAP band (+2.5σ) → VWAP: 25 pts (if allowed)
Structure: Close breaks swing high → Structure: BLOCKED
CVD: Price HH + CVD HH (confirmation) → CVD: 20 pts (if allowed)
Time: 10:00 AM NY → Time: 25 pts (if allowed)
Direction: LONG (price ABOVE VWAP) → ❌ INVALID ZONE
Grade: None (0/100) - NO ALERT
```
**Interpretation:** VWAP filter blocked long signal in upper band - prevents counter-trend trade.
---
## 🛠️ Troubleshooting
### No Signals Appearing
- ✅ Verify you're on **1-minute chart**
- ✅ Check **Tick Size** matches your symbol
- ✅ Ensure **VWAP Bands** are visible
- ✅ Wait for confirmed pivots (requires at least 5 bars of history)
### Alerts Not Firing
- ✅ Confirm alert is set to **"Once Per Bar Close"**
- ✅ Check score threshold (must be ≥60 by default)
- ✅ Verify VWAP zone filter isn't blocking signals
- ✅ Check that structure shift is actually occurring
### Score Always Zero
- ✅ No structure shift detected (hard gate active)
- ✅ Price may not be in valid VWAP zone (2nd or 3rd band)
- ✅ Insufficient swing history (wait for pivots to form)
### Too Many/Too Few Signals
**Too many signals:**
- Increase **A Setup Threshold** (e.g., 70 instead of 60)
- Increase **Tick Buffer Count** (reduces false breaks)
**Too few signals:**
- Decrease **A Setup Threshold** (e.g., 50 instead of 60)
- Decrease **Tick Buffer Count** (more sensitive to breaks)
---
## 📜 License
This indicator is provided under the **Mozilla Public License 2.0**.
---
## 🤝 Credits
Developed as a professional trading tool for systematic opportunity identification.
**Philosophy:** Reduce noise. Enforce discipline. Keep the human in control.
---
## 📞 Support
For questions, issues, or feature requests, please consult:
1. This README documentation
2. The specification document (`pinescript_market_state_engine_spec.docx`)
3. Inline code comments in `market_state_engine.pine`
---
## 🔄 Version History
**v1.0** (Current)
- Initial release
- 4-component scoring model (VWAP + Structure + CVD + Time)
- VWAP zone directional filtering
- Alert de-duplication
- Configurable inputs
- Real-time score panel
- Session-aware logic
---
## 🎓 Understanding the Numbers
### Quick Reference Card
| Score Range | Grade | Quality | Typical Use |
|-------------|-------|---------|-------------|
| 90-100 | A++ | Premium | Highest conviction trades |
| 75-89 | A+ | High | Strong probability setups |
| 60-74 | A | Good | Acceptable with discretion |
| 0-59 | None | Filtered | Skip or wait for confluence |
### Component Contribution Examples
**Minimum A Setup (60 points):**
- Structure (25) + VWAP 3rd band (25) + Time (25) = 75 ✅
**Typical A+ Setup (75 points):**
- Structure (25) + VWAP 2nd band (15) + CVD confirm (20) + Time (25) = 85 ✅
**Maximum A++ Setup (100 points):**
- Structure (25) + VWAP 3rd band (25) + CVD divergence (25) + Time (25) = 100 ✅
---
## 🎯 Final Reminder
**This is NOT a trading bot.**
**This is NOT financial advice.**
**This is a decision-support tool.**
Always:
- ✅ Use proper risk management
- ✅ Understand the logic before trading
- ✅ Backtest on your symbols
- ✅ Keep the human in control
**Happy Trading! 📈**

Anchored LRL using ZigZag AnchorAnchored Linear Regression Channel - ZigZag Pivot
The Anchored Linear Regression Channel (LRL) dynamically anchors to the most recent ZigZag pivot point, providing traders with a regression-based channel that resets with each significant price swing.
HOW IT WORKS:
This indicator combines ZigZag pivot detection with linear regression analysis. When price reverses by a specified ATR multiple, a new pivot is identified. After a minimum number of bars, the linear regression channel anchors to this pivot and projects forward to the current bar, recalculating with each new bar.
KEY FEATURES:
- Dynamic anchoring to ZigZag highs and lows
- Customizable ATR-based reversal detection
- Two standard deviation channel bands (inner and outer)
- Adjustable minimum bars before anchor reset (ideal for scalping on lower timeframes)
- Separate controls for ZigZag smoothing vs. anchor reset timing
- Color-coded regression line (up/down trend)
- Optional line extension to the right
- Fully customizable colors and line widths
- Visual label marking the anchor pivot point
INPUTS:
- ATR Reversal: Multiplier for ATR-based pivot detection (default: 2.0)
- MA Length: EMA smoothing for ZigZag calculation (default: 5)
- ATR Length: Period for ATR calculation (default: 5)
- Min Bars After Pivot: Bars required before anchor resets (default: 3, reduce to 1-2 for faster scalping)
- Channel Widths: Inner (0.70) and Outer (1.00) standard deviation multiples
- Line Colors: Customizable colors for uptrend/downtrend and channel lines
- Label Colors: Customizable background and text colors
HOW TO USE:
1. Apply the indicator to your chart
2. Adjust "Min Bars After Pivot" based on your timeframe:
- 1-minute charts: Use 1-2 bars for quick scalping entries
- 5-minute+ charts: Use 3-5 bars for more confirmation
3. Watch for the regression line color to indicate trend direction
4. Use channel bands as potential support/resistance zones
5. The label shows which pivot (high/low) the channel is anchored to
BEST PRACTICES:
- Lower timeframes (1-5 min): Use lower "Min Bars After Pivot" (1-3) for faster reaction
- Higher timeframes: Use higher values (5+) for more confirmed pivots
- Combine with price action and volume for confirmation
- Adjust ATR Reversal based on instrument volatility
NOTES:
- This indicator repaints as it recalculates with each new bar
- Channel resets when a new ZigZag pivot is confirmed
- Not suitable for backtesting strategies due to dynamic nature
- Works best on liquid instruments with clear price swings
DISCLAIMER:
This indicator is for educational and informational purposes only. It does not provide trading signals or guarantees of profitability. Past performance is not indicative of future results. Always perform your own analysis and risk management.

[codapro] Elite Momentum & Smart Money Detector
Elite Momentum & Smart Money Detector
Overview
The Elite Detector is a non-repainting indicator that merges Smart Money Concepts, Adaptive Volatility-Based Momentum, and Multi-Timeframe Trend Confluence to identify high-probability trade setups. This tool helps confirm institutional intent and market pressure before triggering actionable signals.
Core Systems
Smart Money Concepts (SMC)
• Highlights institutional order blocks
• Detects equal highs/lows as liquidity zones
• Automatically cleans up outdated zones for clarity
Adaptive Momentum Engine
• Momentum calculated with volatility-adjusted smoothing
• Normalized scale from -100 to +100
• Candle coloring reflects trend strength dynamically
Squeeze Detection System
• Flags volatility contraction zones using Bollinger and Keltner channels
• Background shading highlights compression zones
• Histogram shows directional breakout pressure
Multi-Timeframe Trend Validation
• Aligns signals with higher timeframe momentum
• Built-in logic auto-selects appropriate HTF per chart
• Reduces false signals and improves timing
Signal Logic
Buy Signal appears when:
Momentum crosses from negative to positive
Squeeze condition is active
Higher timeframe confirms bullish trend
Sell Signal appears when:
Momentum crosses from positive to negative
Squeeze condition is active
Higher timeframe confirms bearish trend
All signals are non-repainting and appear only once all conditions are met.
Visual Dashboard (Top-Right Corner)
Displays real-time confirmation across five categories:
Momentum: Current trend direction and strength
Squeeze: Indicates if volatility is compressed
HTF Trend: Confirms higher-timeframe alignment
Volatility: Current volatility phase (low, normal, or high)
Signal Status: Buy, Sell, or Neutral (Wait)
Chart Visuals
Candle Colors:
• Bright green/red = Strong momentum
• Faded green/red = Weak momentum
Background Colors:
• Orange = Squeeze is active
• Clear = Normal market activity
Boxes:
• Green = Bullish order blocks
• Red = Bearish order blocks
Dashed Lines:
• Red = Equal highs (liquidity zones above)
• Green = Equal lows (liquidity zones below)
Alert Conditions
Includes three prebuilt alerts for automation and webhook systems:
Elite Buy Signal
Elite Sell Signal
Squeeze Activation
These alerts allow users to respond to market shifts in real time or integrate with automated trading workflows.
Best Practices
Wait for Confluence: Confirm all three systems (momentum, squeeze, HTF trend) before entering
Watch Order Blocks: Institutional zones often act as support/resistance
Monitor Liquidity Zones: Be cautious of stop hunts near equal highs/lows
Use Dashboard Cues: Let the HUD validate your setup
Always Use Risk Management: This tool increases probability, not certainty
Example Setup:
1. Squeeze background appears
2. Buy signal triangle confirms
3. Dashboard shows: Momentum strong up, Squeeze on, HTF trend up
4. Price bounces off green order block
→ High-probability long entry
Why It Works
This tool leverages multiple uncorrelated concepts to filter low-quality trades and highlight setups with real institutional backing:
Order Blocks and Liquidity Zones track smart money footprints
Volatility-adjusted Momentum captures real energy shifts
Multi-Timeframe Confluence confirms trades in the broader context
Non-repainting signals ensure reliability
Final Note
The Elite Detector is designed to show you:
Where smart money is positioned,
When the market is coiling for a move,
and Which direction is supported by momentum and trend.
Use it as your high-probability entry engine — across any market or timeframe.
Disclaimer
This tool was created using the CodaPro Pine Script architecture engine — designed to produce robust trading overlays, educational visuals, and automation-ready alerts. It is provided strictly for educational purposes and does not constitute financial advice. Always backtest and demo before applying to real capital.

Asset Rotation System [InvestorUnknown]Overview
This system creates a comprehensive trend "matrix" by analyzing the performance of six assets against both the US Dollar and each other. The objective is to identify and hold the asset that is currently outperforming all others, thereby focusing on maintaining an investment in the most "optimal" asset at any given time.
- - - Key Features - - -
1. Trend Classification:
The system evaluates the trend for each of the six assets, both individually against USD and in pairs (assetX/assetY), to determine which asset is currently outperforming others.
Utilizes five distinct trend indicators: RSI (50 crossover), CCI, SuperTrend, DMI, and Parabolic SAR.
Users can customize the trend analysis by selecting all indicators or choosing a single one via the "Trend Classification Method" input setting.
2. Backtesting:
Calculates an equity curve for each asset and for the system itself, which assumes holding only the asset deemed optimal at any time.
Customizable start date for backtesting; by default, it begins either 5000 bars ago (the maximum in TradingView) or at the inception of the youngest asset included, whichever is shorter. If the youngest asset's history exceeds 5000 bars, the system uses 5000 bars to prevent errors.
The equity curve is dynamically colored based on the asset held at each point, with this coloring also reflected on the chart via barcolor().
Performance metrics like returns, standard deviation of returns, Sharpe, Sortino, and Omega ratios, along with maximum drawdown, are computed for each asset and the system's equity curve.
3 Alerts:
Supports alerts for when a new, confirmed optimal asset is identified. However, due to TradingView limitations, the specific asset cannot be included in the alert message.
- - - Usage - - -
1. Select Assets/Tickers:
Choose which assets or tickers you want to include in the rotation system. Ensure that all selected tickers are denominated in USD to maintain consistency in analysis.
2. Configure Trend Classification:
Decide on the trend classification method from the available options (RSI, CCI, SuperTrend, DMI, or Parabolic SAR, All) and adjust the settings to your preferences. This customization allows you to tailor the system to different market conditions or your specific trading strategy.
3. Utilize Backtesting for Calibration:
Use the backtesting results, including equity curves and performance metrics, to fine-tune your chosen trend indicators.
Be cautious not to overemphasize performance maximization, as this can lead to overfitting. The goal is to achieve a robust system that performs well across various market conditions, rather than just optimizing for past data.
- - - Parameters - - -
Tickers:
Asset 1: Select the symbol for the first asset.
Asset 2: Select the symbol for the second asset.
Asset 3: Select the symbol for the third asset.
Asset 4: Select the symbol for the fourth asset.
Asset 5: Select the symbol for the fifth asset.
Asset 6: Select the symbol for the sixth asset.
General Settings:
Trend Classification Method: Choose from RSI, CCI, SuperTrend, DMI, PSAR, or "All" to determine how trends are analyzed.
Use Custom Starting Date for Backtest: Toggle to use a custom date for beginning the backtest.
Custom Starting Date: Set the custom start date for backtesting.
Plot Perf. Metrics Table: Option to display performance metrics in a table on the chart.
RSI (Relative Strength Index):
RSI Source: Choose the price data source for RSI calculation.
RSI Length: Set the period for the RSI calculation.
CCI (Commodity Channel Index):
CCI Source: Select the price data source for CCI calculation.
CCI Length: Determine the period for the CCI.
SuperTrend:
SuperTrend Factor: Adjust the sensitivity of the SuperTrend indicator.
SuperTrend Length: Set the period for the SuperTrend calculation.
DMI (Directional Movement Index):
DMI Length: Define the period for DMI calculations.
Parabolic SAR:
PSAR Start: Initial acceleration factor for the Parabolic SAR.
PSAR Increment: Increment value for the acceleration factor.
PSAR Max Value: Maximum value the acceleration factor can reach.
Notes/Recommendations:
While this system is operational, it's important to recognize that it relies on "basic" indicators, which may not be ideal for generating trading signals on their own. I strongly suggest that users delve into the code to grasp the underlying logic of the system. Consider customizing it by integrating more sophisticated and higher-quality trend-following indicators to enhance its performance and reliability.
Disclaimer:
This system's backtest results are historical and do not predict future performance. Use for educational purposes only; not investment advice.

Range Oscillator Strategy + Stoch Confirm🔹 Short summary
This is a free, educational long-only strategy built on top of the public “Range Oscillator” by Zeiierman (used under CC BY-NC-SA 4.0), combined with a Stochastic timing filter, an EMA-based exit filter and an optional risk-management layer (SL/TP and R-multiple exits). It is NOT financial advice and it is NOT a magic money machine. It’s a structured framework to study how range-expansion + momentum + trend slope can be combined into one rule-based system, often with intentionally RARE trades.
────────────────────────
0. Legal / risk disclaimer
────────────────────────
• This script is FREE and public. I do not charge any fee for it.
• It is for EDUCATIONAL PURPOSES ONLY.
• It is NOT financial advice and does NOT guarantee profits.
• Backtest results can be very different from live results.
• Markets change over time; past performance is NOT indicative of future performance.
• You are fully responsible for your own trades and risk.
Please DO NOT use this script with money you cannot afford to lose. Always start in a demo / paper trading environment and make sure you understand what the logic does before you risk any capital.
────────────────────────
1. About default settings and risk (very important)
────────────────────────
The script is configured with the following defaults in the `strategy()` declaration:
• `initial_capital = 10000`
→ This is only an EXAMPLE account size.
• `default_qty_type = strategy.percent_of_equity`
• `default_qty_value = 100`
→ This means 100% of equity per trade in the default properties.
→ This is AGGRESSIVE and should be treated as a STRESS TEST of the logic, not as a realistic way to trade.
TradingView’s House Rules recommend risking only a small part of equity per trade (often 1–2%, max 5–10% in most cases). To align with these recommendations and to get more realistic backtest results, I STRONGLY RECOMMEND you to:
1. Open **Strategy Settings → Properties**.
2. Set:
• Order size: **Percent of equity**
• Order size (percent): e.g. **1–2%** per trade
3. Make sure **commission** and **slippage** match your own broker conditions.
• By default this script uses `commission_value = 0.1` (0.1%) and `slippage = 3`, which are reasonable example values for many crypto markets.
If you choose to run the strategy with 100% of equity per trade, please treat it ONLY as a stress-test of the logic. It is NOT a sustainable risk model for live trading.
────────────────────────
2. What this strategy tries to do (conceptual overview)
────────────────────────
This is a LONG-ONLY strategy designed to explore the combination of:
1. **Range Oscillator (Zeiierman-based)**
- Measures how far price has moved away from an adaptive mean.
- Uses an ATR-based range to normalize deviation.
- High positive oscillator values indicate strong price expansion away from the mean in a bullish direction.
2. **Stochastic as a timing filter**
- A classic Stochastic (%K and %D) is used.
- The logic requires %K to be below a user-defined level and then crossing above %D.
- This is intended to catch moments when momentum turns up again, rather than chasing every extreme.
3. **EMA Exit Filter (trend slope)**
- An EMA with configurable length (default 70) is calculated.
- The slope of the EMA is monitored: when the slope turns negative while in a long position, and the filter is enabled, it triggers an exit condition.
- This acts as a trend-protection exit: if the medium-term trend starts to weaken, the strategy exits even if the oscillator has not yet fully reverted.
4. **Optional risk-management layer**
- Percentage-based Stop Loss and Take Profit (SL/TP).
- Risk/Reward (R-multiple) exit based on the distance from entry to SL.
- Implemented as OCO orders that work *on top* of the logical exits.
The goal is not to create a “holy grail” system but to serve as a transparent, configurable framework for studying how these concepts behave together on different markets and timeframes.
────────────────────────
3. Components and how they work together
────────────────────────
(1) Range Oscillator (based on “Range Oscillator (Zeiierman)”)
• The script computes a weighted mean price and then measures how far price deviates from that mean.
• Deviation is normalized by an ATR-based range and expressed as an oscillator.
• When the oscillator is above the **entry threshold** (default 100), it signals a strong move away from the mean in the bullish direction.
• When it later drops below the **exit threshold** (default 30), it can trigger an exit (if enabled).
(2) Stochastic confirmation
• Classic Stochastic (%K and %D) is calculated.
• An entry requires:
- %K to be below a user-defined “Cross Level”, and
- then %K to cross above %D.
• This is a momentum confirmation: the strategy tries to enter when momentum turns up from a pullback rather than at any random point.
(3) EMA Exit Filter
• The EMA length is configurable via `emaLength` (default 70).
• The script monitors the EMA slope: it computes the relative change between the current EMA and the previous EMA.
• If the slope turns negative while the strategy holds a long position and the filter is enabled, it triggers an exit condition.
• This is meant to help protect profits or cut losses when the medium-term trend starts to roll over, even if the oscillator conditions are not (yet) signalling exit.
(4) Risk management (optional)
• Stop Loss (SL) and Take Profit (TP):
- Defined as percentages relative to average entry price.
- Both are disabled by default, but you can enable them in the Inputs.
• Risk/Reward Exit:
- Uses the distance from entry to SL to project a profit target at a configurable R-multiple.
- Also optional and disabled by default.
These exits are implemented as `strategy.exit()` OCO orders and can close trades independently of oscillator/EMA conditions if hit first.
────────────────────────
4. Entry & Exit logic (high level)
────────────────────────
A) Time filter
• You can choose a **Start Year** in the Inputs.
• Only candles between the selected start date and 31 Dec 2069 are used for backtesting (`timeCondition`).
• This prevents accidental use of tiny cherry-picked windows and makes tests more honest.
B) Entry condition (long-only)
A long entry is allowed when ALL the following are true:
1. `timeCondition` is true (inside the backtest window).
2. If `useOscEntry` is true:
- Range Oscillator value must be above `entryLevel`.
3. If `useStochEntry` is true:
- Stochastic condition (`stochCondition`) must be true:
- %K < `crossLevel`, then %K crosses above %D.
If these filters agree, the strategy calls `strategy.entry("Long", strategy.long)`.
C) Exit condition (logical exits)
A position can be closed when:
1. `timeCondition` is true AND a long position is open, AND
2. At least one of the following is true:
- If `useOscExit` is true: Oscillator is below `exitLevel`.
- If `useMagicExit` (EMA Exit Filter) is true: EMA slope is negative (`isDown = true`).
In that case, `strategy.close("Long")` is called.
D) Risk-management exits
While a position is open:
• If SL or TP is enabled:
- `strategy.exit("Long Risk", ...)` places an OCO stop/limit order based on the SL/TP percentages.
• If Risk/Reward exit is enabled:
- `strategy.exit("RR Exit", ...)` places an OCO order using a projected R-multiple (`rrMult`) of the SL distance.
These risk-based exits can trigger before the logical oscillator/EMA exits if price hits those levels.
────────────────────────
5. Recommended backtest configuration (to avoid misleading results)
────────────────────────
To align with TradingView House Rules and avoid misleading backtests:
1. **Initial capital**
- 10 000 (or any value you personally want to work with).
2. **Order size**
- Type: **Percent of equity**
- Size: **1–2%** per trade is a reasonable starting point.
- Avoid risking more than 5–10% per trade if you want results that could be sustainable in practice.
3. **Commission & slippage**
- Commission: around 0.1% if that matches your broker.
- Slippage: a few ticks (e.g. 3) to account for real fills.
4. **Timeframe & markets**
- Volatile symbols (e.g. crypto like BTCUSDT, or major indices).
- Timeframes: 1H / 4H / **1D (Daily)** are typical starting points.
- I strongly recommend trying the strategy on **different timeframes**, for example 1D, to see how the behaviour changes between intraday and higher timeframes.
5. **No “caution warning”**
- Make sure your chosen symbol + timeframe + settings do not trigger TradingView’s caution messages.
- If you see warnings (e.g. “too few trades”), adjust timeframe/symbol or the backtest period.
────────────────────────
5a. About low trade count and rare signals
────────────────────────
This strategy is intentionally designed to trade RARELY:
• It is **long-only**.
• It uses strict filters (Range Oscillator threshold + Stochastic confirmation + optional EMA Exit Filter).
• On higher timeframes (especially **1D / Daily**) this can result in a **low total number of trades**, sometimes WELL BELOW 100 trades over the whole backtest.
TradingView’s House Rules mention 100+ trades as a guideline for more robust statistics. In this specific case:
• The **low trade count is a conscious design choice**, not an attempt to cherry-pick a tiny, ultra-profitable window.
• The goal is to study a **small number of high-conviction long entries** on higher timeframes, not to generate frequent intraday signals.
• Because of the low trade count, results should NOT be interpreted as statistically strong or “proven” – they are only one sample of how this logic would have behaved on past data.
Please keep this in mind when you look at the equity curve and performance metrics. A beautiful curve with only a handful of trades is still just a small sample.
────────────────────────
6. How to use this strategy (step-by-step)
────────────────────────
1. Add the script to your chart.
2. Open the **Inputs** tab:
- Set the backtest start year.
- Decide whether to use Oscillator-based entry/exit, Stochastic confirmation, and EMA Exit Filter.
- Optionally enable SL, TP, and Risk/Reward exits.
3. Open the **Properties** tab:
- Set a realistic account size if you want.
- Set order size to a realistic % of equity (e.g. 1–2%).
- Confirm that commission and slippage are realistic for your broker.
4. Run the backtest:
- Look at Net Profit, Max Drawdown, number of trades, and equity curve.
- Remember that a low trade count means the statistics are not very strong.
5. Experiment:
- Tweak thresholds (`entryLevel`, `exitLevel`), Stochastic settings, EMA length, and risk params.
- See how the metrics and trade frequency change.
6. Forward-test:
- Before using any idea in live trading, forward-test on a demo account and observe behaviour in real time.
────────────────────────
7. Originality and usefulness (why this is more than a mashup)
────────────────────────
This script is not intended to be a random visual mashup of indicators. It is designed as a coherent, testable strategy with clear roles for each component:
• Range Oscillator:
- Handles mean vs. range-expansion states via an adaptive, ATR-normalized metric.
• Stochastic:
- Acts as a timing filter to avoid entering purely on extremes and instead waits for momentum to turn.
• EMA Exit Filter:
- Trend-slope-based safety net to exit when the medium-term direction changes against the position.
• Risk module:
- Provides practical, rule-based exits: SL, TP, and R-multiple exit, which are useful for structuring risk even if you modify the core logic.
It aims to give traders a ready-made **framework to study and modify**, not a black box or “signals” product.
────────────────────────
8. Limitations and good practices
────────────────────────
• No single strategy works on all markets or in all regimes.
• This script is long-only; it does not short the market.
• Performance can degrade when market structure changes.
• Overfitting (curve fitting) is a real risk if you endlessly tweak parameters to maximise historical profit.
Good practices:
- Test on multiple symbols and timeframes.
- Focus on stability and drawdown, not only on how high the profit line goes.
- View this as a learning tool and a basis for your own research.
────────────────────────
9. Licensing and credits
────────────────────────
• Core oscillator idea & base code:
- “Range Oscillator (Zeiierman)”
- © Zeiierman, licensed under CC BY-NC-SA 4.0.
• Strategy logic, Stochastic confirmation, EMA Exit Filter, and risk-management layer:
- Modifications by jokiniemi.
Please respect both the original license and TradingView House Rules if you fork or republish any part of this script.
────────────────────────
10. No payments / no vendor pitch
────────────────────────
• This script is completely FREE to use on TradingView.
• There is no paid subscription, no external payment link, and no private signals group attached to it.
• If you have questions, please use TradingView’s comment system or private messages instead of expecting financial advice.
Use this script as a tool to learn, experiment, and build your own understanding of markets.
────────────────────────
11. Example backtest settings used in screenshots
────────────────────────
To avoid any confusion about how the results shown in screenshots were produced, here is one concrete example configuration:
• Symbol: BTCUSDT (or similar major BTC pair)
• Timeframe: 1D (Daily)
• Backtest period: from 2018 to the most recent data
• Initial capital: 10 000
• Order size type: Percent of equity
• Order size: 2% per trade
• Commission: 0.1%
• Slippage: 3 ticks
• Risk settings: Stop Loss and Take Profit disabled by default, Risk/Reward exit disabled by default
• Filters: Range Oscillator entry/exit enabled, Stochastic confirmation enabled, EMA Exit Filter enabled
If you change any of these settings (symbol, timeframe, risk per trade, commission, slippage, filters, etc.), your results will look different. Please always adapt the configuration to your own risk tolerance, market, and trading style.
