Institutional Volume Profile# Institutional Volume Profile (IVP) - Advanced Volume Analysis Indicator
## Overview
The Institutional Volume Profile (IVP) is a sophisticated technical analysis tool that combines traditional volume profile analysis with institutional volume detection algorithms. This indicator helps traders identify key price levels where significant institutional activity has occurred, providing insights into market structure and potential support/resistance zones.
## Key Features
### 🎯 Volume Profile Analysis
- **Point of Control (POC)**: Identifies the price level with the highest volume activity
- **Value Area**: Highlights the price range containing a specified percentage (default 70%) of total volume
- **Multi-Row Distribution**: Displays volume distribution across 10-50 price levels for detailed analysis
- **Customizable Period**: Analyze volume profiles over 10-500 bars
### 🏛️ Institutional Volume Detection
- **Pocket Pivot Volume (PPV)**: Detects bullish institutional buying when up-volume exceeds recent down-volume peaks
- **Pivot Negative Volume (PNV)**: Identifies bearish institutional selling when down-volume exceeds recent up-volume peaks
- **Accumulation Detection**: Spots potential accumulation phases with high volume and narrow price ranges
- **Distribution Analysis**: Identifies distribution patterns with high volume but minimal price movement
### 🎨 Visual Customization Options
- **Multiple Color Schemes**: Heat Map, Institutional, Monochrome, and Rainbow themes
- **Bar Styles**: Solid, Gradient, Outlined, and 3D Effect rendering
- **Volume Intensity Display**: Visual intensity based on volume magnitude
- **Flexible Positioning**: Left or right side profile placement
- **Current Price Highlighting**: Real-time price level indication
### 📊 Advanced Visual Features
- **Volume Labels**: Display volume amounts at key price levels
- **Gradient Effects**: Multi-step gradient rendering for enhanced visibility
- **3D Styling**: Shadow effects for professional appearance
- **Opacity Control**: Adjustable transparency (10-100%)
- **Border Customization**: Configurable border width and styling
## How It Works
### Volume Distribution Algorithm
The indicator analyzes each bar within the specified period and distributes its volume proportionally across the price levels it touches. This creates an accurate representation of where trading activity has been concentrated.
### Institutional Detection Logic
- **PPV Trigger**: Current up-bar volume > highest down-volume in lookback period + above volume MA
- **PNV Trigger**: Current down-bar volume > highest up-volume in lookback period + above volume MA
- **Accumulation**: High volume + narrow range + bullish close
- **Distribution**: Very high volume + minimal price movement
### Value Area Calculation
Starting from the POC, the algorithm expands both upward and downward, adding volume until reaching the specified percentage of total volume (default 70%).
## Configuration Parameters
### Profile Settings
- **Profile Period**: 10-500 bars (default: 50)
- **Number of Rows**: 10-50 levels (default: 24)
- **Profile Width**: 10-100% of screen (default: 30%)
- **Value Area %**: 50-90% (default: 70%)
### Institutional Analysis
- **PPV Lookback Days**: 5-20 periods (default: 10)
- **Volume MA Length**: 10-200 periods (default: 50)
- **Institutional Threshold**: 1.0-2.0x multiplier (default: 1.2)
### Visual Controls
- **Bar Style**: Solid, Gradient, Outlined, 3D Effect
- **Color Scheme**: Heat Map, Institutional, Monochrome, Rainbow
- **Profile Position**: Left or Right side
- **Opacity**: 10-100%
- **Show Labels**: Volume amount display toggle
## Interpretation Guide
### Volume Profile Elements
- **Thick Horizontal Bars**: High volume nodes (strong support/resistance)
- **Thin Horizontal Bars**: Low volume nodes (weak levels)
- **White Line (POC)**: Strongest support/resistance level
- **Blue Highlighted Area**: Value Area (fair value zone)
### Institutional Signals
- **Blue Triangles (PPV)**: Bullish institutional buying detected
- **Orange Triangles (PNV)**: Bearish institutional selling detected
- **Color-Coded Bars**: Different colors indicate institutional activity types
### Color Scheme Meanings
- **Heat Map**: Red (high volume) → Orange → Yellow → Gray (low volume)
- **Institutional**: Blue (PPV), Orange (PNV), Aqua (Accumulation), Yellow (Distribution)
- **Monochrome**: Grayscale intensity based on volume
- **Rainbow**: Color-coded by price level position
## Trading Applications
### Support and Resistance
- POC acts as dynamic support/resistance
- High volume nodes indicate strong price levels
- Low volume areas suggest potential breakout zones
### Institutional Activity
- PPV above Value Area: Strong bullish signal
- PNV below Value Area: Strong bearish signal
- Accumulation patterns: Potential upward breakouts
- Distribution patterns: Potential downward pressure
### Market Structure Analysis
- Value Area defines fair value range
- Profile shape indicates market sentiment
- Volume gaps suggest potential price targets
## Alert Conditions
- PPV Detection at current price level
- PNV Detection at current price level
- PPV above Value Area (strong bullish)
- PNV below Value Area (strong bearish)
## Best Practices
1. Use multiple timeframes for confirmation
2. Combine with price action analysis
3. Pay attention to volume context (above/below average)
4. Monitor institutional signals near key levels
5. Consider overall market conditions
## Technical Notes
- Maximum 500 boxes and 100 labels for optimal performance
- Real-time calculations update on each bar close
- Historical analysis uses complete bar data
- Compatible with all TradingView chart types and timeframes
---
*This indicator is designed for educational and informational purposes. Always combine with other analysis methods and risk management strategies.*
Wyszukaj w skryptach "algo"

DisplayUtilitiesLibrary "DisplayUtilities"
Display utilities for color management and visual presentation
get_direction_color(direction, up_excessive, up_normal, neutral, down_normal, down_excessive)
Get candle color based on direction and color scheme
Parameters:
direction (int) : Direction value (-2, -1, 0, 1, 2)
up_excessive (color) : Color for +2 direction
up_normal (color) : Color for +1 direction
neutral (color) : Color for 0 direction
down_normal (color) : Color for -1 direction
down_excessive (color) : Color for -2 direction
Returns: Appropriate color for the direction
get_candle_paint_directions(paint_opt, body_dir, bar_dir, breakout_dir, combined_dir)
Get candle directions for different painting algorithms
Parameters:
paint_opt (string) : Painting option algorithm
body_dir (int) : Body direction
bar_dir (int) : Bar direction
breakout_dir (int) : Breakout direction
combined_dir (int) : Combined direction
Returns:
get_bias_paint_directions(paint_bias, unified_dir)
Get paint directions based on bias filter
Parameters:
paint_bias (string) : Paint bias option ("All", "Bull Bias", "Bear Bias")
unified_dir (int) : Unified direction
Returns: Directions for two plotcandle series
get_transparency_levels(sf_filtered, fade_option, fade_opacity)
Calculate transparency levels for strength factor filtering
Parameters:
sf_filtered (bool) : Is strength factor filtered
fade_option (string) : Fade option ("Disabled", "Fade Candle", "Do Not Fade Wick", "Do Not Fade Wick and Border")
fade_opacity (int) : Fade opacity percentage
Returns:
get_strength_factor_filter(filter_option, individual_filters)
Generate strength factor filter conditions
Parameters:
filter_option (string) : Filter option string
individual_filters (map) : Map of individual filter conditions
Returns: Boolean filter result
get_signal_bar_condition(signal_option, individual_filters)
Generate signal bar conditions (inverted filters)
Parameters:
signal_option (string) : Signal bar option string
individual_filters (map) : Map of individual filter conditions
Returns: Boolean signal bar result
get_zscore_signal_condition(z_signal_option, z_filters)
Get Z-score signal bar conditions
Parameters:
z_signal_option (string) : Z-score signal option
z_filters (map) : Map of Z-score filters
Returns: Boolean Z-score signal condition
get_standard_colors()
Create a standard color scheme for directions
Returns: Standard color set
apply_zscore_modification(original_dir, z_filtered)
Modify directions for Z-score excess display
Parameters:
original_dir (int) : Original direction
z_filtered (bool) : Is Z-score filtered (shows excess)
Returns: Modified direction (doubled if excess detected)
get_default_fade_colors()
Get default fade colors for strength factor overlay
Returns: Default colors for TV overlay
should_paint_candles(paint_algo)
Check if paint algorithm should show candles
Parameters:
paint_algo (string) : Paint algorithm option
Returns: True if algorithm should display candles
get_signal_bar_char(signal_type, is_bullish)
Get signal bar character based on signal type
Parameters:
signal_type (string) : Signal type ("strength_factor" or "zscore")
is_bullish (bool) : Direction is bullish
Returns: Character and location for plotchar
get_signal_bar_color(signal_type, is_bullish)
Get signal bar colors
Parameters:
signal_type (string) : Signal type ("strength_factor" or "zscore")
is_bullish (bool) : Direction is bullish
Returns: Signal bar color

Why EMA Isn't What You Think It IsMany new traders adopt the Exponential Moving Average (EMA) believing it's simply a "better Simple Moving Average (SMA)". This common misconception leads to fundamental misunderstandings about how EMA works and when to use it.
EMA and SMA differ at their core. SMA use a window of finite number of data points, giving equal weight to each data point in the calculation period. This makes SMA a Finite Impulse Response (FIR) filter in signal processing terms. Remember that FIR means that "all that we need is the 'period' number of data points" to calculate the filter value. Anything beyond the given period is not relevant to FIR filters – much like how a security camera with 14-day storage automatically overwrites older footage, making last month's activity completely invisible regardless of how important it might have been.
EMA, however, is an Infinite Impulse Response (IIR) filter. It uses ALL historical data, with each past price having a diminishing - but never zero - influence on the calculated value. This creates an EMA response that extends infinitely into the past—not just for the last N periods. IIR filters cannot be precise if we give them only a 'period' number of data to work on - they will be off-target significantly due to lack of context, like trying to understand Game of Thrones by watching only the final season and wondering why everyone's so upset about that dragon lady going full pyromaniac.
If we only consider a number of data points equal to the EMA's period, we are capturing no more than 86.5% of the total weight of the EMA calculation. Relying on he period window alone (the warm-up period) will provide only 1 - (1 / e^2) weights, which is approximately 1−0.1353 = 0.8647 = 86.5%. That's like claiming you've read a book when you've skipped the first few chapters – technically, you got most of it, but you probably miss some crucial early context.
▶️ What is period in EMA used for?
What does a period parameter really mean for EMA? When we select a 15-period EMA, we're not selecting a window of 15 data points as with an SMA. Instead, we are using that number to calculate a decay factor (α) that determines how quickly older data loses influence in EMA result. Every trader knows EMA calculation: α = 1 / (1+period) – or at least every trader claims to know this while secretly checking the formula when they need it.
Thinking in terms of "period" seriously restricts EMA. The α parameter can be - should be! - any value between 0.0 and 1.0, offering infinite tuning possibilities of the indicator. When we limit ourselves to whole-number periods that we use in FIR indicators, we can only access a small subset of possible IIR calculations – it's like having access to the entire RGB color spectrum with 16.7 million possible colors but stubbornly sticking to the 8 basic crayons in a child's first art set because the coloring book only mentioned those by name.
For example:
Period 10 → alpha = 0.1818
Period 11 → alpha = 0.1667
What about wanting an alpha of 0.17, which might yield superior returns in your strategy that uses EMA? No whole-number period can provide this! Direct α parameterization offers more precision, much like how an analog tuner lets you find the perfect radio frequency while digital presets force you to choose only from predetermined stations, potentially missing the clearest signal sitting right between channels.
Sidenote: the choice of α = 1 / (1+period) is just a convention from 1970s, probably started by J. Welles Wilder, who popularized the use of the 14-day EMA. It was designed to create an approximate equivalence between EMA and SMA over the same number of periods, even thought SMA needs a period window (as it is FIR filter) and EMA doesn't. In reality, the decay factor α in EMA should be allowed any valye between 0.0 and 1.0, not just some discrete values derived from an integer-based period! Algorithmic systems should find the best α decay for EMA directly, allowing the system to fine-tune at will and not through conversion of integer period to float α decay – though this might put a few traditionalist traders into early retirement. Well, to prevent that, most traditionalist implementations of EMA only use period and no alpha at all. Heaven forbid we disturb people who print their charts on paper, draw trendlines with rulers, and insist the market "feels different" since computers do algotrading!
▶️ Calculating EMAs Efficiently
The standard textbook formula for EMA is:
EMA = CurrentPrice × alpha + PreviousEMA × (1 - alpha)
But did you know that a more efficient version exists, once you apply a tiny bit of high school algebra:
EMA = alpha × (CurrentPrice - PreviousEMA) + PreviousEMA
The first one requires three operations: 2 multiplications + 1 addition. The second one also requires three ops: 1 multiplication + 1 addition + 1 subtraction.
That's pathetic, you say? Not worth implementing? In most computational models, multiplications cost much more than additions/subtractions – much like how ordering dessert costs more than asking for a water refill at restaurants.
Relative CPU cost of float operations :
Addition/Subtraction: ~1 cycle
Multiplication: ~5 cycles (depending on precision and architecture)
Now you see the difference? 2 * 5 + 1 = 11 against 5 + 1 + 1 = 7. That is ≈ 36.36% efficiency gain just by swapping formulas around! And making your high school math teacher proud enough to finally put your test on the refrigerator.
▶️ The Warmup Problem: how to start the EMA sequence right
How do we calculate the first EMA value when there's no previous EMA available? Let's see some possible options used throughout the history:
Start with zero : EMA(0) = 0. This creates stupidly large distortion until enough bars pass for the horrible effect to diminish – like starting a trading account with zero balance but backdating a year of missed trades, then watching your balance struggle to climb out of a phantom debt for months.
Start with first price : EMA(0) = first price. This is better than starting with zero, but still causes initial distortion that will be extra-bad if the first price is an outlier – like forming your entire opinion of a stock based solely on its IPO day price, then wondering why your model is tanking for weeks afterward.
Use SMA for warmup : This is the tradition from the pencil-and-paper era of technical analysis – when calculators were luxury items and "algorithmic trading" meant your broker had neat handwriting. We first calculate an SMA over the initial period, then kickstart the EMA with this average value. It's widely used due to tradition, not merit, creating a mathematical Frankenstein that uses an FIR filter (SMA) during the initial period before abruptly switching to an IIR filter (EMA). This methodology is so aesthetically offensive (abrupt kink on the transition from SMA to EMA) that charting platforms hide these early values entirely, pretending EMA simply doesn't exist until the warmup period passes – the technical analysis equivalent of sweeping dust under the rug.
Use WMA for warmup : This one was never popular because it is harder to calculate with a pencil - compared to using simple SMA for warmup. Weighted Moving Average provides a much better approximation of a starting value as its linear descending profile is much closer to the EMA's decay profile.
These methods all share one problem: they produce inaccurate initial values that traders often hide or discard, much like how hedge funds conveniently report awesome performance "since strategy inception" only after their disastrous first quarter has been surgically removed from the track record.
▶️ A Better Way to start EMA: Decaying compensation
Think of it this way: An ideal EMA uses an infinite history of prices, but we only have data starting from a specific point. This creates a problem - our EMA starts with an incorrect assumption that all previous prices were all zero, all close, or all average – like trying to write someone's biography but only having information about their life since last Tuesday.
But there is a better way. It requires more than high school math comprehension and is more computationally intensive, but is mathematically correct and numerically stable. This approach involves compensating calculated EMA values for the "phantom data" that would have existed before our first price point.
Here's how phantom data compensation works:
We start our normal EMA calculation:
EMA_today = EMA_yesterday + α × (Price_today - EMA_yesterday)
But we add a correction factor that adjusts for the missing history:
Correction = 1 at the start
Correction = Correction × (1-α) after each calculation
We then apply this correction:
True_EMA = Raw_EMA / (1-Correction)
This correction factor starts at 1 (full compensation effect) and gets exponentially smaller with each new price bar. After enough data points, the correction becomes so small (i.e., below 0.0000000001) that we can stop applying it as it is no longer relevant.
Let's see how this works in practice:
For the first price bar:
Raw_EMA = 0
Correction = 1
True_EMA = Price (since 0 ÷ (1-1) is undefined, we use the first price)
For the second price bar:
Raw_EMA = α × (Price_2 - 0) + 0 = α × Price_2
Correction = 1 × (1-α) = (1-α)
True_EMA = α × Price_2 ÷ (1-(1-α)) = Price_2
For the third price bar:
Raw_EMA updates using the standard formula
Correction = (1-α) × (1-α) = (1-α)²
True_EMA = Raw_EMA ÷ (1-(1-α)²)
With each new price, the correction factor shrinks exponentially. After about -log₁₀(1e-10)/log₁₀(1-α) bars, the correction becomes negligible, and our EMA calculation matches what we would get if we had infinite historical data.
This approach provides accurate EMA values from the very first calculation. There's no need to use SMA for warmup or discard early values before output converges - EMA is mathematically correct from first value, ready to party without the awkward warmup phase.
Here is Pine Script 6 implementation of EMA that can take alpha parameter directly (or period if desired), returns valid values from the start, is resilient to dirty input values, uses decaying compensator instead of SMA, and uses the least amount of computational cycles possible.
// Enhanced EMA function with proper initialization and efficient calculation
ema(series float source, simple int period=0, simple float alpha=0)=>
// Input validation - one of alpha or period must be provided
if alpha<=0 and period<=0
runtime.error("Alpha or period must be provided")
// Calculate alpha from period if alpha not directly specified
float a = alpha > 0 ? alpha : 2.0 / math.max(period, 1)
// Initialize variables for EMA calculation
var float ema = na // Stores raw EMA value
var float result = na // Stores final corrected EMA
var float e = 1.0 // Decay compensation factor
var bool warmup = true // Flag for warmup phase
if not na(source)
if na(ema)
// First value case - initialize EMA to zero
// (we'll correct this immediately with the compensation)
ema := 0
result := source
else
// Standard EMA calculation (optimized formula)
ema := a * (source - ema) + ema
if warmup
// During warmup phase, apply decay compensation
e *= (1-a) // Update decay factor
float c = 1.0 / (1.0 - e) // Calculate correction multiplier
result := c * ema // Apply correction
// Stop warmup phase when correction becomes negligible
if e <= 1e-10
warmup := false
else
// After warmup, EMA operates without correction
result := ema
result // Return the properly compensated EMA value
▶️ CONCLUSION
EMA isn't just a "better SMA"—it is a fundamentally different tool, like how a submarine differs from a sailboat – both float, but the similarities end there. EMA responds to inputs differently, weighs historical data differently, and requires different initialization techniques.
By understanding these differences, traders can make more informed decisions about when and how to use EMA in trading strategies. And as EMA is embedded in so many other complex and compound indicators and strategies, if system uses tainted and inferior EMA calculatiomn, it is doing a disservice to all derivative indicators too – like building a skyscraper on a foundation of Jell-O.
The next time you add an EMA to your chart, remember: you're not just looking at a "faster moving average." You're using an INFINITE IMPULSE RESPONSE filter that carries the echo of all previous price actions, properly weighted to help make better trading decisions.
EMA done right might significantly improve the quality of all signals, strategies, and trades that rely on EMA somewhere deep in its algorithmic bowels – proving once again that math skills are indeed useful after high school, no matter what your guidance counselor told you.

Smarter Money Concepts - OBs [PhenLabs]📊 Smarter Money Concepts - OBs
Version: PineScript™ v6
📌 Description
Smarter Money Concepts - OBs (Order Blocks) is an advanced technical analysis tool designed to identify and visualize institutional order zones on your charts. Order blocks represent significant areas of liquidity where smart money has entered positions before major moves. By tracking these zones, traders can anticipate potential reversals, continuations, and key reaction points in price action.
This indicator incorporates volume filtering technology to identify only the most significant order blocks, eliminating low-quality signals and focusing on areas where institutional participation is likely present. The combination of price structure analysis and volume confirmation provides traders with high-probability zones that may attract future price action for tests, rejections, or breakouts.
🚀 Points of Innovation
Volume-Filtered Block Detection : Identifies only order blocks formed with significant volume, focusing on areas with institutional participation
Advanced Break of Structure Logic : Uses sophisticated price action analysis to detect legitimate market structure breaks preceding order blocks
Dynamic Block Management : Intelligently tracks, extends, and removes order blocks based on price interaction and time-based expiration
Structure Recognition System : Employs technical analysis algorithms to find significant swing points for accurate order block identification
Dual Directional Tracking : Simultaneously monitors both bullish and bearish order blocks for comprehensive market structure analysis
🔧 Core Components
Order Block Detection : Identifies institutional entry zones by analyzing price action before significant breaks of structure, capturing where smart money has likely positioned before moves.
Volume Filtering Algorithm : Calculates relative volume compared to a moving average to qualify only order blocks formed with significant market participation, eliminating noise.
Structure Break Recognition : Uses price action analysis to detect legitimate breaks of market structure, ensuring order blocks are identified only at significant market turning points.
Dynamic Block Management : Continuously monitors price interaction with existing blocks, extending, maintaining, or removing them based on current market behavior.
🔥 Key Features
Volume-Based Filtering : Filter out insignificant blocks by requiring a minimum volume threshold, focusing only on zones with likely institutional activity
Visual Block Highlighting : Color-coded boxes clearly mark bullish and bearish order blocks with customizable appearance
Flexible Mitigation Options : Choose between “Wick” or “Close” methods for determining when a block has been tested or mitigated
Scan Range Adjustment : Customize how far back the indicator looks for structure points to adapt to different market conditions and timeframes
Break Source Selection : Configure which price component (close, open, high, low) is used to determine structure breaks for precise block identification
🎨 Visualization
Bullish Order Blocks : Blue-colored rectangles highlighting zones where bullish institutional orders were likely placed before upward moves, representing potential support areas.
Bearish Order Blocks : Red-colored rectangles highlighting zones where bearish institutional orders were likely placed before downward moves, representing potential resistance areas.
Block Extension : Order blocks extend to the right of the chart, providing clear visualization of these significant zones as price continues to develop.
📖 Usage Guidelines
Order Block Settings
Scan Range : Default: 25. Defines how many bars the indicator scans to determine significant structure points for order block identification.
Bull Break Price Source : Default: Close. Determines which price component is used to detect bullish breaks of structure.
Bear Break Price Source : Default: Close. Determines which price component is used to detect bearish breaks of structure.
Visual Settings
Bullish Blocks Color : Default: Blue with 85% transparency. Controls the appearance of bullish order blocks.
Bearish Blocks Color : Default: Red with 85% transparency. Controls the appearance of bearish order blocks.
General Options
Block Mitigation Method : Default: Wick, Options: Wick, Close. Determines how block mitigation is calculated - “Wick” uses high/low values while “Close” uses close values for more conservative mitigation criteria.
Remove Filled Blocks : Default: Disabled. When enabled, order blocks are removed once they’ve been mitigated by price action.
Volume Filter
Volume Filter Enabled : Default: Enabled. When activated, only shows order blocks formed with significant volume relative to recent average.
Volume SMA Period : Default: 15, Range: 1-50. Number of periods used to calculate the average volume baseline.
Min. Volume Ratio : Default: 1.5, Range: 0.5-10.0. Minimum volume ratio compared to average required to display an order block; higher values filter out more blocks.
✅ Best Use Cases
Identifying high-probability support and resistance zones for trade entries and exits
Finding optimal stop-loss placement behind significant order blocks
Detecting potential reversal areas where price may react after extended moves
Confirming breakout trades when price clears major order blocks
Building a comprehensive market structure map for medium to long-term trading decisions
Pinpointing areas where smart money may have positioned before major market moves
⚠️ Limitations
Most effective on higher timeframes (1H and above) where institutional activity is more clearly defined
Can generate multiple signals in choppy market conditions, requiring additional filtering
Volume filtering relies on accurate volume data, which may be less reliable for some securities
Recent market structure changes may invalidate older order blocks not yet automatically removed
Block identification is based on historical price action and may not predict future behavior with certainty
💡 What Makes This Unique
Volume Intelligence : Unlike basic order block indicators, this script incorporates volume analysis to identify only the most significant institutional zones, focusing on quality over quantity.
Structural Precision : Uses sophisticated break of structure algorithms to identify true market turning points, going beyond simple price pattern recognition.
Dynamic Block Management : Implements automatic block tracking, extension, and cleanup to maintain a clean and relevant chart display without manual intervention.
Institutional Focus : Designed specifically to highlight areas where smart money has likely positioned, helping retail traders align with institutional perspectives rather than retail noise.
🔬 How It Works
1. Structure Identification Process :
The indicator continuously scans price action to identify significant swing points and structure levels within the specified range, establishing a foundation for order block recognition.
2. Break Detection :
When price breaks an established structure level (crossing below a significant low for bearish breaks or above a significant high for bullish breaks), the indicator marks this as a potential zone for order block formation.
3. Volume Qualification :
For each potential order block, the algorithm calculates the relative volume compared to the configured period average. Only blocks formed with volume exceeding the minimum ratio threshold are displayed.
4. Block Creation and Management :
Valid order blocks are created, tracked, and managed as price continues to develop. Blocks extend to the right of the chart until they are either mitigated by price action or expire after the designated timeframe.
5. Continuous Monitoring :
The indicator constantly evaluates price interaction with existing blocks, determining when blocks have been tested, mitigated, or invalidated, and updates the visual representation accordingly.
💡 Note:
Order Blocks represent areas where institutional traders have likely established positions and may defend these zones during future price visits. For optimal results, use this indicator in conjunction with other confluent factors such as key support/resistance levels, trendlines, or additional confirmation indicators. The most reliable signals typically occur on higher timeframes where institutional activity is most prominent. Start with the default settings and adjust parameters gradually to match your specific trading instrument and style.

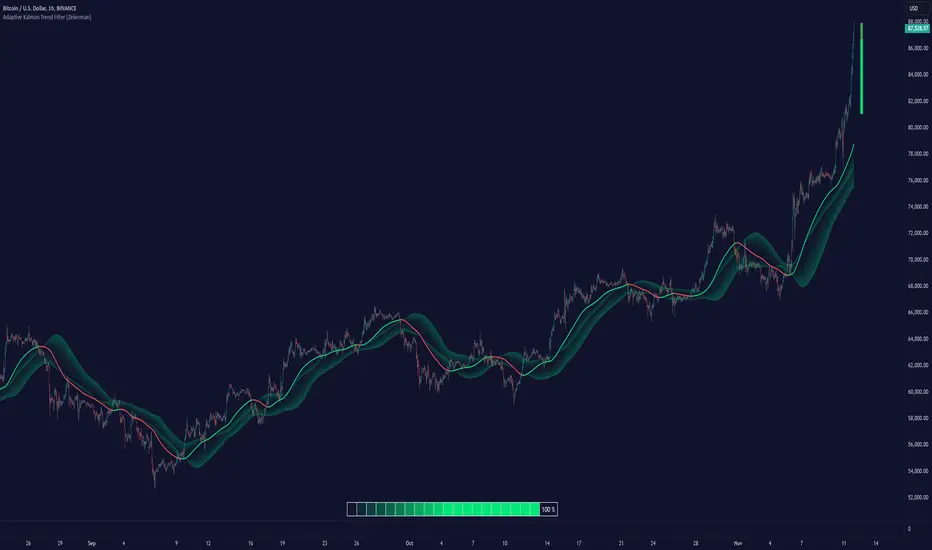
Adaptive Kalman Trend Filter (Zeiierman)█ Overview
The Adaptive Kalman Trend Filter indicator is an advanced trend-following tool designed to help traders accurately identify market trends. Utilizing the Kalman Filter—a statistical algorithm rooted in control theory and signal processing—this indicator adapts to changing market conditions, smoothing price data to filter out noise. By focusing on state vector-based calculations, it dynamically adjusts trend and range measurements, making it an excellent tool for both trend-following and range-based trading strategies. The indicator's adaptive nature is enhanced by options for volatility adjustment and three unique Kalman filter models, each tailored for different market conditions.
█ How It Works
The Kalman Filter works by maintaining a model of the market state through matrices that represent state variables, error covariances, and measurement uncertainties. Here’s how each component plays a role in calculating the indicator’s trend:
⚪ State Vector (X): The state vector is a two-dimensional array where each element represents a market property. The first element is an estimate of the true price, while the second element represents the rate of change or trend in that price. This vector is updated iteratively with each new price, maintaining an ongoing estimate of both price and trend direction.
⚪ Covariance Matrix (P): The covariance matrix represents the uncertainty in the state vector’s estimates. It continuously adapts to changing conditions, representing how much error we expect in our trend and price estimates. Lower covariance values suggest higher confidence in the estimates, while higher values indicate less certainty, often due to market volatility.
⚪ Process Noise (Q): The process noise matrix (Q) is used to account for uncertainties in price movements that aren’t explained by historical trends. By allowing some degree of randomness, it enables the Kalman Filter to remain responsive to new data without overreacting to minor fluctuations. This noise is particularly useful in smoothing out price movements in highly volatile markets.
⚪ Measurement Noise (R): Measurement noise is an external input representing the reliability of each new price observation. In this indicator, it is represented by the setting Measurement Noise and determines how much weight is given to each new price point. Higher measurement noise makes the indicator less reactive to recent prices, smoothing the trend further.
⚪ Update Equations:
Prediction: The state vector and covariance matrix are first projected forward using a state transition matrix (F), which includes market estimates based on past data. This gives a “predicted” state before the next actual price is known.
Kalman Gain Calculation: The Kalman gain is calculated by comparing the predicted state with the actual price, balancing between the covariance matrix and measurement noise. This gain determines how much of the observed price should influence the state vector.
Correction: The observed price is then compared to the predicted price, and the state vector is updated using this Kalman gain. The updated covariance matrix reflects any adjustment in uncertainty based on the latest data.
█ Three Kalman Filter Models
Standard Model: Assumes that market fluctuations follow a linear progression without external adjustments. It is best suited for stable markets.
Volume Adjusted Model: Adjusts the filter sensitivity based on trading volume. High-volume periods result in stronger trends, making this model suitable for volume-driven assets.
Parkinson Adjusted Model: Uses the Parkinson estimator, accounting for volatility through high-low price ranges, making it effective in markets with high intraday fluctuations.
These models enable traders to choose a filter that aligns with current market conditions, enhancing trend accuracy and responsiveness.
█ Trend Strength
The Trend Strength provides a visual representation of the current trend's strength as a percentage based on oscillator calculations from the Kalman filter. This table divides trend strength into color-coded segments, helping traders quickly assess whether the market is strongly trending or nearing a reversal point. A high trend strength percentage indicates a robust trend, while a low percentage suggests weakening momentum or consolidation.
█ Trend Range
The Trend Range section evaluates the market's directional movement over a specified lookback period, highlighting areas where price oscillations indicate a trend. This calculation assesses how prices vary within the range, offering an indication of trend stability or the likelihood of reversals. By adjusting the trend range setting, traders can fine-tune the indicator’s sensitivity to longer or shorter trends.
█ Sigma Bands
The Sigma Bands in the indicator are based on statistical standard deviations (sigma levels), which act as dynamic support and resistance zones. These bands are calculated using the Kalman Filter's trend estimates and adjusted for volatility (if enabled). The bands expand and contract according to market volatility, providing a unique visualization of price boundaries. In high-volatility periods, the bands widen, offering better protection against false breakouts. During low volatility, the bands narrow, closely tracking price movements. Traders can use these sigma bands to spot potential entry and exit points, aiming for reversion trades or trend continuation setups.
Trend Based
Volatility Based
█ How to Use
Trend Following:
When the Kalman Filter is green, it signals a bullish trend, and when it’s red, it indicates a bearish trend. The Sigma Cloud provides additional insights into trend strength. In a strong bullish trend, the cloud remains below the Kalman Filter line, while in a strong bearish trend, the cloud stays above it. Expansion and contraction of the Sigma Cloud indicate market momentum changes. Rapid expansion suggests an impulsive move, which could either signal the continuation of the trend or be an early sign of a possible trend reversal.
Mean Reversion: Watch for prices touching the upper or lower sigma bands, which often act as dynamic support and resistance.
Volatility Breakouts: Enable volatility-adjusted sigma bands. During high volatility, watch for price movements that extend beyond the bands as potential breakout signals.
Trend Continuation: When the Kalman Filter line aligns with a high trend strength, it signals a continuation in that direction.
█ Settings
Measurement Noise: Adjusts how sensitive the indicator is to price changes. Higher values smooth out fluctuations but delay reaction, while lower values increase sensitivity to short-term changes.
Kalman Filter Model: Choose between the standard, volume-adjusted, and Parkinson-adjusted models based on market conditions.
Band Sigma: Sets the standard deviation used for calculating the sigma bands, directly affecting the width of the dynamic support and resistance.
Volatility Adjusted Bands: Enables bands to dynamically adapt to volatility, increasing their effectiveness in fluctuating markets.
Trend Strength: Defines the lookback period for trend strength calculation. Shorter periods result in more responsive trend strength readings, while longer periods smooth out the calculation.
Trend Range: Specifies the lookback period for the trend range, affecting the assessment of trend stability over time.
-----------------
Disclaimer
The information contained in my Scripts/Indicators/Ideas/Algos/Systems does not constitute financial advice or a solicitation to buy or sell any securities of any type. I will not accept liability for any loss or damage, including without limitation any loss of profit, which may arise directly or indirectly from the use of or reliance on such information.
All investments involve risk, and the past performance of a security, industry, sector, market, financial product, trading strategy, backtest, or individual's trading does not guarantee future results or returns. Investors are fully responsible for any investment decisions they make. Such decisions should be based solely on an evaluation of their financial circumstances, investment objectives, risk tolerance, and liquidity needs.
My Scripts/Indicators/Ideas/Algos/Systems are only for educational purposes!
RSI (Kernel Optimized) | Flux Charts💎 GENERAL OVERVIEW
Introducing our new KDE Optimized RSI Indicator! This indicator adds a new aspect to the well-known RSI indicator, with the help of the KDE (Kernel Density Estimation) algorithm, estimates the probability of a candlestick will be a pivot or not. For more information about the process, please check the "HOW DOES IT WORK ?" section.
Features of the new KDE Optimized RSI Indicator :
A New Approach To Pivot Detection
Customizable KDE Algorithm
Realtime RSI & KDE Dashboard
Alerts For Possible Pivots
Customizable Visuals
❓ HOW TO INTERPRET THE KDE %
The KDE % is a critical metric that reflects how closely the current RSI aligns with the KDE (Kernel Density Estimation) array. In simple terms, it represents the likelihood that the current candlestick is forming a pivot point based on historical data patterns. a low percentage suggests a lower probability of the current candlestick being a pivot point. In these cases, price action is less likely to reverse, and existing trends may continue. At moderate levels, the possibility of a pivot increases, indicating potential trend shifts or consolidations.Traders should start monitoring closely for confirmation signals. An even higher KDE % suggests a strong likelihood that the current candlestick could form a pivot point, which could lead to a reversal or significant price movement. These points often align with overbought or oversold conditions in traditional RSI analysis, making them key moments for potential trade entry or exit.
📌 HOW DOES IT WORK ?
The RSI (Relative Strength Index) is a widely used oscillator among traders. It outputs a value between 0 - 100 and gives a glimpse about the current momentum of the price action. This indicator then calculates the RSI for each candlesticks, and saves them into an array if the candlestick is a pivot. The low & high pivot RSIs' are inserted into two different arrays. Then the a KDE array is calculated for both of the low & high pivot RSI arrays. Explaining the KDE might be too much for this write-up, but for a brief explanation, here are the steps :
1. Define the necessary options for the KDE function. These are : Bandwidth & Nº Steps, Array Range (Array Max - Array Min)
2. After that, create a density range array. The array has (steps * 2 - 1) elements and they are calculated by (arrMin + i * stepCount), i being the index.
3. Then, define a kernel function. This indicator has 3 different kernel distribution modes : Uniform, Gaussian and Sigmoid
4. Then, define a temporary value for the current element of KDE array.
5. For each element E in the pivot RSI array, add "kernel(densityRange.get(i) - E, 1.0 / bandwidth)" to the temporary value.
6. Add 1.0 / arrSize * to the KDE array.
Then the prefix sum array of the KDE array is calculated. For each candlestick, the index closest to it's RSI value in the KDE array is found using binary search. Then for the low pivot KDE calculation, the sum of KDE values from found index to max index is calculated. For the high pivot KDE, the sum of 0 to found index is used. Then if high or low KDE value is greater than the activation threshold determined in the settings, a bearish or bullish arrow is plotted after bar confirmation respectively. The arrows are drawn as long as the KDE value of current candlestick is greater than the threshold. When the KDE value is out of the threshold, a less transparent arrow is drawn, indicating a possible pivot point.
🚩 UNIQUENESS
This indicator combines RSI & KDE Algorithm to get a foresight of possible pivot points. Pivot points are important entry, confirmation and exit points for traders. But to their nature, they can be only detected after more candlesticks are rendered after them. The purpose of this indicator is to alert the traders of possible pivot points using KDE algorithm right away when they are confirmed. The indicator also has a dashboard for realtime view of the current RSI & Bullish or Bearish KDE value. You can fully customize the KDE algorithm and set up alerts for pivot detection.
⚙️ SETTINGS
1. RSI Settings
RSI Length -> The amount of bars taken into account for RSI calculation.
Source -> The source value for RSI calculation.
2. Pivots
Pivot Lengths -> Pivot lengths for both high & low pivots. For example, if this value is set to 21; 21 bars before AND 21 bars after a candlestick must be higher for a candlestick to be a low pivot.
3. KDE
Activation Threshold -> This setting determines the amount of arrows shown. Higher options will result in more arrows being rendered.
Kernel -> The kernel function as explained in the upper section.
Bandwidth -> The bandwidth variable as explained in the upper section. The smoothness of the KDE function is tied to this setting.
Nº Bins -> The Nº Steps variable as explained in the upper section. It determines the precision of the KDE algorithm.

Multiple Naked LevelsPURPOSE OF THE INDICATOR
This indicator autogenerates and displays naked levels and gaps of multiple types collected into one simple and easy to use indicator.
VALUE PROPOSITION OF THE INDICATOR AND HOW IT IS ORIGINAL AND USEFUL
1) CONVENIENCE : The purpose of this indicator is to offer traders with one coherent and robust indicator providing useful, valuable, and often used levels - in one place.
2) CLUSTERS OF CONFLUENCES : With this indicator it is easy to identify levels and zones on the chart with multiple confluences increasing the likelihood of a potential reversal zone.
THE TYPES OF LEVELS AND GAPS INCLUDED IN THE INDICATOR
The types of levels include the following:
1) PIVOT levels (Daily/Weekly/Monthly) depicted in the chart as: dnPIV, wnPIV, mnPIV.
2) POC (Point of Control) levels (Daily/Weekly/Monthly) depicted in the chart as: dnPoC, wnPoC, mnPoC.
3) VAH/VAL STD 1 levels (Value Area High/Low with 1 std) (Daily/Weekly/Monthly) depicted in the chart as: dnVAH1/dnVAL1, wnVAH1/wnVAL1, mnVAH1/mnVAL1
4) VAH/VAL STD 2 levels (Value Area High/Low with 2 std) (Daily/Weekly/Monthly) depicted in the chart as: dnVAH2/dnVAL2, wnVAH2/wnVAL2, mnVAH1/mnVAL2
5) FAIR VALUE GAPS (Daily/Weekly/Monthly) depicted in the chart as: dnFVG, wnFVG, mnFVG.
6) CME GAPS (Daily) depicted in the chart as: dnCME.
7) EQUILIBRIUM levels (Daily/Weekly/Monthly) depicted in the chart as dnEQ, wnEQ, mnEQ.
HOW-TO ACTIVATE LEVEL TYPES AND TIMEFRAMES AND HOW-TO USE THE INDICATOR
You can simply choose which of the levels to be activated and displayed by clicking on the desired radio button in the settings menu.
You can locate the settings menu by clicking into the Object Tree window, left-click on the Multiple Naked Levels and select Settings.
You will then get a menu of different level types and timeframes. Click the checkboxes for the level types and timeframes that you want to display on the chart.
You can then go into the chart and check out which naked levels that have appeared. You can then use those levels as part of your technical analysis.
The levels displayed on the chart can serve as additional confluences or as part of your overall technical analysis and indicators.
In order to back-test the impact of the different naked levels you can also enable tapped levels to be depicted on the chart. Do this by toggling the 'Show tapped levels' checkbox.
Keep in mind however that Trading View can not shom more than 500 lines and text boxes so the indocator will not be able to give you the complete history back to the start for long duration assets.
In order to clean up the charts a little bit there are two additional settings that can be used in the Settings menu:
- Selecting the price range (%) from the current price to be included in the chart. The default is 25%. That means that all levels below or above 20% will not be displayed. You can set this level yourself from 0 up to 100%.
- Selecting the minimum gap size to include on the chart. The default is 1%. That means that all gaps/ranges below 1% in price difference will not be displayed on the chart. You can set the minimum gap size yourself.
BASIC DESCRIPTION OF THE INNER WORKINGS OF THE INDICTATOR
The way the indicator works is that it calculates and identifies all levels from the list of levels type and timeframes above. The indicator then adds this level to a list of untapped levels.
Then for each bar after, it checks if the level has been tapped. If the level has been tapped or a gap/range completely filled, this level is removed from the list so that the levels displayed in the end are only naked/untapped levels.
Below is a descrition of each of the level types and how it is caluclated (algorithm):
PIVOT
Daily, Weekly and Monthly levels in trading refer to significant price points that traders monitor within the context of a single trading day. These levels can provide insights into market behavior and help traders make informed decisions regarding entry and exit points.
Traders often use D/W/M levels to set entry and exit points for trades. For example, entering long positions near support (daily close) or selling near resistance (daily close).
Daily levels are used to set stop-loss orders. Placing stops just below the daily close for long positions or above the daily close for short positions can help manage risk.
The relationship between price movement and daily levels provides insights into market sentiment. For instance, if the price fails to break above the daily high, it may signify bearish sentiment, while a strong breakout can indicate bullish sentiment.
The way these levels are calculated in this indicator is based on finding pivots in the chart on D/W/M timeframe. The level is then set to previous D/W/M close = current D/W/M open.
In addition, when price is going up previous D/W/M open must be smaller than previous D/W/M close and current D/W/M close must be smaller than the current D/W/M open. When price is going down the opposite.
POINT OF CONTROL
The Point of Control (POC) is a key concept in volume profile analysis, which is commonly used in trading.
It represents the price level at which the highest volume of trading occurred during a specific period.
The POC is derived from the volume traded at various price levels over a defined time frame. In this indicator the timeframes are Daily, Weekly, and Montly.
It identifies the price level where the most trades took place, indicating strong interest and activity from traders at that price.
The POC often acts as a significant support or resistance level. If the price approaches the POC from above, it may act as a support level, while if approached from below, it can serve as a resistance level. Traders monitor the POC to gauge potential reversals or breakouts.
The way the POC is calculated in this indicator is by an approximation by analysing intrabars for the respective timeperiod (D/W/M), assigning the volume for each intrabar into the price-bins that the intrabar covers and finally identifying the bin with the highest aggregated volume.
The POC is the price in the middle of this bin.
The indicator uses a sample space for intrabars on the Daily timeframe of 15 minutes, 35 minutes for the Weekly timeframe, and 140 minutes for the Monthly timeframe.
The indicator has predefined the size of the bins to 0.2% of the price at the range low. That implies that the precision of the calulated POC og VAH/VAL is within 0.2%.
This reduction of precision is a tradeoff for performance and speed of the indicator.
This also implies that the bigger the difference from range high prices to range low prices the more bins the algorithm will iterate over. This is typically the case when calculating the monthly volume profile levels and especially high volatility assets such as alt coins.
Sometimes the number of iterations becomes too big for Trading View to handle. In these cases the bin size will be increased even more to reduce the number of iterations.
In such cases the bin size might increase by a factor of 2-3 decreasing the accuracy of the Volume Profile levels.
Anyway, since these Volume Profile levels are approximations and since precision is traded for performance the user should consider the Volume profile levels(POC, VAH, VAL) as zones rather than pin point accurate levels.
VALUE AREA HIGH/LOW STD1/STD2
The Value Area High (VAH) and Value Area Low (VAL) are important concepts in volume profile analysis, helping traders understand price levels where the majority of trading activity occurs for a given period.
The Value Area High/Low is the upper/lower boundary of the value area, representing the highest price level at which a certain percentage of the total trading volume occurred within a specified period.
The VAH/VAL indicates the price point above/below which the majority of trading activity is considered less valuable. It can serve as a potential resistance/support level, as prices above/below this level may experience selling/buying pressure from traders who view the price as overvalued/undervalued
In this indicator the timeframes are Daily, Weekly, and Monthly. This indicator provides two boundaries that can be selected in the menu.
The first boundary is 70% of the total volume (=1 standard deviation from mean). The second boundary is 95% of the total volume (=2 standard deviation from mean).
The way VAH/VAL is calculated is based on the same algorithm as for the POC.
However instead of identifying the bin with the highest volume, we start from range low and sum up the volume for each bin until the aggregated volume = 30%/70% for VAL1/VAH1 and aggregated volume = 5%/95% for VAL2/VAH2.
Then we simply set the VAL/VAH equal to the low of the respective bin.
FAIR VALUE GAPS
Fair Value Gaps (FVG) is a concept primarily used in technical analysis and price action trading, particularly within the context of futures and forex markets. They refer to areas on a price chart where there is a noticeable lack of trading activity, often highlighted by a significant price movement away from a previous level without trading occurring in between.
FVGs represent price levels where the market has moved significantly without any meaningful trading occurring. This can be seen as a "gap" on the price chart, where the price jumps from one level to another, often due to a rapid market reaction to news, events, or other factors.
These gaps typically appear when prices rise or fall quickly, creating a space on the chart where no transactions have taken place. For example, if a stock opens sharply higher and there are no trades at the prices in between the two levels, it creates a gap. The areas within these gaps can be areas of liquidity that the market may return to “fill” later on.
FVGs highlight inefficiencies in pricing and can indicate areas where the market may correct itself. When the market moves rapidly, it may leave behind price levels that traders eventually revisit to establish fair value.
Traders often watch for these gaps as potential reversal or continuation points. Many traders believe that price will eventually “fill” the gap, meaning it will return to those price levels, providing potential entry or exit points.
This indicator calculate FVGs on three different timeframes, Daily, Weekly and Montly.
In this indicator the FVGs are identified by looking for a three-candle pattern on a chart, signalling a discrete imbalance in order volume that prompts a quick price adjustment. These gaps reflect moments where the market sentiment strongly leans towards buying or selling yet lacks the opposite orders to maintain price stability.
The indicator sets the gap to the difference from the high of the first bar to the low of the third bar when price is moving up or from the low of the first bar to the high of the third bar when price is moving down.
CME GAPS (BTC only)
CME gaps refer to price discrepancies that can occur in charts for futures contracts traded on the Chicago Mercantile Exchange (CME). These gaps typically arise from the fact that many futures markets, including those on the CME, operate nearly 24 hours a day but may have significant price movements during periods when the market is closed.
CME gaps occur when there is a difference between the closing price of a futures contract on one trading day and the opening price on the following trading day. This difference can create a "gap" on the price chart.
Opening Gaps: These usually happen when the market opens significantly higher or lower than the previous day's close, often influenced by news, economic data releases, or other market events occurring during non-trading hours.
Gaps can result from reactions to major announcements or developments, such as earnings reports, geopolitical events, or changes in economic indicators, leading to rapid price movements.
The importance of CME Gaps in Trading is the potential for Filling Gaps: Many traders believe that prices often "fill" gaps, meaning that prices may return to the gap area to establish fair value.
This can create potential trading opportunities based on the expectation of gap filling. Gaps can act as significant support or resistance levels. Traders monitor these levels to identify potential reversal points in price action.
The way the gap is identified in this indicator is by checking if current open is higher than previous bar close when price is moving up or if current open is lower than previous day close when price is moving down.
EQUILIBRIUM
Equilibrium in finance and trading refers to a state where supply and demand in a market balance each other, resulting in stable prices. It is a key concept in various economic and trading contexts. Here’s a concise description:
Market Equilibrium occurs when the quantity of a good or service supplied equals the quantity demanded at a specific price level. At this point, there is no inherent pressure for the price to change, as buyers and sellers are in agreement.
Equilibrium Price is the price at which the market is in equilibrium. It reflects the point where the supply curve intersects the demand curve on a graph. At the equilibrium price, the market clears, meaning there are no surplus goods or shortages.
In this indicator the equilibrium level is calculated simply by finding the midpoint of the Daily, Weekly, and Montly candles respectively.
NOTES
1) Performance. The algorithms are quite resource intensive and the time it takes the indicator to calculate all the levels could be 5 seconds or more, depending on the number of bars in the chart and especially if Montly Volume Profile levels are selected (POC, VAH or VAL).
2) Levels displayed vs the selected chart timeframe. On a timeframe smaller than the daily TF - both Daily, Weekly, and Monthly levels will be displayed. On a timeframe bigger than the daily TF but smaller than the weekly TF - the Weekly and Monthly levels will be display but not the Daily levels. On a timeframe bigger than the weekly TF but smaller than the monthly TF - only the Monthly levels will be displayed. Not Daily and Weekly.
CREDITS
The core algorithm for calculating the POC levels is based on the indicator "Naked Intrabar POC" developed by rumpypumpydumpy (https:www.tradingview.com/u/rumpypumpydumpy/).
The "Naked intrabar POC" indicator calculates the POC on the current chart timeframe.
This indicator (Multiple Naked Levels) adds two new features:
1) It calculates the POC on three specific timeframes, the Daily, Weekly, and Monthly timeframes - not only the current chart timeframe.
2) It adds functionaly by calculating the VAL and VAH of the volume profile on the Daily, Weekly, Monthly timeframes .

ICT Power Of Three | Flux Charts💎 GENERAL OVERVIEW
Introducing our new ICT Power Of Three Indicator! This indicator is built around the ICT's "Power Of Three" strategy. This strategy makes use of these 3 key smart money concepts : Accumulation, Manipulation and Distribution. Each step is explained in detail within this write-up. For more information about the process, check the "HOW DOES IT WORK" section.
Features of the new ICT Power Of Three Indicator :
Implementation of ICT's Power Of Three Strategy
Different Algorithm Modes
Customizable Execution Settings
Customizable Backtesting Dashboard
Alerts for Buy, Sell, TP & SL Signals
📌 HOW DOES IT WORK ?
The "Power Of Three" comes from these three keywords "Accumulation, Manipulation and Distribution". Here is a brief explanation of each keyword :
Accumulation -> Accumulation phase is when the smart money accumulate their positions in a fixed range. This phase indicates price stability, generally meaning that the price constantly switches between up & down trend between a low and a high pivot point. When the indicator detects an accumulation zone, the Power Of Three strategy begins.
Manipulation -> When the smart money needs to increase their position sizes, they need retail traders' positions for liquidity. So, they manipulate the market into the opposite direction of their intended direction. This will result in retail traders opening positions the way that the smart money intended them to do, creating liquidity. After this step, the real move that the smart money intended begins.
Distribution -> This is when the real intention of the smart money comes into action. With the new liquidity thanks to the manipulation phase, the smart money add their positions towards the opposite direction of the retail mindset. The purpose of this indicator is to detect the accumulation and manipulation phases, and help the trader move towards the same direction as the smart money for their trades.
Detection Methods Of The Indicator :
Accumulation -> The indicator detects accumulation zones as explained step-by-step :
1. Draw two lines from the lowest point and the highest point of the latest X bars.
2. If the (high line - low line) is lower than Average True Range (ATR) * accumulationConstant
3. After the condition is validated, an accumulation zone is detected. The accumulation zone will be invalidated and manipulation phase will begin when the range is broken.
Manipulation -> If the accumulation range is broken, check if the current bar closes / wicks above the (high line + ATR * manipulationConstant) or below the (low line - ATR * manipulationConstant). If the condition is met, the indicator detects a manipulation zone.
Distribution -> The purpose of this indicator is to try to foresee the distribution zone, so instead of a detection, after the manipulation zone is detected the indicator automatically create a "shadow" distribution zone towards the opposite direction of the freshly detected manipulation zone. This shadow distribution zone comes with a take-profit and stop-loss layout, customizable by the trader in the settings.
The X bars, accumulationConstant and manipulationConstant are subject to change with the "Algorithm Mode" setting. Read the "Settings" section for more information.
This indicator follows these steps and inform you step by step by plotting them in your chart.
🚩UNIQUENESS
This indicator is an all-in-one suite for the ICT's Power Of Three concept. It's capable of plotting the strategy, giving signals, a backtesting dashboard and alerts feature. Different and customizable algorithm modes will help the trader fine-tune the indicator for the asset they are currently trading. The backtesting dashboard allows you to see how your settings perform in the current ticker. You can also set up alerts to get informed when the strategy is executable for different tickers.
⚙️SETTINGS
1. General Configuration
Algorithm Mode -> The indicator offers 3 different detection algorithm modes according to your needs. Here is the explanation of each mode.
a) Small Manipulation
This mode has the default bar length for the accumulation detection, but a lower manipulation constant, meaning that slighter imbalances in the price action can be detected as manipulation. This setting can be useful on tickers that have lower liquidity, thus can be manipulated easier.
b) Big Manipulation
This mode has the default bar length for the accumulation detection, but a higher manipulation constant, meaning that heavier imbalances on the price action are required in order to detect manipulation zones. This setting can be useful on tickers that have higher liquidity, thus can be manipulated harder.
c) Short Accumulation
This mode has a ~70% lower bar length requirement for accumulation zone detection, and the default manipulation constant. This setting can be useful on tickers that are highly volatile and do not enter accumulation phases too often.
Breakout Method -> If "Close" is selected, bar close price will be taken into calculation when Accumulation & Manipulation zone invalidation. If "Wick" is selected, a wick will be enough to validate the corresponding zone.
2. TP / SL
TP / SL Method -> If "Fixed" is selected, you can adjust the TP / SL ratios from the settings below. If "Dynamic" is selected, the TP / SL zones will be auto-determined by the algorithm.
Risk -> The risk you're willing to take if "Dynamic" TP / SL Method is selected. Higher risk usually means a better winrate at the cost of losing more if the strategy fails. This setting is has a crucial effect on the performance of the indicator, as different tickers may have different volatility so the indicator may have increased performance when this setting is correctly adjusted.
3. Visuals
Show Zones -> Enables / Disables rendering of Accumulation (yellow) and Manipulation (red) zones.

ICT Concept [TradingFinder] Order Block | FVG | Liquidity Sweeps🔵 Introduction
The "ICT" style is one of the subsets of "Price Action" technical analysis. ICT is a method created by "Michael Huddleston", a professional forex trader and experienced mentor. The acronym ICT stands for "Inner Circle Trader".
The main objective of the ICT trading strategy is to combine "Price Action" and the concept of "Smart Money" to identify optimal entry points into trades. However, finding suitable entry points is not the only strength of this approach. With the ICT style, traders can better understand price behavior and adapt their trading approach to market structure accordingly.
Numerous concepts are discussed in this style, but the key practical concepts for trading in financial markets include "Order Block," "Liquidity," and "FVG".
🔵 How to Use
🟣Order Block
Order blocks are a specific type of "Supply and Demand" zones formed when a series of orders are placed in a block. These orders could be created by banks or other major players. Banks typically execute large orders in blocks during their trading sessions. If they were to enter the market directly with a small quantity, significant price movements would occur before the orders are fully executed, resulting in less profit. To avoid this, they divide their orders into smaller, manageable positions. Traders should look for "buy" opportunities in "demand order blocks" areas and "sell" opportunities in "supply order blocks".
🟣Liquidity
These levels are where traders aim to exit their trades. "Market Makers" or smart money usually collects or distributes their trading positions near levels where many retail traders have placed their "Stop Loss" orders. When the liquidity resulting from these losses is collected, the price often reverses direction.
A "Stop Hunt" is a move designed to neutralize liquidity generated by triggered stop losses. Banks often use significant news events to trigger stop hunts and acquire the liquidity released in the market. If, for example, they intend to execute heavy buy orders, they encourage others to sell through stop hunts.
As a result, if there is liquidity in the market before reaching the order block region, the credibility of that order block is higher. Conversely, if liquidity is near the order block, meaning the price reaches the order block before reaching the liquidity area, the credibility of that order block is lower.
🟣FVG (Fair Value Gap)
To identify the "Fair Value Gap" on the chart, one must analyze candle by candle. Focus on candles with large bodies, examining one candle and the one before it. The candles before and after this central candle should have long shadows, and their bodies should not overlap with the body of the central candle. The distance between the shadows of the first and third candles is called the FVG range.
These zone function in two ways :
•Supply and Demand zone: In this case, the price reacts to these zone, and its trend reverses.
•Liquidity zone: In this scenario, the price "fills" the zone and then reaches the order block.
Important Note: In most cases, FVG zone with very small width act as supply and demand zone, while zone with a significant width act as liquidity zone, absorbing the price.
🔵 Setting
🟣Order Block
Refine Order Block : When the option for refining order blocks is Off, the supply and demand zones encompass the entire length of the order block (from Low to High) in their standard state and remain unaltered. On the option for refining order blocks triggers the improvement of supply and demand zones using the error correction algorithm.
Refine Type : The enhancement of order blocks via the error correction algorithm can be executed through two methods: Defensive and Aggressive. In the Aggressive approach, the widest possible range is taken into account for order blocks.
Show High Levels : If major high levels are to be displayed, set the option for showing high level to Yes.
Show Low Levels : If major low levels are to be displayed, set the option for showing low level to Yes.
Show Last Support : If showing the last support is desired, set the option for showing last support to Yes.
Show Last Resistance : If showing the last resistance is desired, set the option for showing last resistance to Yes.
🟣 FVG
FVG Filter : When FVG filtering is activated, the number of FVG areas undergoes filtration based on the specified algorithm.
FVG Filter Types :
1. Very Aggressive : Apart from the initial condition, an additional condition is introduced. For an upward FVG, the maximum price of the last candle should exceed the maximum price of the middle candle. Similarly, for a downward FVG, the minimum price of the last candle should be lower than the minimum price of the middle candle. This mode eliminates a minimal number of FVGs.
2. Aggressive : In addition to the conditions of the Very Aggressive mode, this mode considers the size of the middle candle; it should not be small. Consequently, a larger number of FVGs are eliminated in this mode.
3. Defensive : Alongside the conditions of the Very Aggressive mode, this mode takes into account the size of the middle candle, which should be relatively large with the majority of it comprising the body. Furthermore, to identify upward FVGs, the second and third candles must be positive, whereas for downward FVGs, the second and third candles must be negative. This mode filters out a considerable number of FVGs, retaining only those of suitable quality.
4. Very Defensive : In addition to the conditions of the Defensive mode, the first and third candles should not be very small-bodied doji candles. This mode filters out the majority of FVGs, leaving only the highest quality ones. Show Demand FVG: Enables the display of demand-related boxes, which can be toggled between off and on. Show Supply FVG: Enables the display of supply-related boxes along the path, which can also be toggled between off and on.
🟣 Liquidity
Statics Liquidity Line Sensitivity : A value ranging from 0 to 0.4. Increasing this value reduces the sensitivity of the "Statics Liquidity Line Detection" function and increases the number of identified lines. The default value is 0.3.
Dynamics Liquidity Line Sensitivity : A value ranging from 0.4 to 1.95. Increasing this value enhances the sensitivity of the "Dynamics Liquidity Line Detection" function and decreases the number of identified lines. The default value is 1.
Statics Period Pivot : Default value is set to 8. By adjusting this value, you can specify the period for static liquidity line pivots.
Dynamics Period Pivot : Default value is set to 3. By adjusting this value, you can specify the period for dynamic liquidity line pivots.
You can activate or deactivate liquidity lines as necessary using the buttons labeled "Show Statics High Liquidity Line," "Show Statics Low Liquidity Line," "Show Dynamics High Liquidity Line," and "Show Dynamics Low Liquidity Line".

Double AI Super Trend Trading - Strategy [PresentTrading]█ Introduction and How It is Different
The Double AI Super Trend Trading Strategy is a cutting-edge approach that leverages the power of not one, but two AI algorithms, in tandem with the SuperTrend technical indicator. The strategy aims to provide traders with enhanced precision in market entry and exit points. It is designed to adapt to market conditions dynamically, offering the flexibility to trade in both bullish and bearish markets.
*The KNN part is mainly referred from @Zeiierman.
BTCUSD 8hr performance
ETHUSD 8hr performance
█ Strategy, How It Works: Detailed Explanation
1. SuperTrend Calculation
The SuperTrend is a popular indicator that captures market trends through a combination of the Volume-Weighted Moving Average (VWMA) and the Average True Range (ATR). This strategy utilizes two sets of SuperTrend calculations with varying lengths and factors to capture both short-term and long-term market trends.
2. KNN Algorithm
The strategy employs k-Nearest Neighbors (KNN) algorithms, which are supervised machine learning models. Two sets of KNN algorithms are used, each focused on different lengths of historical data and number of neighbors. The KNN algorithms classify the current SuperTrend data point as bullish or bearish based on the weighted sum of the labels of the k closest historical data points.
3. Signal Generation
Based on the KNN classifications and the SuperTrend indicator, the strategy generates signals for the start of a new trend and the continuation of an existing trend.
4. Trading Logic
The strategy uses these signals to enter long or short positions. It also incorporates dynamic trailing stops for exit conditions.
Local picture
█ Trade Direction
The strategy allows traders to specify their trading direction: long, short, or both. This enables the strategy to be versatile and adapt to various market conditions.
█ Usage
ToolTips: Comprehensive tooltips are provided for each parameter to guide the user through the customization process.
Inputs: Traders can customize numerous parameters including the number of neighbors in KNN, ATR multiplier, and types of moving averages.
Plotting: The strategy also provides visual cues on the chart to indicate bullish or bearish trends.
Order Execution: Based on the generated signals, the strategy will execute buy or sell orders automatically.
█ Default Settings
The default settings are configured to offer a balanced approach suitable for most scenarios:
Initial Capital: $10,000
Default Quantity Type: 10% of equity
Commission: 0.1%
Slippage: 1
Currency: USD
These settings can be modified to suit various trading styles and asset classes.

Fibonacci Structure & Trend Channel (Expo)█ Overview
The Fibonacci Structure & Trend Channel (Expo) is designed to identify trend direction and potential reversal levels and offer insights into price structure based on Fibonacci ratios. The algorithm plots a Fibonacci channel, making it easier for traders to identify potential retracement points. Additionally, the Fibonacci market structure is plotted to enhance traders' understanding of the underlying order flow.
█ How to Use
Identify Trends
Use the plotted Fibonacci Trend Line to identify the direction of the market trend. A green line typically signifies a bullish trend, while a red line signifies a bearish trend.
Retracement Levels
The plotted Fibonacci levels can act as potential support or resistance levels. Look for price action signs at these levels for entry or exit points.
Channel Trading
If you enable the Fibonacci channel, the upper and lower bounds can act as overbought or oversold levels.
Market Structure
The plotted Fibonacci market structure serves as a valuable tool for dissecting the underlying order flow and gauging the strength or weakness of a trend. By analyzing these structures, traders can identify key levels where supply and demand intersect, which often act as pivotal points for trend reversals or accelerations. This visual representation simplifies complex market dynamics. Whether you're looking to catch a new trend early or seeking confirmation for a potential reversal, understanding the market structure plotted by the Fibonacci ratios can provide actionable insights for various trading strategies.
Use the Table
The information table can provide quick insights into the current trend and when it started.
█ Settings
The Fibonacci settings allow traders to specify the Fibonacci retracement levels that will be used to calculate the trend and its channel.
The Fibonacci Structure Trend Channel structure settings enable traders to fine-tune how the indicator identifies and plots the underlying price structure.
-----------------
Disclaimer
The information contained in my Scripts/Indicators/Ideas/Algos/Systems does not constitute financial advice or a solicitation to buy or sell any securities of any type. I will not accept liability for any loss or damage, including without limitation any loss of profit, which may arise directly or indirectly from the use of or reliance on such information.
All investments involve risk, and the past performance of a security, industry, sector, market, financial product, trading strategy, backtest, or individual's trading does not guarantee future results or returns. Investors are fully responsible for any investment decisions they make. Such decisions should be based solely on an evaluation of their financial circumstances, investment objectives, risk tolerance, and liquidity needs.
My Scripts/Indicators/Ideas/Algos/Systems are only for educational purposes!
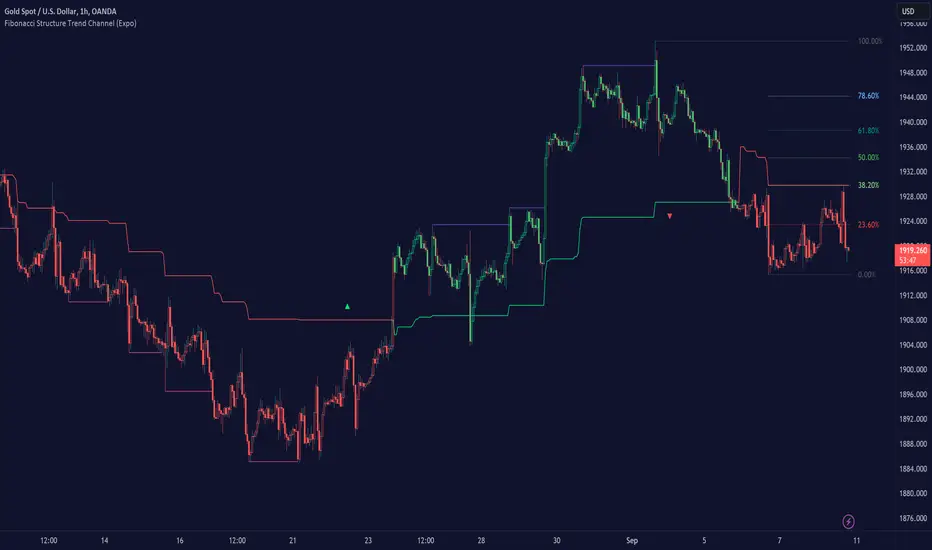
Grid by Volatility (Expo)█ Overview
The Grid by Volatility is designed to provide a dynamic grid overlay on your price chart. This grid is calculated based on the volatility and adjusts in real-time as market conditions change. The indicator uses Standard Deviation to determine volatility and is useful for traders looking to understand price volatility patterns, determine potential support and resistance levels, or validate other trading signals.
█ How It Works
The indicator initiates its computations by assessing the market volatility through an established statistical model: the Standard Deviation. Following the volatility determination, the algorithm calculates a central equilibrium line—commonly referred to as the "mid-line"—on the chart to serve as a baseline for additional computations. Subsequently, upper and lower grid lines are algorithmically generated and plotted equidistantly from the central mid-line, with the distance being dictated by the previously calculated volatility metrics.
█ How to Use
Trend Analysis: The grid can be used to analyze the underlying trend of the asset. For example, if the price is above the Average Line and moves toward the Upper Range, it indicates a strong bullish trend.
Support and Resistance: The grid lines can act as dynamic support and resistance levels. Price tends to bounce off these levels or breakthrough, providing potential trade opportunities.
Volatility Gauge: The distance between the grid lines serves as a measure of market volatility. Wider lines indicate higher volatility, while narrower lines suggest low volatility.
█ Settings
Volatility Length: Number of bars to calculate the Standard Deviation (Default: 200)
Squeeze Adjustment: Multiplier for the Standard Deviation (Default: 6)
Grid Confirmation Length: Number of bars to calculate the weighted moving average for smoothing the grid lines (Default: 2)
-----------------
Disclaimer
The information contained in my Scripts/Indicators/Ideas/Algos/Systems does not constitute financial advice or a solicitation to buy or sell any securities of any type. I will not accept liability for any loss or damage, including without limitation any loss of profit, which may arise directly or indirectly from the use of or reliance on such information.
All investments involve risk, and the past performance of a security, industry, sector, market, financial product, trading strategy, backtest, or individual's trading does not guarantee future results or returns. Investors are fully responsible for any investment decisions they make. Such decisions should be based solely on an evaluation of their financial circumstances, investment objectives, risk tolerance, and liquidity needs.
My Scripts/Indicators/Ideas/Algos/Systems are only for educational purposes!

Filtered Volume Profile [ChartPrime]The "Filtered Volume Profile" is a powerful tool that offers insights into market activity. It's a technical analysis tool used to understand the behavior of financial markets. It uses a fixed range volume profile to provide a histogram representing how much volume occurred at distinct price levels.
Profile in action with various significant levels displayed
How to Use
The script is designed to analyze cumulative trading volumes in different price bins over a certain period, also known as `'lookback'`. This lookback period can be defined by the user and it represents the number of bars to look back for calculating levels of support and resistance.
The `'Smoothing'` input determines the degree to which the output is smoothed. Higher values lead to smoother results but may impede the responsiveness of the indicator to rapid changes in volatility.
The `'Peak Sensitivity'` input is used to adjust the sensitivity of the script's peak detection algorithm. Setting this to a lower value makes the algorithm more sensitive to local changes in trading volume and may result in "noisier" outputs.
The `'Peak Threshold'` input specifies the number of bins that the peak detection mechanism should account for. Larger numbers imply that more volume bins are taken into account, and the resultant peaks are based on wider intervals.
The `'Mean Score Length'` input is used for scaling the mean score range. This is particularly important in defining the length of lookback bars that will be used to calculate the average close price.
Sinc Filter
The application of the sinc-filter to the Filtered Volume Profile reduces the risk of viewing artefacts that may misrepresent the underlying market behavior. Sinc filtering is a high-quality and sharp filter that doesn't manifest any ringing effects, making it an optimal choice for such volume profiling.
Histogram
On the histogram, the volume profile is colored based on the balance of bullish to bearish volume. If a particular bar is more intense in color, it represents a larger than usual volume during a single price bar. This is a clear signal of a strong buying or selling pressure at a particular price level.
Threshold for Peaks
The `peak_thresh` input determines the number of bins the algorithm takes in account for the peak detection feature. The 'peak' represents the level where a significant amount of volume trading has occurred, and usually is of interest as an indicative of support or resistance level.
By increasing the `peak_thresh`, you're raising the bar for what the algorithm perceives as a peak. This could result in fewer, but more significant peaks being identified.
History of Volume Profiles and Evolution into Sinc Filtering
Volume profiling has a rich history in market analysis, dating back to the 1950s when Richard D. Wyckoff, a legendary trader, introduced the concept of volume studies. He understood the critical significance of volume and its relationship with market price movement. The core of Wyckoff's technical analysis suite was the relationship between prices and volume, often termed as "Effort vs Results".
Moving forward, in the early 1800s, the esteemed mathematician J. R. Carson made key improvements to the sinc function, which formed the basis for sinc filtering application in time series data. Following these contributions, trading studies continued to create and integrate more advanced statistical measures into market analysis.
This culminated in the 1980s with J. Peter Steidlmayer’s introduction of Market Profile. He suggested that markets were a function of continuous two-way auction processes thus introducing the concept of viewing markets in price/time continuum and price distribution forms. Steidlmayer's Market Profile was the first wide-scale operation of organized volume and price data.
However, despite the introduction of such features, challenges in the analysis persisted, especially due to noise that could misinform trading decisions. This gap has given rise to the need for smoothing functions to help eliminate the noise and better interpret the data. Among such techniques, the sinc filter has become widely recognized within the trading community.
The sinc filter, because of its properties of constructing a smooth passing through all data points precisely and its ability to eliminate high-frequency noise, has been considered a natural transition in the evolution of volume profile strategies. The superior ability of the sinc filter to reduce noise and shield against over-fitting makes it an ideal choice for smoothing purposes in trading scripts, particularly where volume profiling forms the crux of the market analysis strategy, such as in Filtered Volume Profile.
Moving ahead, the use of volume-based studies seems likely to remain a core part of technical analysis. As long as markets operate based on supply and demand principles, understanding volume will remain key to discerning the intent behind price movements. And with the incorporation of advanced methods like sinc filtering, the accuracy and insight provided by these methodologies will only improve.
Mean Score
The mean score in the Filtered Volume Profile script plays an important role in probabilistic inferences regarding future price direction. This score essentially characterizes the statistical likelihood of price trends based on historical data.
The mean score is calculated over a configurable `'Mean Score Length'`. This variable sets the window or the timeframe for calculation of the mean score of the closing prices.
Statistically, this score takes advantage of the concept of z-scores and probabilities associated with the t-distribution (a type of probability distribution that is symmetric and bell-shaped, just like the standard normal distribution, but has heavier tails).
The z-score represents how many standard deviations an element is from the mean. In this case, the "element" is the price level (Point of Control).
The mean score section of the script calculates standard errors for the root mean squared error (RMSE) and addresses the uncertainty in the prediction of the future value of a random variable.
The RMSE of a model prediction concerning observed values is used to measure the differences between values predicted by a model and the values observed.
The lower the RMSE, the better the model is able to predict. A zero RMSE means a perfect fit to the data. In essence, it's a measure of how concentrated the data is around the line of best fit.
Through the mean score, the script effectively predicts the likelihood of the future close price being above or below our identified price level.
Summary
Filtered Volume Profile is a comprehensive trading view indicator which utilizes volume profiling, peak detection, mean score computations, and sinc-filter smoothing, altogether providing the finer details of market behavior.
It offers a customizable look back period, smoothing options, and peak sensitivity setting along with a uniquely set peak threshold. The application of the Sinc Filter ensures a high level of accuracy and noise reduction in volume profiling, making this script a reliable tool for gaining market insights.
Furthermore, the use of mean score calculations provides probabilistic insights into price movements, thus providing traders with a statistically sound foundation for their trading decisions. As trading markets advance, the use of such methodologies plays a pivotal role in formulating effective trading strategies and the Filtered Volume Profile is a successful embodiment of such advancements in the field of market analysis.

RibboNN Machine Learning [ChartPrime]The RibboNN ML indicator is a powerful tool designed to predict the direction of the market and display it through a ribbon-like visual representation, with colors changing based on the prediction outcome from a conditional class. The primary focus of this indicator is to assist traders in trend following trading strategies.
The RibboNN ML in action
Prediction Process:
Conditional Class: The indicator's predictive model relies on a conditional class, which combines information from both longcon (long condition) and short condition. These conditions are determined using specific rules and criteria, taking into account various market factors and indicators.
Direction Prediction: The conditional class provides the basis for predicting the direction of the market move. When the prediction value is greater than 0, it indicates an upward trend, while a value less than 0 suggests a downward trend.
Nearest Neighbor (NN): To attempt to enhance the accuracy of predictions, the RibboNN ML indicator incorporates a Nearest Neighbor algorithm. This algorithm analyzes historical data from the Ribbon ML's predictive model (RMF) and identifies patterns that closely resemble the current conditional prediction class, thereby offering more robust trend forecasts.
Ribbon Visualization:
The Ribbon ML indicator visually represents its predictions through a ribbon-like display. The ribbon changes colors based on the direction predicted by the conditional class. An upward trend is represented by a green color, while a downward trend is depicted by a red color, allowing traders to quickly identify potential market directions.
The introduction of the Nearest Neighbor algorithm provides the Ribbon ML indicator with unique and adaptive behaviors. By dynamically analyzing historical patterns and incorporating them into predictions, the indicator can adapt to changing market conditions and offer more reliable signals for trend following trading strategies.
Manipulation of the NN Settings:
Smaller Value of Neighbours Count:
When the value of "Neighbours Count" is small, the algorithm considers only a few nearest neighbors for making predictions.
A smaller value of "Neighbours Count" leads to more flexible decision boundaries, which can result in a more granular and sensitive model.
However, using a very small value might lead to overfitting, especially if the training data contains noise or outliers.
Larger Value of "Neighbours Count":
When the value of "Neighbours Count" is large, the algorithm considers a larger number of nearest neighbors for making predictions.
A larger value of "Neighbours Count" leads to smoother decision boundaries and helps capture the global patterns in the data.
However, setting a very large value might result in a loss of local patterns and make the model less sensitive to changes in the data.
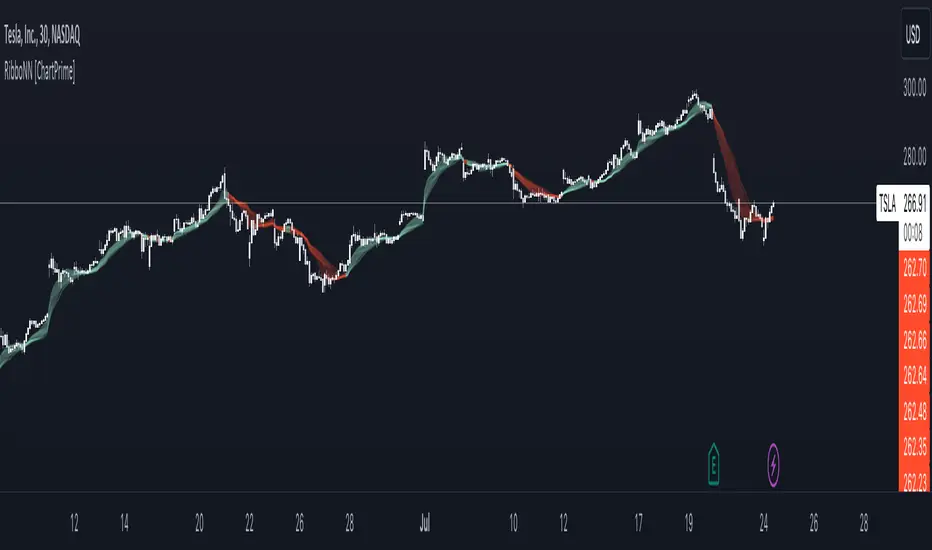
Price & Volume Profile (Expo)█ Overview
The Price & Volume Profile provides a holistic perspective on market dynamics by simultaneously tracking price action and trading volume across a range of price levels. So it is not only a volume-based indicator but also a price-based one. In addition to illustrating volume distribution, it quantifies how frequently the price has fallen within a particular range, thus offering a holistic perspective on market dynamics.
This unique and comprehensive approach to market analysis by considering both price action and trading volume, two crucial dimensions of market activity. Its distinctive methodology offers several advantages:
Holistic Market View: By simultaneously tracking the frequency of specific price ranges (Price Profile) and the volume traded at those ranges (Volume Profile), this indicator provides a more complete picture of market behavior. It shows not only where the market is trading but also how much it's trading, reflecting both price acceptance levels and market participation intensity.
Point of Control (POC): The POC, as highlighted by this indicator, serves as a significant reference point for traders. It identifies the price level with the highest trading activity, thus indicating a strong consensus among market participants about the asset's fair value. Observing how price interacts with the POC can offer valuable insights into market sentiment and potential trend reversals.
Support and Resistance Levels: Price levels with high trading activity often act as support or resistance in future price movements. The indicator visually represents these levels, enabling traders to anticipate potential price reactions.
Price Profile
Price and Volume Profile
█ Calculations
The algorithm analyzes both trade frequency and volume across different price levels. It identifies these levels within the visible chart range, then examines each bar to determine if the selected price falls within these levels. If so, it increases a counter and adds the trading volume. This process repeats across the visible range and is visualized as a horizontal histogram, each bar representing a price level and the bar length reflecting trade frequency and volume. Additionally, it calculates the Point of Control (POC), signifying the price level with the highest activity.
In summary: The histogram presents a dual perspective - not only the traded volume at each price level but also the frequency of the price hitting each range. The longer the bar, the more times the price has frequented that specific range, revealing key insights into price behavior and acceptance levels. These frequently visited areas often emerge as strong support or resistance zones, helping traders navigate market movements.
Please note that the indicator adjusts to the visible price range, making it adaptable to changing market conditions. This dynamic analysis can provide more relevant and timely information than static indicators.
█ How to use
This indicator is beneficial for traders as it offers insights into the distribution of trading activity across different price levels. It helps identify key areas of support and resistance and gives a visual representation of market sentiment and liquidity.
The point of control (POC) , which is the price level with the highest traded volume or frequency count, becomes even more crucial in this context. It marks the price at which the most trading activity occurred, signaling a strong consensus among market participants about the asset's fair value. If the market price deviates significantly from the POC, it could suggest an overbought or oversold condition, potentially leading to a price reversion.
Fair Price Areas/gaps are specific price levels or zones where an asset has spent limited time in the past. These areas are considered interesting or significant because they may have an impact on future price action.
Similar to the concept of fair value gaps, which refers to discrepancies between an asset's market price and its estimated intrinsic value, Fair Price Areas/gaps focus on price levels that have been relatively underutilized in terms of trading activity. When an asset's price reaches a Fair Price Area/gap, traders and investors pay attention because they expect the price to react in some way. The rationale behind this concept is that price tends to gravitate towards areas where it has spent less time in the past, as the market perceives them as significant levels.
█ Settings
The indicator is customizable, allowing users to define the number of price levels (rows), the offset, the data source, and whether to display volume or frequency count. It also adjusts dynamically to the visible price range on the chart, ensuring that the analysis remains relevant and timely with changing market conditions.
Source: The price to use for the calculation. Typically, this is the closing price. By considering the user-selected Source (typically the closing price), the indicator determines the frequency with which the price lands within each designated price level (row) over the selected period. In essence, the indicator provides a count of bars where the Source price falls within each range, essentially creating a "Price Profile."
Row Size: The number of price levels (rows) to divide the visible price range into.
Display: Choose whether to display the number of bars ("Counter") or the total volume ("Volume") for each price level.
Offset: The distance of the histogram from the price chart.
Point of Control (POC): If enabled, the indicator will highlight the price level with the most activity.
-----------------
Disclaimer
The information contained in my Scripts/Indicators/Ideas/Algos/Systems does not constitute financial advice or a solicitation to buy or sell any securities of any type. I will not accept liability for any loss or damage, including without limitation any loss of profit, which may arise directly or indirectly from the use of or reliance on such information.
All investments involve risk, and the past performance of a security, industry, sector, market, financial product, trading strategy, backtest, or individual's trading does not guarantee future results or returns. Investors are fully responsible for any investment decisions they make. Such decisions should be based solely on an evaluation of their financial circumstances, investment objectives, risk tolerance, and liquidity needs.
My Scripts/Indicators/Ideas/Algos/Systems are only for educational purposes!

Volume Orderbook (Expo)█ Overview
The Volume Orderbook indicator is a volume analysis tool that visually resembles an order book. It's used for displaying trading volume data in a way that may be easier to interpret or more intuitive for certain traders, especially those familiar with order book analysis.
This indicator aggregate and display the total trading volume at different price levels over the entire range of data available on the chart, similar to how an order book displays current buy and sell orders at different price levels. However, unlike a real-time order book, it only considers historical trading data, not current bid and ask orders. This provides a 'historical order book' of sorts, indicating where most trading activities have taken place.
Summary
This is a volume-based indicator that shows the volume traded at specific price levels, highlighting areas of high and low activity.
█ Calculations
The algorithm operates by calculating the cumulative volume traded in each specific price zone within the range of data displayed on the chart. The length of each horizontal bar corresponds to the total volume of trades that occurred within that particular price zone.
In essence, when the price is in a specific zone, the volume is added to the bar representing that zone. A thicker bar implies a larger price zone, meaning that more volume is accumulated within that bar. Therefore, the thickness of the bar visually indicates the amount of trading activity that took place within the associated price zone.
█ How to use
The Volume Orderbook indicator serves as a beneficial tool for traders by identifying key price levels with a significant amount of trading activity. These high-volume areas could represent potential support or resistance levels due to the large number of orders situated there. The indicator's ability to spotlight these zones might be particularly advantageous in pinpointing breakouts or breakdowns when prices move beyond these high-volume regions. Moreover, the indicator could also assist traders in recognizing anomalies, such as when an unusually large volume of trades occurs at unconventional price levels.
Identify Key Price Levels: The indicator highlights high-volume areas where a significant number of trades have occurred, which could act as potential support or resistance levels. This is based on the notion that many traders have established positions at these prices, so these levels may serve as significant areas for market activity in the future.
Volume Nodes: These are the peaks (high-volume areas) and troughs (low-volume areas) seen on the indicator. High-volume nodes represent price levels at which a large amount of volume has been traded, typically areas of strong support or resistance. Conversely, low-volume nodes, where very little volume has been traded, indicate price levels that traders have shown little interest in the past and could potentially act as barriers to price. It's important to note that while high trading volume can imply significant market interest, it doesn't always mean the price will stop or reverse at these levels. Sometimes, prices can quickly move through high-volume areas if there are no current orders (demand) to match with the new orders (supply).
Analyze Market Psychology: The distribution of volume across different price levels can provide insights into the market's psychology, revealing the balance of power between buyers and sellers.
Highlight Potential Reversal Points: The indicator can help identify price levels with high traded volume where the market might be more likely to reverse since these levels have previously attracted significant interest from traders.
Validate Breakouts or Breakdowns: If the price moves convincingly past a high-volume node, it could indicate a strong trend, suggesting a potential breakout or breakdown. Conversely, if the price struggles to move past a high-volume node, it could suggest that the trend is weak and might potentially reverse.
Trade Reversals: High-volume areas could also indicate potential turning points in the market. If the price reaches these levels and then starts to move away, it might suggest a possible price reversal.
Confirm Other Signals: As with all technical indicators, the "Volume Orderbook" should ideally be used in conjunction with other forms of technical and fundamental analysis to confirm signals and increase the odds of successful trades.
Summary
The Volume Orderbook indicator allows traders to identify key price levels, analyze market psychology, highlight potential reversal points, validate breakouts or breakdowns, confirm other trading signals, and anticipate possible trade reversals, thereby serving as a robust tool for trading analysis.
█ Settings
Source: The user can select the source, the default of which is "close." This implies that volume is added to the volume order book when the closing price falls within a specific zone. Users can modify this to any indicator present on their chart. For example, if it's set to an SMA (Simple Moving Average) of 20, the volume will be added to the volume order book when the SMA 20 falls within the specific zone.
Rows and width: These settings allow users to adjust the representation of volume order book zones. "ROWS" pertains to the number of volume order book zones displayed, while "WIDTH" refers to the breadth of each zone.
Table and Grid: These settings allow traders to customize the Volume order-book's position and appearance. By adjusting the "left" parameter, users can shift the position of the Volume order book on the chart; a higher value pushes the order book further to the right. Additionally, users can enable "Table Border" and "Table Grid" options to add gridlines or borders to the Volume order book for easier viewing and interpretation.
-----------------
Disclaimer
The information contained in my Scripts/Indicators/Ideas/Algos/Systems does not constitute financial advice or a solicitation to buy or sell any securities of any type. I will not accept liability for any loss or damage, including without limitation any loss of profit, which may arise directly or indirectly from the use of or reliance on such information.
All investments involve risk, and the past performance of a security, industry, sector, market, financial product, trading strategy, backtest, or individual's trading does not guarantee future results or returns. Investors are fully responsible for any investment decisions they make. Such decisions should be based solely on an evaluation of their financial circumstances, investment objectives, risk tolerance, and liquidity needs.
My Scripts/Indicators/Ideas/Algos/Systems are only for educational purposes!

Pattern Forecast (Expo)█ Overview
The Pattern Forecast indicator is a technical analysis tool that scans historical price data to identify common chart patterns and then analyzes the price movements that followed these patterns. It takes this information and projects it into the future to provide traders with potential price actions that may occur if the same pattern is identified in real-time market data. This projection helps traders to understand the possible outcomes based on the previous occurrences of the pattern, thereby offering a clearer perspective of the market scenario. By analyzing the historical data and understanding the subsequent price movements following the appearance of a specific pattern, the indicator can provide valuable insights into potential future market behavior.
█ Calculations
The indicator works by scanning historical price data for various candlestick patterns. It includes all in-built TradingView patterns, credit to TradingView that has coded them.
Essentially, the indicator takes the historical price moves that followed the pattern to forecast what might happen next.
█ Example
In this example, the algorithm is set to search for the Inverted Hammer Bullish candlestick pattern. If the pattern is found, the historical outcome is then projected into the future. This helps traders to understand how the past pattern evolved over time.
█ How to use
Providing traders with a comprehensive understanding of historical patterns and their implications for future price action allows them to assess the likelihood of specific market scenarios objectively. For example, suppose the pattern forecast indicator suggests that a particular pattern is likely to lead to a bullish move in the market. A trader might consider going long if the same pattern is identified in the real-time market. Similarly, a trader might consider shorting the asset if the indicator suggests a bearish move is likely, if the same pattern is identified in the real-time market.
█ Settings
Pattern
Select the pattern that the indicator should scan for. All inbuilt TradingView patterns can be selected.
Forecast Candles
Number of candles to project into the future.
-----------------
Disclaimer
The information contained in my Scripts/Indicators/Ideas/Algos/Systems does not constitute financial advice or a solicitation to buy or sell any securities of any type. I will not accept liability for any loss or damage, including without limitation any loss of profit, which may arise directly or indirectly from the use of or reliance on such information.
All investments involve risk, and the past performance of a security, industry, sector, market, financial product, trading strategy, backtest, or individual's trading does not guarantee future results or returns. Investors are fully responsible for any investment decisions they make. Such decisions should be based solely on an evaluation of their financial circumstances, investment objectives, risk tolerance, and liquidity needs.
My Scripts/Indicators/Ideas/Algos/Systems are only for educational purposes!

Quinn-Fernandes Fourier Transform of Filtered Price [Loxx]Down the Rabbit Hole We Go: A Deep Dive into the Mysteries of Quinn-Fernandes Fast Fourier Transform and Hodrick-Prescott Filtering
In the ever-evolving landscape of financial markets, the ability to accurately identify and exploit underlying market patterns is of paramount importance. As market participants continuously search for innovative tools to gain an edge in their trading and investment strategies, advanced mathematical techniques, such as the Quinn-Fernandes Fourier Transform and the Hodrick-Prescott Filter, have emerged as powerful analytical tools. This comprehensive analysis aims to delve into the rich history and theoretical foundations of these techniques, exploring their applications in financial time series analysis, particularly in the context of a sophisticated trading indicator. Furthermore, we will critically assess the limitations and challenges associated with these transformative tools, while offering practical insights and recommendations for overcoming these hurdles to maximize their potential in the financial domain.
Our investigation will begin with a comprehensive examination of the origins and development of both the Quinn-Fernandes Fourier Transform and the Hodrick-Prescott Filter. We will trace their roots from classical Fourier analysis and time series smoothing to their modern-day adaptive iterations. We will elucidate the key concepts and mathematical underpinnings of these techniques and demonstrate how they are synergistically used in the context of the trading indicator under study.
As we progress, we will carefully consider the potential drawbacks and challenges associated with using the Quinn-Fernandes Fourier Transform and the Hodrick-Prescott Filter as integral components of a trading indicator. By providing a critical evaluation of their computational complexity, sensitivity to input parameters, assumptions about data stationarity, performance in noisy environments, and their nature as lagging indicators, we aim to offer a balanced and comprehensive understanding of these powerful analytical tools.
In conclusion, this in-depth analysis of the Quinn-Fernandes Fourier Transform and the Hodrick-Prescott Filter aims to provide a solid foundation for financial market participants seeking to harness the potential of these advanced techniques in their trading and investment strategies. By shedding light on their history, applications, and limitations, we hope to equip traders and investors with the knowledge and insights necessary to make informed decisions and, ultimately, achieve greater success in the highly competitive world of finance.
█ Fourier Transform and Hodrick-Prescott Filter in Financial Time Series Analysis
Financial time series analysis plays a crucial role in making informed decisions about investments and trading strategies. Among the various methods used in this domain, the Fourier Transform and the Hodrick-Prescott (HP) Filter have emerged as powerful techniques for processing and analyzing financial data. This section aims to provide a comprehensive understanding of these two methodologies, their significance in financial time series analysis, and their combined application to enhance trading strategies.
█ The Quinn-Fernandes Fourier Transform: History, Applications, and Use in Financial Time Series Analysis
The Quinn-Fernandes Fourier Transform is an advanced spectral estimation technique developed by John J. Quinn and Mauricio A. Fernandes in the early 1990s. It builds upon the classical Fourier Transform by introducing an adaptive approach that improves the identification of dominant frequencies in noisy signals. This section will explore the history of the Quinn-Fernandes Fourier Transform, its applications in various domains, and its specific use in financial time series analysis.
History of the Quinn-Fernandes Fourier Transform
The Quinn-Fernandes Fourier Transform was introduced in a 1993 paper titled "The Application of Adaptive Estimation to the Interpolation of Missing Values in Noisy Signals." In this paper, Quinn and Fernandes developed an adaptive spectral estimation algorithm to address the limitations of the classical Fourier Transform when analyzing noisy signals.
The classical Fourier Transform is a powerful mathematical tool that decomposes a function or a time series into a sum of sinusoids, making it easier to identify underlying patterns and trends. However, its performance can be negatively impacted by noise and missing data points, leading to inaccurate frequency identification.
Quinn and Fernandes sought to address these issues by developing an adaptive algorithm that could more accurately identify the dominant frequencies in a noisy signal, even when data points were missing. This adaptive algorithm, now known as the Quinn-Fernandes Fourier Transform, employs an iterative approach to refine the frequency estimates, ultimately resulting in improved spectral estimation.
Applications of the Quinn-Fernandes Fourier Transform
The Quinn-Fernandes Fourier Transform has found applications in various fields, including signal processing, telecommunications, geophysics, and biomedical engineering. Its ability to accurately identify dominant frequencies in noisy signals makes it a valuable tool for analyzing and interpreting data in these domains.
For example, in telecommunications, the Quinn-Fernandes Fourier Transform can be used to analyze the performance of communication systems and identify interference patterns. In geophysics, it can help detect and analyze seismic signals and vibrations, leading to improved understanding of geological processes. In biomedical engineering, the technique can be employed to analyze physiological signals, such as electrocardiograms, leading to more accurate diagnoses and better patient care.
Use of the Quinn-Fernandes Fourier Transform in Financial Time Series Analysis
In financial time series analysis, the Quinn-Fernandes Fourier Transform can be a powerful tool for isolating the dominant cycles and frequencies in asset price data. By more accurately identifying these critical cycles, traders can better understand the underlying dynamics of financial markets and develop more effective trading strategies.
The Quinn-Fernandes Fourier Transform is used in conjunction with the Hodrick-Prescott Filter, a technique that separates the underlying trend from the cyclical component in a time series. By first applying the Hodrick-Prescott Filter to the financial data, short-term fluctuations and noise are removed, resulting in a smoothed representation of the underlying trend. This smoothed data is then subjected to the Quinn-Fernandes Fourier Transform, allowing for more accurate identification of the dominant cycles and frequencies in the asset price data.
By employing the Quinn-Fernandes Fourier Transform in this manner, traders can gain a deeper understanding of the underlying dynamics of financial time series and develop more effective trading strategies. The enhanced knowledge of market cycles and frequencies can lead to improved risk management and ultimately, better investment performance.
The Quinn-Fernandes Fourier Transform is an advanced spectral estimation technique that has proven valuable in various domains, including financial time series analysis. Its adaptive approach to frequency identification addresses the limitations of the classical Fourier Transform when analyzing noisy signals, leading to more accurate and reliable analysis. By employing the Quinn-Fernandes Fourier Transform in financial time series analysis, traders can gain a deeper understanding of the underlying financial instrument.
Drawbacks to the Quinn-Fernandes algorithm
While the Quinn-Fernandes Fourier Transform is an effective tool for identifying dominant cycles and frequencies in financial time series, it is not without its drawbacks. Some of the limitations and challenges associated with this indicator include:
1. Computational complexity: The adaptive nature of the Quinn-Fernandes Fourier Transform requires iterative calculations, which can lead to increased computational complexity. This can be particularly challenging when analyzing large datasets or when the indicator is used in real-time trading environments.
2. Sensitivity to input parameters: The performance of the Quinn-Fernandes Fourier Transform is dependent on the choice of input parameters, such as the number of harmonic periods, frequency tolerance, and Hodrick-Prescott filter settings. Choosing inappropriate parameter values can lead to inaccurate frequency identification or reduced performance. Finding the optimal parameter settings can be challenging, and may require trial and error or a more sophisticated optimization process.
3. Assumption of stationary data: The Quinn-Fernandes Fourier Transform assumes that the underlying data is stationary, meaning that its statistical properties do not change over time. However, financial time series data is often non-stationary, with changing trends and volatility. This can limit the effectiveness of the indicator and may require additional preprocessing steps, such as detrending or differencing, to ensure the data meets the assumptions of the algorithm.
4. Limitations in noisy environments: Although the Quinn-Fernandes Fourier Transform is designed to handle noisy signals, its performance may still be negatively impacted by significant noise levels. In such cases, the identification of dominant frequencies may become less reliable, leading to suboptimal trading signals or strategies.
5. Lagging indicator: As with many technical analysis tools, the Quinn-Fernandes Fourier Transform is a lagging indicator, meaning that it is based on past data. While it can provide valuable insights into historical market dynamics, its ability to predict future price movements may be limited. This can result in false signals or late entries and exits, potentially reducing the effectiveness of trading strategies based on this indicator.
Despite these drawbacks, the Quinn-Fernandes Fourier Transform remains a valuable tool for financial time series analysis when used appropriately. By being aware of its limitations and adjusting input parameters or preprocessing steps as needed, traders can still benefit from its ability to identify dominant cycles and frequencies in financial data, and use this information to inform their trading strategies.
█ Deep-dive into the Hodrick-Prescott Fitler
The Hodrick-Prescott (HP) filter is a statistical tool used in economics and finance to separate a time series into two components: a trend component and a cyclical component. It is a powerful tool for identifying long-term trends in economic and financial data and is widely used by economists, central banks, and financial institutions around the world.
The HP filter was first introduced in the 1990s by economists Robert Hodrick and Edward Prescott. It is a simple, two-parameter filter that separates a time series into a trend component and a cyclical component. The trend component represents the long-term behavior of the data, while the cyclical component captures the shorter-term fluctuations around the trend.
The HP filter works by minimizing the following objective function:
Minimize: (Sum of Squared Deviations) + λ (Sum of Squared Second Differences)
Where:
1. The first term represents the deviation of the data from the trend.
2. The second term represents the smoothness of the trend.
3. λ is a smoothing parameter that determines the degree of smoothness of the trend.
The smoothing parameter λ is typically set to a value between 100 and 1600, depending on the frequency of the data. Higher values of λ lead to a smoother trend, while lower values lead to a more volatile trend.
The HP filter has several advantages over other smoothing techniques. It is a non-parametric method, meaning that it does not make any assumptions about the underlying distribution of the data. It also allows for easy comparison of trends across different time series and can be used with data of any frequency.
Another significant advantage of the HP Filter is its ability to adapt to changes in the underlying trend. This feature makes it particularly well-suited for analyzing financial time series, which often exhibit non-stationary behavior. By employing the HP Filter to smooth financial data, traders can more accurately identify and analyze the long-term trends that drive asset prices, ultimately leading to better-informed investment decisions.
However, the HP filter also has some limitations. It assumes that the trend is a smooth function, which may not be the case in some situations. It can also be sensitive to changes in the smoothing parameter λ, which may result in different trends for the same data. Additionally, the filter may produce unrealistic trends for very short time series.
Despite these limitations, the HP filter remains a valuable tool for analyzing economic and financial data. It is widely used by central banks and financial institutions to monitor long-term trends in the economy, and it can be used to identify turning points in the business cycle. The filter can also be used to analyze asset prices, exchange rates, and other financial variables.
The Hodrick-Prescott filter is a powerful tool for analyzing economic and financial data. It separates a time series into a trend component and a cyclical component, allowing for easy identification of long-term trends and turning points in the business cycle. While it has some limitations, it remains a valuable tool for economists, central banks, and financial institutions around the world.
█ Combined Application of Fourier Transform and Hodrick-Prescott Filter
The integration of the Fourier Transform and the Hodrick-Prescott Filter in financial time series analysis can offer several benefits. By first applying the HP Filter to the financial data, traders can remove short-term fluctuations and noise, effectively isolating the underlying trend. This smoothed data can then be subjected to the Fourier Transform, allowing for the identification of dominant cycles and frequencies with greater precision.
By combining these two powerful techniques, traders can gain a more comprehensive understanding of the underlying dynamics of financial time series. This enhanced knowledge can lead to the development of more effective trading strategies, better risk management, and ultimately, improved investment performance.
The Fourier Transform and the Hodrick-Prescott Filter are powerful tools for financial time series analysis. Each technique offers unique benefits, with the Fourier Transform being adept at identifying dominant cycles and frequencies, and the HP Filter excelling at isolating long-term trends from short-term noise. By combining these methodologies, traders can develop a deeper understanding of the underlying dynamics of financial time series, leading to more informed investment decisions and improved trading strategies. As the financial markets continue to evolve, the combined application of these techniques will undoubtedly remain an essential aspect of modern financial analysis.
█ Features
Endpointed and Non-repainting
This is an endpointed and non-repainting indicator. These are crucial factors that contribute to its usefulness and reliability in trading and investment strategies. Let us break down these concepts and discuss why they matter in the context of a financial indicator.
1. Endpoint nature: An endpoint indicator uses the most recent data points to calculate its values, ensuring that the output is timely and reflective of the current market conditions. This is in contrast to non-endpoint indicators, which may use earlier data points in their calculations, potentially leading to less timely or less relevant results. By utilizing the most recent data available, the endpoint nature of this indicator ensures that it remains up-to-date and relevant, providing traders and investors with valuable and actionable insights into the market dynamics.
2. Non-repainting characteristic: A non-repainting indicator is one that does not change its values or signals after they have been generated. This means that once a signal or a value has been plotted on the chart, it will remain there, and future data will not affect it. This is crucial for traders and investors, as it offers a sense of consistency and certainty when making decisions based on the indicator's output.
Repainting indicators, on the other hand, can change their values or signals as new data comes in, effectively "repainting" the past. This can be problematic for several reasons:
a. Misleading results: Repainting indicators can create the illusion of a highly accurate or successful trading system when backtesting, as the indicator may adapt its past signals to fit the historical price data. This can lead to overly optimistic performance results that may not hold up in real-time trading.
b. Decision-making uncertainty: When an indicator repaints, it becomes challenging for traders and investors to trust its signals, as the signal that prompted a trade may change or disappear after the fact. This can create confusion and indecision, making it difficult to execute a consistent trading strategy.
The endpoint and non-repainting characteristics of this indicator contribute to its overall reliability and effectiveness as a tool for trading and investment decision-making. By providing timely and consistent information, this indicator helps traders and investors make well-informed decisions that are less likely to be influenced by misleading or shifting data.
Inputs
Source: This input determines the source of the price data to be used for the calculations. Users can select from options like closing price, opening price, high, low, etc., based on their preferences. Changing the source of the price data (e.g., from closing price to opening price) will alter the base data used for calculations, which may lead to different patterns and cycles being identified.
Calculation Bars: This input represents the number of past bars used for the calculation. A higher value will use more historical data for the analysis, while a lower value will focus on more recent price data. Increasing the number of past bars used for calculation will incorporate more historical data into the analysis. This may lead to a more comprehensive understanding of long-term trends but could also result in a slower response to recent price changes. Decreasing this value will focus more on recent data, potentially making the indicator more responsive to short-term fluctuations.
Harmonic Period: This input represents the harmonic period, which is the number of harmonics used in the Fourier Transform. A higher value will result in more harmonics being used, potentially capturing more complex cycles in the price data. Increasing the harmonic period will include more harmonics in the Fourier Transform, potentially capturing more complex cycles in the price data. However, this may also introduce more noise and make it harder to identify clear patterns. Decreasing this value will focus on simpler cycles and may make the analysis clearer, but it might miss out on more complex patterns.
Frequency Tolerance: This input represents the frequency tolerance, which determines how close the frequencies of the harmonics must be to be considered part of the same cycle. A higher value will allow for more variation between harmonics, while a lower value will require the frequencies to be more similar. Increasing the frequency tolerance will allow for more variation between harmonics, potentially capturing a broader range of cycles. However, this may also introduce noise and make it more difficult to identify clear patterns. Decreasing this value will require the frequencies to be more similar, potentially making the analysis clearer, but it might miss out on some cycles.
Number of Bars to Render: This input determines the number of bars to render on the chart. A higher value will result in more historical data being displayed, but it may also slow down the computation due to the increased amount of data being processed. Increasing the number of bars to render on the chart will display more historical data, providing a broader context for the analysis. However, this may also slow down the computation due to the increased amount of data being processed. Decreasing this value will speed up the computation, but it will provide less historical context for the analysis.
Smoothing Mode: This input allows the user to choose between two smoothing modes for the source price data: no smoothing or Hodrick-Prescott (HP) smoothing. The choice depends on the user's preference for how the price data should be processed before the Fourier Transform is applied. Choosing between no smoothing and Hodrick-Prescott (HP) smoothing will affect the preprocessing of the price data. Using HP smoothing will remove some of the short-term fluctuations from the data, potentially making the analysis clearer and more focused on longer-term trends. Not using smoothing will retain the original price fluctuations, which may provide more detail but also introduce noise into the analysis.
Hodrick-Prescott Filter Period: This input represents the Hodrick-Prescott filter period, which is used if the user chooses to apply HP smoothing to the price data. A higher value will result in a smoother curve, while a lower value will retain more of the original price fluctuations. Increasing the Hodrick-Prescott filter period will result in a smoother curve for the price data, emphasizing longer-term trends and minimizing short-term fluctuations. Decreasing this value will retain more of the original price fluctuations, potentially providing more detail but also introducing noise into the analysis.
Alets and signals
This indicator featues alerts, signals and bar coloring. You have to option to turn these on/off in the settings menu.
Maximum Bars Restriction
This indicator requires a large amount of processing power to render on the chart. To reduce overhead, the setting "Number of Bars to Render" is set to 500 bars. You can adjust this to you liking.
█ Related Indicators and Libraries
Goertzel Cycle Composite Wave
Goertzel Browser
Fourier Spectrometer of Price w/ Extrapolation Forecast
Fourier Extrapolator of 'Caterpillar' SSA of Price
Normalized, Variety, Fast Fourier Transform Explorer
Real-Fast Fourier Transform of Price Oscillator
Real-Fast Fourier Transform of Price w/ Linear Regression
Fourier Extrapolation of Variety Moving Averages
Fourier Extrapolator of Variety RSI w/ Bollinger Bands
Fourier Extrapolator of Price w/ Projection Forecast
Fourier Extrapolator of Price
STD-Stepped Fast Cosine Transform Moving Average
Variety RSI of Fast Discrete Cosine Transform
loxfft

Smoothing R-Squared ComparisonIntroduction
Heyo guys, here I made a comparison between my favorised smoothing algorithms.
I chose the R-Squared value as rating factor to accomplish the comparison.
The indicator is non-repainting.
Description
In technical analysis, traders often use moving averages to smooth out the noise in price data and identify trends. While moving averages are a useful tool, they can also obscure important information about the underlying relationship between the price and the smoothed price.
One way to evaluate this relationship is by calculating the R-squared value, which represents the proportion of the variance in the price that can be explained by the smoothed price in a linear regression model.
This PineScript code implements a smoothing R-squared comparison indicator.
It provides a comparison of different smoothing techniques such as Kalman filter, T3, JMA, EMA, SMA, Super Smoother and some special combinations of them.
The Kalman filter is a mathematical algorithm that uses a series of measurements observed over time, containing statistical noise and other inaccuracies, and produces estimates of unknown variables that tend to be more accurate than those based on a single measurement.
The input parameters for the Kalman filter include the process noise covariance and the measurement noise covariance, which help to adjust the sensitivity of the filter to changes in the input data.
The T3 smoothing technique is a popular method used in technical analysis to remove noise from a signal.
The input parameters for the T3 smoothing method include the length of the window used for smoothing, the type of smoothing used (Normal or New), and the smoothing factor used to adjust the sensitivity to changes in the input data.
The JMA smoothing technique is another popular method used in technical analysis to remove noise from a signal.
The input parameters for the JMA smoothing method include the length of the window used for smoothing, the phase used to shift the input data before applying the smoothing algorithm, and the power used to adjust the sensitivity of the JMA to changes in the input data.
The EMA and SMA techniques are also popular methods used in technical analysis to remove noise from a signal.
The input parameters for the EMA and SMA techniques include the length of the window used for smoothing.
The indicator displays a comparison of the R-squared values for each smoothing technique, which provides an indication of how well the technique is fitting the data.
Higher R-squared values indicate a better fit. By adjusting the input parameters for each smoothing technique, the user can compare the effectiveness of different techniques in removing noise from the input data.
Usage
You can use it to find the best fitting smoothing method for the timeframe you usually use.
Just apply it on your preferred timeframe and look for the highlighted table cell.
Conclusion
It seems like the T3 works best on timeframes under 4H.
There's where I am active, so I will use this one more in the future.
Thank you for checking this out. Enjoy your day and leave me a like or comment. 🧙♂️
---
Credits to:
▪@loxx – T3
▪@balipour – Super Smoother
▪ChatGPT – Wrote 80 % of this article and helped with the research
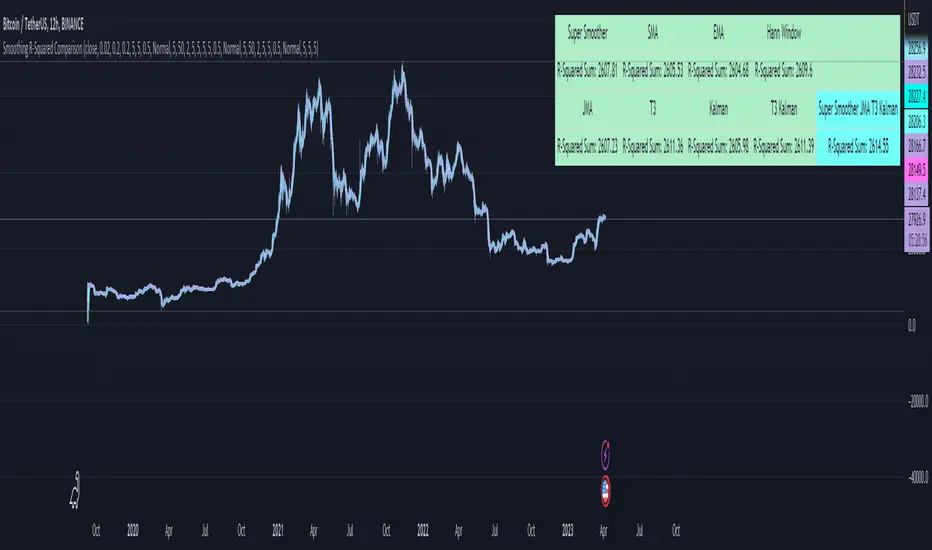
Spectral Gating (SG)The Spectral Gating (SG) Indicator is a technical analysis tool inspired by music production techniques. It aims to help traders reduce noise in their charts by focusing on the significant frequency components of the data, providing a clearer view of market trends.
By incorporating complex number operations and Fast Fourier Transform (FFT) algorithms, the SG Indicator efficiently processes market data. The indicator transforms input data into the frequency domain and applies a threshold to the power spectrum, filtering out noise and retaining only the frequency components that exceed the threshold.
Key aspects of the Spectral Gating Indicator include:
Adjustable Window Size: Customize the window size (ranging from 2 to 6) to control the amount of data considered during the analysis, giving you the flexibility to adapt the indicator to your trading strategy.
Complex Number Arithmetic: The indicator uses complex number addition, subtraction, and multiplication, as well as radius calculations for accurate data processing.
Iterative FFT and IFFT: The SG Indicator features iterative FFT and Inverse Fast Fourier Transform (IFFT) algorithms for rapid data analysis. The FFT algorithm converts input data into the frequency domain, while the IFFT algorithm restores the filtered data back to the time domain.
Spectral Gating: At the heart of the indicator, the spectral gating function applies a threshold to the power spectrum, suppressing frequency components below the threshold. This process helps to enhance the clarity of the data by reducing noise and focusing on the more significant frequency components.
Visualization: The indicator plots the filtered data on the chart with a simple blue line, providing a clean and easily interpretable representation of the results.
Although the Spectral Gating Indicator may not be a one-size-fits-all solution for all trading scenarios, it serves as a valuable tool for traders looking to reduce noise and concentrate on relevant market trends. By incorporating this indicator into your analysis toolkit, you can potentially make more informed trading decisions.
PSv5 3D Array/Matrix Super Hack"In a world of ever pervasive and universal deceit, telling a simple truth is considered a revolutionary act."
INTRO:
First, how about a little bit of philosophic poetry with another dimension applied to it?
The "matrix of control" is everywhere...
It is all around us, even now in the very place you reside. You can see it when you look at your digitized window outwards into the world, or when you turn on regularly scheduled television "programs" to watch news narratives and movies that subliminally influence your thoughts, feelings, and emotions. You have felt it every time you have clocked into dead end job workplaces... when you unknowingly worshiped on the conformancy alter to cultish ideologies... and when you pay your taxes to a godvernment that is poisoning you softly and quietly by injecting your mind and body with (psyOps + toxicCompounds). It is a fictitiously generated world view that has been pulled over your eyes to blindfold, censor, and mentally prostrate you from spiritually hearing the real truth.
What TRUTH you must wonder? That you are cognitively enslaved, like everyone else. You were born into mental bondage, born into an illusory societal prison complex that you are entirely incapable of smelling, tasting, or touching. Its a contrived monetary prison enterprise for your mind and eternal soul, built by pretending politicians, corporate CONartists, and NonGoverning parasitic Organizations deploying any means of infiltration and deception by using every tactic unimaginable. You are slowly being convinced into becoming a genetically altered cyborg by acclimation, socially engineered and chipped to eventually no longer be 100% human.
Unfortunately no one can be told eloquently enough in words what the matrix of control truly is. You have to experience it and witness it for yourself. This is your chance to program a future paradigm that doesn't yet exist. After visiting here, there is absolutely no turning back. You can continually take the blue pill BIGpharmacide wants you to repeatedly intake. The story ends if you continually sleep walk through a 2D hologram life, believing whatever you wish to believe until you cease to exist. OR, you can take the red pill challenge, explore "question every single thing" wonderland, program your arse off with 3D capabilities, ultimately ascertaining a new mathematical empyrean. Only then can you fully awaken to discover how deep the rabbit hole state of affairs transpire worldwide with a genuine open mind.
Remember, all I'm offering is a mathematical truth, nothing more...
PURPOSE:
With that being said above, it is now time for advanced developers to start creating their own matrix constructs in 3D, in Pine, just as the universe is created spatially. For those of you who instantly know what this script's potential is easily capable of, you already know what you have to do with it. While this is simplistically just a 3D array for either integers or floats, additional companion functions can in the future be constructed by other members to provide a more complete matrix/array library for millions of folks on TV. I do encourage the most courageous of mathemagicians on TV to do so. I have been employing very large 2D/3D array structures for quite some time, and their utility seems to be of great benefit. Discovering that for myself, I fully realized that Pine is incomplete and must be provided with this agility to process complex datasets that traders WILL use in the future. Mark my words!
CONCEPTION:
While I have long realized and theorized this code for a great duration of time, I was finally able to turn it into a Pine reality with the assistance and training of an "artificially intuitive" program while probing its aptitude. Even though it knows virtually nothing about Pine Script 4.0 or 5.0 syntax, functions, and behavior, I was able to conjure code into an identity similar to what you see now within a few minutes. Close enough for me! Many manual edits later for pine compliance, and I had it in chart, presto!
While most people consider the service to be an "AI", it didn't pass my Pine Turing test. I did have to repeatedly correct it, suffered through numerous apologies from it, was forced to use specifically tailored words, and also rationally debate AND argued with it. It is a handy helper but beware of generating Pine code from it, trust me on this one. However... this artificially intuitive service is currently available in its infancy as version 3. Version 4 most likely will have more diversity to enhance my algorithmic expertise of Pine wizardry. I do have to thank E.M. and his developers for an eye opening experience, or NONE of this code below would be available as you now witness it today.
LIMITATIONS:
As of this initial release, Pine only supports 100,000 array elements maximum. For example, when using this code, a 50x50x40 element configuration will exceed this limit, but 50x50x39 will work. You will always have to keep that in mind during development. Running that size of an array structure on every single bar will most likely time out within 20-40 seconds. This is not the most efficient method compared to a real native 3D array in action. Ehlers adepts, this might not be 100% of what you require to "move forward". You can try, but head room with a low ceiling currently will be challenging to walk in for now, even with extremely optimized Pine code.
A few common functions are provided, but this can be extended extensively later if you choose to undertake that endeavor. Use the code as is and/or however you deem necessary. Any TV member is granted absolute freedom to do what they wish as they please. I ultimately wish to eventually see a fully equipped library version for both matrix3D AND array3D created by collaborative efforts that will probably require many Pine poets testing collectively. This is just a bare bones prototype until that day arrives. Considerably more computational server power will be required also. Anyways, I hope you shall find this code somewhat useful.
Notice: Unfortunately, I will not provide any integration support into members projects at all. I have my own projects that require too much of my time already.
POTENTIAL APPLICATIONS:
The creation of very large coefficient 3D caches/buffers specifically at bar_index==0 can dramatically increase runtime agility for thousands of bars onwards. Generating 1000s of values once and just accessing those generated values is much faster. Also, when running dozens of algorithms simultaneously, a record of performance statistics can be kept, self-analyzed, and visually presented to the developer/user. And, everything else under the sun can be created beyond a developers wildest dreams...
EPILOGUE:
Free your mind!!! And unleash weapons of mass financial creation upon the earth for all to utilize via the "Power of Pine". Flying monkeys and minions are waging economic sabotage upon humanity, decimating markets and exchanges. You can always see it your market charts when things go horribly wrong. This is going to be an astronomical technical challenge to continually navigate very choppy financial markets that are increasingly becoming more and more unstable and volatile. Ordinary one plot algorithms simply are not enough anymore. Statistics and analysis sits above everything imagined. This includes banking, godvernment, corporations, REAL science, technology, health, medicine, transportation, energy, food, etc... We have a unique perspective of the world that most people will never get to see, depending on where you look. With an ever increasingly complex world in constant dynamic flux, novel ways to process data intricately MUST emerge into existence in order to tackle phenomenal tasks required in the future. Achieving data analysis in 3D forms is just one lonely step of many more to come.
At this time the WesternEconomicFraudsters and the WorldHealthOrders are attempting to destroy/reset the world's financial status in order to rain in chaos upon most nations, causing asset devaluation and hyper-inflation. Every form of deception, infiltration, and theft is occurring with a result of destroyed wealth in preparation to consolidate it. Open discussions, available to the public, by world leaders/moguls are fantasizing about new dystopian system as a one size fits all nations solution of digitalID combined with programmableDemonicCurrencies to usher in a new form of obedient servitude to a unipolar digitized hegemony of monetary vampires. If they do succeed with economic conquest, as they have publicly stated, people will be converted into human cattle, herded within smart cities, you will own nothing, eat bugs for breakfast/lunch/dinner, live without heat during severe winter conditions, and be happy. They clearly haven't done the math, as they are far outnumbered by a ratio of 1 to millions. Sith Lords do not own planet Earth! The new world disorder of human exploitation will FAIL. History, my "greatest teacher" for decades reminds us over, and over, and over again, and what are time series for anyways? They are for an intense mathematical analysis of prior historical values/conditions in relation to today's values/conditions... I imagine one day we will be able to ask an all-seeing AI, "WHO IS TO BLAME AND WHY AND WHEN?" comprised of 300 pages in great detail with images, charts, and statistics.
What are the true costs of malignant lies? I will tell you... 64bit numbers are NOT even capable of calculating the extreme cost of pernicious lies and deceit. That's how gigantic this monstrous globalization problem has become and how awful the "matrix of control" truly is now. ALL nations need a monumental revision of its CODE OF ETHICS, and that's definitely a multi-dimensional problem that needs solved sooner than later. If it was up to me, economies and technology would be developed so extensively to eliminate scarcity and increase the standard of living so high, that the notion of war and conflict would be considered irrelevant and extremely appalling to the future generations of humanity, our grandchildren born and unborn. The future will not be owned and operated by geriatric robber barons destined to expire quickly. The future will most likely be intensely "guided" by intelligent open source algorithms that youthful generations will inherit as their birth right.
P.S. Don't give me that politco-my-diction crap speech below in comments. If they weren't meddling with economics mucking up 100% of our chart results in 100% of tickers, I wouldn't have any cause to analyze any effects generated by them, nor provide this script's code. I am performing my analytical homework, but have you? Do you you know WHY international affairs are in dire jeopardy? Without why, the "Power of Pine" would have never existed as it specifically does today. I'm giving away much of my mental power generously to TV members so you are specifically empowered beyond most mathematical agilities commonly existing. I'm just a messenger of profound ideas. Loving and loathing of words is ALWAYS in the eye of beholders, and that's why the freedom of speech is enshrined as #1 in the constitutional code of the USA. Without it, this entire site might not have been allowed to exist from its founder's inceptions.
Fourier Extrapolator of 'Caterpillar' SSA of Price [Loxx]Fourier Extrapolator of 'Caterpillar' SSA of Price is a forecasting indicator that applies Singular Spectrum Analysis to input price and then injects that transformed value into the Quinn-Fernandes Fourier Transform algorithm to generate a price forecast. The indicator plots two curves: the green/red curve indicates modeled past values and the yellow/fuchsia dotted curve indicates the future extrapolated values.
What is the Fourier Transform Extrapolator of price?
Fourier Extrapolator of Price is a multi-harmonic (or multi-tone) trigonometric model of a price series xi, i=1..n, is given by:
xi = m + Sum( a*Cos(w*i) + b*Sin(w*i), h=1..H )
Where:
xi - past price at i-th bar, total n past prices;
m - bias;
a and b - scaling coefficients of harmonics;
w - frequency of a harmonic ;
h - harmonic number;
H - total number of fitted harmonics.
Fitting this model means finding m, a, b, and w that make the modeled values to be close to real values. Finding the harmonic frequencies w is the most difficult part of fitting a trigonometric model. In the case of a Fourier series, these frequencies are set at 2*pi*h/n. But, the Fourier series extrapolation means simply repeating the n past prices into the future.
Quinn-Fernandes algorithm find sthe harmonic frequencies. It fits harmonics of the trigonometric series one by one until the specified total number of harmonics H is reached. After fitting a new harmonic , the coded algorithm computes the residue between the updated model and the real values and fits a new harmonic to the residue.
see here: A Fast Efficient Technique for the Estimation of Frequency , B. G. Quinn and J. M. Fernandes, Biometrika, Vol. 78, No. 3 (Sep., 1991), pp . 489-497 (9 pages) Published By: Oxford University Press
Fourier Transform Extrapolator of Price inputs are as follows:
npast - number of past bars, to which trigonometric series is fitted;
nharm - total number of harmonics in model;
frqtol - tolerance of frequency calculations.
What is Singular Spectrum Analysis ( SSA )?
Singular spectrum analysis ( SSA ) is a technique of time series analysis and forecasting. It combines elements of classical time series analysis, multivariate statistics, multivariate geometry, dynamical systems and signal processing. SSA aims at decomposing the original series into a sum of a small number of interpretable components such as a slowly varying trend, oscillatory components and a ‘structureless’ noise. It is based on the singular value decomposition ( SVD ) of a specific matrix constructed upon the time series. Neither a parametric model nor stationarity-type conditions have to be assumed for the time series. This makes SSA a model-free method and hence enables SSA to have a very wide range of applicability.
For our purposes here, we are only concerned with the "Caterpillar" SSA . This methodology was developed in the former Soviet Union independently (the ‘iron curtain effect’) of the mainstream SSA . The main difference between the main-stream SSA and the "Caterpillar" SSA is not in the algorithmic details but rather in the assumptions and in the emphasis in the study of SSA properties. To apply the mainstream SSA , one often needs to assume some kind of stationarity of the time series and think in terms of the "signal plus noise" model (where the noise is often assumed to be ‘red’). In the "Caterpillar" SSA , the main methodological stress is on separability (of one component of the series from another one) and neither the assumption of stationarity nor the model in the form "signal plus noise" are required.
"Caterpillar" SSA
The basic "Caterpillar" SSA algorithm for analyzing one-dimensional time series consists of:
Transformation of the one-dimensional time series to the trajectory matrix by means of a delay procedure (this gives the name to the whole technique);
Singular Value Decomposition of the trajectory matrix;
Reconstruction of the original time series based on a number of selected eigenvectors.
This decomposition initializes forecasting procedures for both the original time series and its components. The method can be naturally extended to multidimensional time series and to image processing.
The method is a powerful and useful tool of time series analysis in meteorology, hydrology, geophysics, climatology and, according to our experience, in economics, biology, physics, medicine and other sciences; that is, where short and long, one-dimensional and multidimensional, stationary and non-stationary, almost deterministic and noisy time series are to be analyzed.
"Caterpillar" SSA inputs are as follows:
lag - How much lag to introduce into the SSA algorithm, the higher this number the slower the process and smoother the signal
ncomp - Number of Computations or cycles of of the SSA algorithm; the higher the slower
ssapernorm - SSA Period Normalization
numbars =- number of past bars, to which SSA is fitted
Included:
Bar coloring
Alerts
Signals
Loxx's Expanded Source Types
Related Fourier Transform Indicators
Real-Fast Fourier Transform of Price w/ Linear Regression
Fourier Extrapolator of Variety RSI w/ Bollinger Bands
Fourier Extrapolator of Price w/ Projection Forecast
Related Projection Forecast Indicators
Itakura-Saito Autoregressive Extrapolation of Price
Helme-Nikias Weighted Burg AR-SE Extra. of Price
Related SSA Indicators
End-pointed SSA of FDASMA
End-pointed SSA of Williams %R
Levinson-Durbin Autocorrelation Extrapolation of Price [Loxx]Levinson-Durbin Autocorrelation Extrapolation of Price is an indicator that uses the Levinson recursion or Levinson–Durbin recursion algorithm to predict price moves. This method is commonly used in speech modeling and prediction engines.
What is Levinson recursion or Levinson–Durbin recursion?
Is a linear algebra prediction analysis that is performed once per bar using the autocorrelation method with a within a specified asymmetric window. The autocorrelation coefficients of the window are computed and converted to LP coefficients using the Levinson algorithm. The LP coefficients are then transformed to line spectrum pairs for quantization and interpolation. The interpolated quantized and unquantized filters are converted back to the LP filter coefficients to construct the synthesis and weighting filters for each bar.
Data inputs
Source Settings: -Loxx's Expanded Source Types. You typically use "open" since open has already closed on the current active bar
LastBar - bar where to start the prediction
PastBars - how many bars back to model
LPOrder - order of linear prediction model; 0 to 1
FutBars - how many bars you want to forward predict
Things to know
Normally, a simple moving average is caculated on source data. I've expanded this to 38 different averaging methods using Loxx's Moving Avreages.
This indicator repaints
Included
Bar color muting
Further reading
Implementing the Levinson-Durbin Algorithm on the StarCore™ SC140/SC1400 Cores
LevinsonDurbin_G729 Algorithm, Calculates LP coefficients from the autocorrelation coefficients. Intel® Integrated Performance Primitives for Intel® Architecture Reference Manual
