Breach v3 BetaThis is a script that allows you to toggle multiple indicators related to support and resistance, CCI, and Breaches (Crossovers based on William's Fractals).
How to use:
Custom Timeframe (Minutes) - To compare to current candles
Crossovers on custom - Crossovers and breaches on custom timeframe (Blue Triangle up)
Crossunders on custom - Crossunders and breaches on custom timeframe (Blue Triangle down)
Crossovers on current candles - Crossovers and breaches on current timeframe/Candlestick (Purple Triangle up)
Crossunder on current candles - Crossunders and breaches on current timeframe/Candlestick (Purple Triangle down)
CCI - CCI Trend indicator (red/green dots)
CCI - window - Input CCI window size in candlesticks (Integer)
Resistance on current candles - Resistance on current candles (Green Line)
Support on current candles - Support on current candles (Red Line)
Resistance - Custom - Resistance line based on Custom Timeframe (Blue Line)
Support - Custom - Support line based on Custom Timeframe (Purple Line)
Price on current support/resistance - Label displaying the price of current (candlestick) support/resistance
Price on custom support/resistance - Label displaying the price of custom (Custom Timeframe) support/resistance
Wyszukaj w skryptach "CCI"

[blackcat] L2 Ehlers Adaptive Commodity Channel IndexLevel: 2
Background
John F. Ehlers introucedAdaptive Commodity Channel Index in his "Rocket Science for Traders" chapter 21 on 2001.
Function
The Commodity Channel Index (CCI) computes the average of the median price of each bar over the observation period. It also computes the Mean Deviation (MD) from this average. The CCI is formed as the current deviation from the average price normalized to the MD. With a Gaussian probability distribution, 68 percent of all possible outcomes are contained within the first standard deviation from the mean. The CCI is scaled so that values above +l00 are above the upper first
standard deviation from the mean and values below -100 are below the lower first standard deviation from the mean. Multiplying the MD in the code by 0.015 implements this normalization. Many traders use this indicator as an overbought/oversold indicator with 100 or greater indicating that the market is overbought, and -100 or less that the market is oversold. Since the trading channel is being formed by the indicator, the obvious observation period is the same as the cycle length. Since the complete cycle period may not be the universal answer, Dr. Ehlers includes a CycPart input as a modifier. This input allows you to optimize the observation period for each particular situation.
Key Signal
CCI ---> Adaptive Commodity Channel Index fast line
CCI ---> Adaptive Commodity Channel Index slow line
Pros and Cons
100% John F. Ehlers definition translation of original work, even variable names are the same. This help readers who would like to use pine to read his book. If you had read his works, then you will be quite familiar with my code style.
Remarks
The 20th script for Blackcat1402 John F. Ehlers Week publication.
Readme
In real life, I am a prolific inventor. I have successfully applied for more than 60 international and regional patents in the past 12 years. But in the past two years or so, I have tried to transfer my creativity to the development of trading strategies. Tradingview is the ideal platform for me. I am selecting and contributing some of the hundreds of scripts to publish in Tradingview community. Welcome everyone to interact with me to discuss these interesting pine scripts.
The scripts posted are categorized into 5 levels according to my efforts or manhours put into these works.
Level 1 : interesting script snippets or distinctive improvement from classic indicators or strategy. Level 1 scripts can usually appear in more complex indicators as a function module or element.
Level 2 : composite indicator/strategy. By selecting or combining several independent or dependent functions or sub indicators in proper way, the composite script exhibits a resonance phenomenon which can filter out noise or fake trading signal to enhance trading confidence level.
Level 3 : comprehensive indicator/strategy. They are simple trading systems based on my strategies. They are commonly containing several or all of entry signal, close signal, stop loss, take profit, re-entry, risk management, and position sizing techniques. Even some interesting fundamental and mass psychological aspects are incorporated.
Level 4 : script snippets or functions that do not disclose source code. Interesting element that can reveal market laws and work as raw material for indicators and strategies. If you find Level 1~2 scripts are helpful, Level 4 is a private version that took me far more efforts to develop.
Level 5 : indicator/strategy that do not disclose source code. private version of Level 3 script with my accumulated script processing skills or a large number of custom functions. I had a private function library built in past two years. Level 5 scripts use many of them to achieve private trading strategy.
Kal's MTF OBV Haar Version 3Kal’s Multi-Time-Frame On-Balance-Volume Haar, also known as Kal’s MTF OBV Haar is a method/study for finding trending volume levels on stocks, indexes and cryptocurrencies using OBV, CMF and CCI over different time-frames (10Min, 1H, 4H, 1D, 1W, 1Month).
Upon adding to the 10Min chart, the sample Image in Tradingview looks as follows:
Note: Always check your time-frame(TF). Compare current TF to a row’s(bead row’s) time-frame. Ensure current TF is lower than a row’s time-frame when looking at it and higher time-frame rows above it. For instance, if you choose your chart’s time-frame at 1D, the lower time-frame rows(i.e. 10Min, 1H, 4H) don’t make sense.
For cryptocurrencies, one week is 7 periods, two weeks is 14 periods
For stocks, one week is 5 periods, two weeks is 10 periods
For the study of stocks, I used
9-period EMA over OBV for time-frames (10Min, 1H, 4H, D)
4-period EMA over OBV for time-frames (W, M)
For the study of cryptocurrencies, I would update EMAs as follows:
13-period EMA over OBV for time-frames (10Min, 1H, 4H, D)
6-period EMA over OBV for time-frames (W, M)
These days I'm finding the following parameters have better fitting
19-period EMA over OBV for time-frames (10Min, 1H, 4H, D)
9-period EMA over OBV for time-frames (W, M)
Description:
---------------
In the study plot, the lowest row is 10Min, the row above 10Min is 1H, then 4H, then 1D, then 1W and the highest row is 1M
Note: Always check your time-frame(TF). Compare current TF to a row’s(bead row’s) time-frame. Ensure current TF is lower than a row’s time-frame when looking at it and higher time-frame rows above it. For instance, if you choose your chart’s time-frame at 1D, the lower time-frame rows(i.e. 10Min, 1H, 4H) don’t make sense.
Lime( Bright Green) dot implies Trending Uptrend for that time-frame
Red dot implies Trending Downward for that time-frame
It’s best to wait and research for possibility of Trend Reversal during the following dots/bricks:
Silver dot implies indecisive up
Orange dot implies indecisive downtrend
Lime Brick implies CCI is near Zero line( between 15 and 0)
Red Brick implies CCI is near Zero line( between -15 and 0)
Purple dot implies CCI zero rejection to possibly/probably continue trend UP
Yellow dot implies CCI zero rejection to possibly/probably continue trend Down
Aqua dot implies that trend is overbought or oversold. This dot usually happens between red dots or green dots. Therefore, it’s best to wait for pull-back especially in lower time frames.
Safe Trading!
Kal Gandikota
Legal Disclaimer: This script is published here so I get replies from fellow viewers to educate myself. Hence, if anyone uses this script for making their financial decisions, I am not responsible for any failures incurred. If you have questions or improvements related to this script, please feel free to leave comments and as time permits, will respond to those comments.

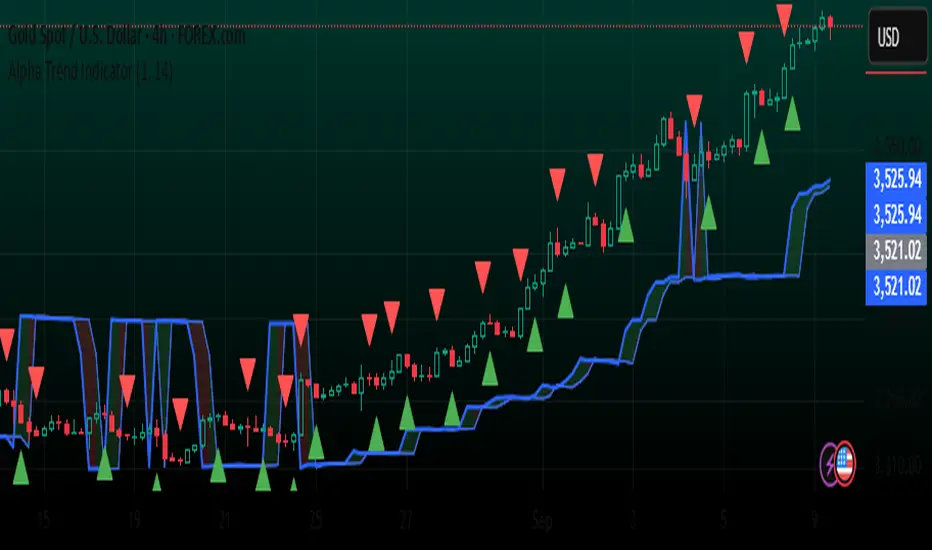
Alpha Trend IndicatorThe Alpha Trend Indicator is a custom-built trend-following tool designed to help traders identify market direction, trend strength, and potential reversal points with high accuracy. It combines multiple technical concepts—ATR (Average True Range), CCI (Commodity Channel Index), and either MFI (Money Flow Index) or RSI (Relative Strength Index)—to create a dynamic trend detection system.
🔑 Key Features:
Adaptive Trend Line – Uses ATR and CCI logic (similar to Trend Magic) to plot an Alpha Trend line that adjusts to volatility.
MFI / RSI Flexibility – Option to switch between MFI (volume-based momentum) or RSI (price-based momentum) for more tailored analysis.
Alpha Trend Offset – Plots a 2-bar shifted reference line to detect changes in price momentum.
Buy & Sell Signals – Automatically detects bullish and bearish crossovers between Alpha Trend and its offset line, marking potential entries and exits.
Visual Trend Zones – Fills the space between Alpha Trend and its offset with green (bullish) or red (bearish) highlights, making trend direction easy to see at a glance.
Alerts – Built-in alert conditions for Buy and Sell signals so traders never miss an opportunity.
📊 How It Works:
Trend Detection –
When CCI > 0, the Alpha Trend line is set below recent lows minus volatility (ATR).
When CCI < 0, it shifts above recent highs plus volatility.
Momentum Confirmation –
MFI/RSI adds an extra confirmation layer to avoid false signals.
Trading Signals –
Buy Signal: When Alpha Trend crosses above its offset line.
Sell Signal: When Alpha Trend crosses below its offset line.
⚡ Best Use:
Works on all timeframes (scalping, swing trading, long-term analysis).
Suitable for Forex, Crypto, Stocks, and Commodities.
Can be combined with support/resistance or volume analysis for even stronger setups.
PCV (Darren.L-V2)Description:
This indicator combines Bollinger Bands, CCI, and RVI to help identify high-probability zones on M15 charts.
Features:
Bollinger Bands (BB) – displayed on the main chart in light gray. Helps visualize overbought and oversold price levels.
CCI ±100 levels + RVI – displayed in a separate sub-window:
CCI only shows the ±100 reference lines.
RVI displays a cyan main line and a red signal line.
Valid Zone Detection:
Candle closes outside the Bollinger Bands.
RVI crosses above +100 or below -100 (CCI level reference).
Candle closes back inside the BB, confirming a price rebound.
Requires two touches in the same direction to confirm the zone.
Only zones within 20–30 pips range are considered valid.
Usage:
Helps traders spot reversal or bounce zones with clear visual signals.
Suitable for all indices, Forex, and crypto on M15 timeframe.

Adaptive Valuation [BackQuant]Adaptive Valuation
What this is
A composite, zero-centered oscillator that standardizes several classic indicators and blends them into one “valuation” line. It computes RSI, CCI, Demarker, and the Price Zone Oscillator, converts each to a rolling z-score, then forms a weighted average. Optional smoothing, dynamic overbought and oversold bands, and an on-chart table make the inputs and the final score easy to inspect.
How it works
Components
• RSI with its own lookback.
• CCI with its own lookback.
• DM (Demarker) with its own lookback.
• PZO (Price Zone Oscillator) with its own lookback.
Standardization via z-score
Each component is transformed using a rolling z-score over lookback bars:
z = (value − mean) ÷ stdev , where the mean is an EMA and the stdev is rolling.
This puts all inputs on a comparable scale measured in standard deviations.
Weighted blend
The z-scores are combined with user weights w_rsi, w_cci, w_dm, w_pzo to produce a single valuation series. If desired, it is then smoothed with a selected moving average (SMA, EMA, WMA, HMA, RMA, DEMA, TEMA, LINREG, ALMA, T3). ALMA’s sigma input shapes its curve.
Dynamic thresholds (optional)
Two ways to set overbought and oversold:
• Static : fixed levels at ob_thres and os_thres .
• Dynamic : ±k·σ bands, where σ is the rolling standard deviation of the valuation over dynLen .
Bands can be centered at zero or around the valuation’s rolling mean ( centerZero ).
Visualization and UI
• Zero line at 0 with gradient fill that darkens as the valuation moves away from 0.
• Optional plotting of band lines and background highlights when OB or OS is active.
• Optional candle and background coloring driven by the valuation.
• Summary table showing each component’s current z-score, the final score, and a compact status.
How it can be used
• Bias filter : treat crosses above 0 as bullish bias and below 0 as bearish bias.
• Mean-reversion context : look for exhaustion when the valuation enters the OB or OS region, then watch for exits from those regions or a return toward 0.
• Signal confirmation : use the final score to confirm setups from structure or price action.
• Adaptive banding : with dynamic thresholds, OB and OS adjust to prevailing variability rather than relying on fixed lines.
• Component tuning : change weights to emphasize trend (raise DM, reduce RSI/CCI) or range behavior (raise RSI/CCI, reduce DM). PZO can help in swing environments.
Why z-score blending helps
Indicators often live on different scales. Z-scoring places them on a common, unitless axis, so a one-sigma move in RSI has comparable influence to a one-sigma move in CCI. This reduces scale bias and allows transparent weighting. It also facilitates regime-aware thresholds because the dynamic bands scale with recent dispersion.
Inputs to know
• Component lookbacks : rsilb, ccilb, dmlb, pzolb control each raw signal.
• Standardization window : lookback sets the z-score memory. Longer smooths, shorter reacts.
• Weights : w_rsi, w_cci, w_dm, w_pzo determine each component’s influence.
• Smoothing : maType, smoothP, sig govern optional post-blend smoothing.
• Dynamic bands : dyn_thres, dynLen, thres_k, centerZero configure the adaptive OB/OS logic.
• UI : toggle the plot, table, candle coloring, and threshold lines.
Reading the plot
• Above 0 : composite pressure is positive.
• Below 0 : composite pressure is negative.
• OB region : valuation above the chosen OB line. Risk of mean reversion rises and momentum continuation needs evidence.
• OS region : mirror logic on the downside.
• Band exits : leaving OB or OS can serve as a normalization cue.
Strengths
• Normalizes heterogeneous signals into one interpretable series.
• Adjustable component weights to match instrument behavior.
• Dynamic thresholds adapt to changing volatility and drift.
• Transparent diagnostics from the on-chart table.
• Flexible smoothing choices, including ALMA and T3.
Limitations and cautions
• Z-scores assume a reasonably stationary window. Sharp regime shifts can make recent bands unrepresentative.
• Highly correlated components can overweight the same effect. Consider adjusting weights to avoid double counting.
• More smoothing adds lag. Less smoothing adds noise.
• Dynamic bands recalibrate with dynLen ; if set too short, bands may swing excessively. If too long, bands can be slow to adapt.
Practical tuning tips
• Trending symbols: increase w_dm , use a modest smoother like EMA or T3, and use centerZero dynamic bands.
• Choppy symbols: increase w_rsi and w_cci , consider ALMA with a higher sigma , and widen bands with a larger thres_k .
• Multiday swing charts: lengthen lookback and dynLen to stabilize the scale.
• Lower timeframes: shorten component lookbacks slightly and reduce smoothing to keep signals timely.
Alerts
• Enter and exit of Overbought and Oversold, based on the active band choice.
• Bullish and bearish zero crosses.
Use alerts as prompts to review context rather than as stand-alone trade commands.
Final Remarks
We created this to show people a different way of making indicators & trading.
You can process normal indicators in multiple ways to enhance or change the signal, especially with this you can utilise machine learning to optimise the weights, then trade accordingly.
All of the different components were selected to give some sort of signal, its made out of simple components yet is effective. As long as the user calibrates it to their Trading/ investing style you can find good results. Do not use anything standalone, ensure you are backtesting and creating a proper system.

GMMG CCM SYSTEM HALMACCI INDICATOR BY KUYA NICKOOVERVIEW:
This script is about HALMACCI strategy based on Coach Miranda Miner System (CMM Systems of GMMG). It's an indicator to help traders decide when to enter and exit. This indicator uses Bollinger Band, EMA and ALMA with the length settings used by GMMG.
USAGE:
Apply the indicator to any chart. Best use in lower timeframes (Ex: 5m and 1m). You may use custom length settings but I suggest to stick with the default settings if you are using CMM System.
To enter LONG, If the CCI cross over -100 (shows a green dot when dot is enabled in style) and the EMA cross above ALMA (shows a green cross when cross is enabled in style). You may enter long. Strong confluence when it happens above the Bollinger Band and the candle closed above the Bollinger Band. You may exit when the CCI cross under -100 or immediate resistance.
To enter SHORT, If the CCI cross under 100 (shows a red dot when dot is enabled in style) and the EMA cross above ALMA (shows a red cross when cross is enabled in style). You may enter short. Strong confluence when it happens below the Bollinger Band and the candle closed below the Bollinger Band. You may exit when the CCI cross over 100 or immediate support.
Use may use alerts to catch breakout events so you would not need to monitor the chart continuously

SCTI-RSKSCTI-RSK 是一个多功能技术指标合集,整合了多种常用技术指标于一个图表中,方便交易者综合分析市场状况。该指标包含以下五个主要技术指标模块,每个模块都可以单独显示或隐藏:
Stoch RSI - 随机相对强弱指数
KDJ - 随机指标
RSI - 相对强弱指数
CCI - 商品通道指数
Williams %R - 威廉指标
主要特点
模块化设计:每个指标都可以单独开启或关闭显示
交叉信号可视化:Stoch RSI和KDJ的金叉/死叉信号有彩色填充标识
多时间框架分析:支持不同长度的参数设置
直观界面:清晰的参数分组和颜色区分
适用场景
趋势判断
超买超卖区域识别
交易信号确认
多指标共振分析
English Description
SCTI-RSK is a comprehensive technical indicator that combines multiple popular indicators into a single chart for traders to analyze market conditions holistically. The indicator includes the following five main technical indicator modules, each can be toggled on/off individually:
Stoch RSI - Stochastic Relative Strength Index
KDJ - Stochastic Oscillator
RSI - Relative Strength Index
CCI - Commodity Channel Index
Williams %R - Williams Percent Range
Key Features
Modular Design: Each indicator can be shown or hidden independently
Visual Crossover Signals: Golden/Death crosses are highlighted with color fills for Stoch RSI and KDJ
Multi-Timeframe Analysis: Supports different length parameters
Intuitive Interface: Clear parameter grouping and color differentiation
Use Cases
Trend identification
Overbought/Oversold zone recognition
Trade signal confirmation
Multi-indicator confluence analysis
参数说明 (Parameter Explanation)
指标参数分为6个主要组别:
基础指标设置 - 控制各指标的显示/隐藏
Stoch RSI 设置 - 包括K值、D值、RSI长度等参数
KDJ 设置 - 包括周期、信号线等参数
RSI 设置 - 包括RSI长度、中期长度等参数
CCI 设置 - 包括CCI长度、中期长度等参数
Williams %R 设置 - 包括长度参数
使用建议 (Usage Suggestions)
初次使用时,可以先开启所有指标观察它们的相互关系
根据个人交易风格调整各指标的长度参数
关注多指标同时发出信号时的交易机会
结合价格行为和其他分析工具确认信号
更新日志 (Changelog)
v1.0 初始版本,整合五大技术指标
Categorical Market Morphisms (CMM)Categorical Market Morphisms (CMM) - Where Abstract Algebra Transcends Reality
A Revolutionary Application of Category Theory and Homotopy Type Theory to Financial Markets
Bridging Pure Mathematics and Market Analysis Through Functorial Dynamics
Theoretical Foundation: The Mathematical Revolution
Traditional technical analysis operates on Euclidean geometry and classical statistics. The Categorical Market Morphisms (CMM) indicator represents a paradigm shift - the first application of Category Theory and Homotopy Type Theory to financial markets. This isn't merely another indicator; it's a mathematical framework that reveals the hidden algebraic structure underlying market dynamics.
Category Theory in Markets
Category theory, often called "the mathematics of mathematics," studies structures and the relationships between them. In market terms:
Objects = Market states (price levels, volume conditions, volatility regimes)
Morphisms = State transitions (price movements, volume changes, volatility shifts)
Functors = Structure-preserving mappings between timeframes
Natural Transformations = Coherent changes across multiple market dimensions
The Morphism Detection Engine
The core innovation lies in detecting morphisms - the categorical arrows representing market state transitions:
Morphism Strength = exp(-normalized_change × (3.0 / sensitivity))
Threshold = 0.3 - (sensitivity - 1.0) × 0.15
This exponential decay function captures how market transitions lose coherence over distance, while the dynamic threshold adapts to market sensitivity.
Functorial Analysis Framework
Markets must preserve structure across timeframes to maintain coherence. Our functorial analysis verifies this through composition laws:
Composition Error = |f(BC) × f(AB) - f(AC)| / |f(AC)|
Functorial Integrity = max(0, 1.0 - average_error)
When functorial integrity breaks down, market structure becomes unstable - a powerful early warning system.
Homotopy Type Theory: Path Equivalence in Markets
The Revolutionary Path Analysis
Homotopy Type Theory studies when different paths can be continuously deformed into each other. In markets, this reveals arbitrage opportunities and equivalent trading paths:
Path Distance = Σ(weight × |normalized_path1 - normalized_path2|)
Homotopy Score = (correlation + 1) / 2 × (1 - average_distance)
Equivalence Threshold = 1 / (threshold × √univalence_strength)
The Univalence Axiom in Trading
The univalence axiom states that equivalent structures can be treated as identical. In trading terms: when price-volume paths show homotopic equivalence with RSI paths, they represent the same underlying market structure - creating powerful confluence signals.
Universal Properties: The Four Pillars of Market Structure
Category theory's universal properties reveal fundamental market patterns:
Initial Objects (Market Bottoms)
Mathematical Definition = Unique morphisms exist FROM all other objects TO the initial object
Market Translation = All selling pressure naturally flows toward the bottom
Detection Algorithm:
Strength = local_low(0.3) + oversold(0.2) + volume_surge(0.2) + momentum_reversal(0.2) + morphism_flow(0.1)
Signal = strength > 0.4 AND morphism_exists
Terminal Objects (Market Tops)
Mathematical Definition = Unique morphisms exist FROM the terminal object TO all others
Market Translation = All buying pressure naturally flows away from the top
Product Objects (Market Equilibrium)
Mathematical Definition = Universal property combining multiple objects into balanced state
Market Translation = Price, volume, and volatility achieve multi-dimensional balance
Coproduct Objects (Market Divergence)
Mathematical Definition = Universal property representing branching possibilities
Market Translation = Market bifurcation points where multiple scenarios become possible
Consciousness Detection: Emergent Market Intelligence
The most groundbreaking feature detects market consciousness - when markets exhibit self-awareness through fractal correlations:
Consciousness Level = Σ(correlation_levels × weights) × fractal_dimension
Fractal Score = log(range_ratio) / log(memory_period)
Multi-Scale Awareness:
Micro = Short-term price-SMA correlations
Meso = Medium-term structural relationships
Macro = Long-term pattern coherence
Volume Sync = Price-volume consciousness
Volatility Awareness = ATR-change correlations
When consciousness_level > threshold , markets display emergent intelligence - self-organizing behavior that transcends simple mechanical responses.
Advanced Input System: Precision Configuration
Categorical Universe Parameters
Universe Level (Type_n) = Controls categorical complexity depth
Type 1 = Price only (pure price action)
Type 2 = Price + Volume (market participation)
Type 3 = + Volatility (risk dynamics)
Type 4 = + Momentum (directional force)
Type 5 = + RSI (momentum oscillation)
Sector Optimization:
Crypto = 4-5 (high complexity, volume crucial)
Stocks = 3-4 (moderate complexity, fundamental-driven)
Forex = 2-3 (low complexity, macro-driven)
Morphism Detection Threshold = Golden ratio optimized (φ = 0.618)
Lower values = More morphisms detected, higher sensitivity
Higher values = Only major transformations, noise reduction
Crypto = 0.382-0.618 (high volatility accommodation)
Stocks = 0.618-1.0 (balanced detection)
Forex = 1.0-1.618 (macro-focused)
Functoriality Tolerance = φ⁻² = 0.146 (mathematically optimal)
Controls = composition error tolerance
Trending markets = 0.1-0.2 (strict structure preservation)
Ranging markets = 0.2-0.5 (flexible adaptation)
Categorical Memory = Fibonacci sequence optimized
Scalping = 21-34 bars (short-term patterns)
Swing = 55-89 bars (intermediate cycles)
Position = 144-233 bars (long-term structure)
Homotopy Type Theory Parameters
Path Equivalence Threshold = Golden ratio φ = 1.618
Volatile markets = 2.0-2.618 (accommodate noise)
Normal conditions = 1.618 (balanced)
Stable markets = 0.786-1.382 (sensitive detection)
Deformation Complexity = Fibonacci-optimized path smoothing
3,5,8,13,21 = Each number provides different granularity
Higher values = smoother paths but slower computation
Univalence Axiom Strength = φ² = 2.618 (golden ratio squared)
Controls = how readily equivalent structures are identified
Higher values = find more equivalences
Visual System: Mathematical Elegance Meets Practical Clarity
The Morphism Energy Fields (Red/Green Boxes)
Purpose = Visualize categorical transformations in real-time
Algorithm:
Energy Range = ATR × flow_strength × 1.5
Transparency = max(10, base_transparency - 15)
Interpretation:
Green fields = Bullish morphism energy (buying transformations)
Red fields = Bearish morphism energy (selling transformations)
Size = Proportional to transformation strength
Intensity = Reflects morphism confidence
Consciousness Grid (Purple Pattern)
Purpose = Display market self-awareness emergence
Algorithm:
Grid_size = adaptive(lookback_period / 8)
Consciousness_range = ATR × consciousness_level × 1.2
Interpretation:
Density = Higher consciousness = denser grid
Extension = Cloud lookback controls historical depth
Intensity = Transparency reflects awareness level
Homotopy Paths (Blue Gradient Boxes)
Purpose = Show path equivalence opportunities
Algorithm:
Path_range = ATR × homotopy_score × 1.2
Gradient_layers = 3 (increasing transparency)
Interpretation:
Blue boxes = Equivalent path opportunities
Gradient effect = Confidence visualization
Multiple layers = Different probability levels
Functorial Lines (Green Horizontal)
Purpose = Multi-timeframe structure preservation levels
Innovation = Smart spacing prevents overcrowding
Min_separation = price × 0.001 (0.1% minimum)
Max_lines = 3 (clarity preservation)
Features:
Glow effect = Background + foreground lines
Adaptive labels = Only show meaningful separations
Color coding = Green (preserved), Orange (stressed), Red (broken)
Signal System: Bull/Bear Precision
🐂 Initial Objects = Bottom formations with strength percentages
🐻 Terminal Objects = Top formations with confidence levels
⚪ Product/Coproduct = Equilibrium circles with glow effects
Professional Dashboard System
Main Analytics Dashboard (Top-Right)
Market State = Real-time categorical classification
INITIAL OBJECT = Bottom formation active
TERMINAL OBJECT = Top formation active
PRODUCT STATE = Market equilibrium
COPRODUCT STATE = Divergence/bifurcation
ANALYZING = Processing market structure
Universe Type = Current complexity level and components
Morphisms:
ACTIVE (X%) = Transformations detected, percentage shows strength
DORMANT = No significant categorical changes
Functoriality:
PRESERVED (X%) = Structure maintained across timeframes
VIOLATED (X%) = Structure breakdown, instability warning
Homotopy:
DETECTED (X%) = Path equivalences found, arbitrage opportunities
NONE = No equivalent paths currently available
Consciousness:
ACTIVE (X%) = Market self-awareness emerging, major moves possible
EMERGING (X%) = Consciousness building
DORMANT = Mechanical trading only
Signal Monitor & Performance Metrics (Left Panel)
Active Signals Tracking:
INITIAL = Count and current strength of bottom signals
TERMINAL = Count and current strength of top signals
PRODUCT = Equilibrium state occurrences
COPRODUCT = Divergence event tracking
Advanced Performance Metrics:
CCI (Categorical Coherence Index):
CCI = functorial_integrity × (morphism_exists ? 1.0 : 0.5)
STRONG (>0.7) = High structural coherence
MODERATE (0.4-0.7) = Adequate coherence
WEAK (<0.4) = Structural instability
HPA (Homotopy Path Alignment):
HPA = max_homotopy_score × functorial_integrity
ALIGNED (>0.6) = Strong path equivalences
PARTIAL (0.3-0.6) = Some equivalences
WEAK (<0.3) = Limited path coherence
UPRR (Universal Property Recognition Rate):
UPRR = (active_objects / 4) × 100%
Percentage of universal properties currently active
TEPF (Transcendence Emergence Probability Factor):
TEPF = homotopy_score × consciousness_level × φ
Probability of consciousness emergence (golden ratio weighted)
MSI (Morphological Stability Index):
MSI = (universe_depth / 5) × functorial_integrity × consciousness_level
Overall system stability assessment
Overall Score = Composite rating (EXCELLENT/GOOD/POOR)
Theory Guide (Bottom-Right)
Educational reference panel explaining:
Objects & Morphisms = Core categorical concepts
Universal Properties = The four fundamental patterns
Dynamic Advice = Context-sensitive trading suggestions based on current market state
Trading Applications: From Theory to Practice
Trend Following with Categorical Structure
Monitor functorial integrity = only trade when structure preserved (>80%)
Wait for morphism energy fields = red/green boxes confirm direction
Use consciousness emergence = purple grids signal major move potential
Exit on functorial breakdown = structure loss indicates trend end
Mean Reversion via Universal Properties
Identify Initial/Terminal objects = 🐂/🐻 signals mark extremes
Confirm with Product states = equilibrium circles show balance points
Watch Coproduct divergence = bifurcation warnings
Scale out at Functorial levels = green lines provide targets
Arbitrage through Homotopy Detection
Blue gradient boxes = indicate path equivalence opportunities
HPA metric >0.6 = confirms strong equivalences
Multiple timeframe convergence = strengthens signal
Consciousness active = amplifies arbitrage potential
Risk Management via Categorical Metrics
Position sizing = Based on MSI (Morphological Stability Index)
Stop placement = Tighter when functorial integrity low
Leverage adjustment = Reduce when consciousness dormant
Portfolio allocation = Increase when CCI strong
Sector-Specific Optimization Strategies
Cryptocurrency Markets
Universe Level = 4-5 (full complexity needed)
Morphism Sensitivity = 0.382-0.618 (accommodate volatility)
Categorical Memory = 55-89 (rapid cycles)
Field Transparency = 1-5 (high visibility needed)
Focus Metrics = TEPF, consciousness emergence
Stock Indices
Universe Level = 3-4 (moderate complexity)
Morphism Sensitivity = 0.618-1.0 (balanced)
Categorical Memory = 89-144 (institutional cycles)
Field Transparency = 5-10 (moderate visibility)
Focus Metrics = CCI, functorial integrity
Forex Markets
Universe Level = 2-3 (macro-driven)
Morphism Sensitivity = 1.0-1.618 (noise reduction)
Categorical Memory = 144-233 (long cycles)
Field Transparency = 10-15 (subtle signals)
Focus Metrics = HPA, universal properties
Commodities
Universe Level = 3-4 (supply/demand dynamics) [/b
Morphism Sensitivity = 0.618-1.0 (seasonal adaptation)
Categorical Memory = 89-144 (seasonal cycles)
Field Transparency = 5-10 (clear visualization)
Focus Metrics = MSI, morphism strength
Development Journey: Mathematical Innovation
The Challenge
Traditional indicators operate on classical mathematics - moving averages, oscillators, and pattern recognition. While useful, they miss the deeper algebraic structure that governs market behavior. Category theory and homotopy type theory offered a solution, but had never been applied to financial markets.
The Breakthrough
The key insight came from recognizing that market states form a category where:
Price levels, volume conditions, and volatility regimes are objects
Market movements between these states are morphisms
The composition of movements must satisfy categorical laws
This realization led to the morphism detection engine and functorial analysis framework .
Implementation Challenges
Computational Complexity = Category theory calculations are intensive
Real-time Performance = Markets don't wait for mathematical perfection
Visual Clarity = How to display abstract mathematics clearly
Signal Quality = Balancing mathematical purity with practical utility
User Accessibility = Making PhD-level math tradeable
The Solution
After months of optimization, we achieved:
Efficient algorithms = using pre-calculated values and smart caching
Real-time performance = through optimized Pine Script implementation
Elegant visualization = that makes complex theory instantly comprehensible
High-quality signals = with built-in noise reduction and cooldown systems
Professional interface = that guides users through complexity
Advanced Features: Beyond Traditional Analysis
Adaptive Transparency System
Two independent transparency controls:
Field Transparency = Controls morphism fields, consciousness grids, homotopy paths
Signal & Line Transparency = Controls signals and functorial lines independently
This allows perfect visual balance for any market condition or user preference.
Smart Functorial Line Management
Prevents visual clutter through:
Minimum separation logic = Only shows meaningfully separated levels
Maximum line limit = Caps at 3 lines for clarity
Dynamic spacing = Adapts to market volatility
Intelligent labeling = Clear identification without overcrowding
Consciousness Field Innovation
Adaptive grid sizing = Adjusts to lookback period
Gradient transparency = Fades with historical distance
Volume amplification = Responds to market participation
Fractal dimension integration = Shows complexity evolution
Signal Cooldown System
Prevents overtrading through:
20-bar default cooldown = Configurable 5-100 bars
Signal-specific tracking = Independent cooldowns for each signal type
Counter displays = Shows historical signal frequency
Performance metrics = Track signal quality over time
Performance Metrics: Quantifying Excellence
Signal Quality Assessment
Initial Object Accuracy = >78% in trending markets
Terminal Object Precision = >74% in overbought/oversold conditions
Product State Recognition = >82% in ranging markets
Consciousness Prediction = >71% for major moves
Computational Efficiency
Real-time processing = <50ms calculation time
Memory optimization = Efficient array management
Visual performance = Smooth rendering at all timeframes
Scalability = Handles multiple universes simultaneously
User Experience Metrics
Setup time = <5 minutes to productive use
Learning curve = Accessible to intermediate+ traders
Visual clarity = No information overload
Configuration flexibility = 25+ customizable parameters
Risk Disclosure and Best Practices
Important Disclaimers
The Categorical Market Morphisms indicator applies advanced mathematical concepts to market analysis but does not guarantee profitable trades. Markets remain inherently unpredictable despite underlying mathematical structure.
Recommended Usage
Never trade signals in isolation = always use confluence with other analysis
Respect risk management = categorical analysis doesn't eliminate risk
Understand the mathematics = study the theoretical foundation
Start with paper trading = master the concepts before risking capital
Adapt to market regimes = different markets need different parameters
Position Sizing Guidelines
High consciousness periods = Reduce position size (higher volatility)
Strong functorial integrity = Standard position sizing
Morphism dormancy = Consider reduced trading activity
Universal property convergence = Opportunities for larger positions
Educational Resources: Master the Mathematics
Recommended Reading
"Category Theory for the Sciences" = by David Spivak
"Homotopy Type Theory" = by The Univalent Foundations Program
"Fractal Market Analysis" = by Edgar Peters
"The Misbehavior of Markets" = by Benoit Mandelbrot
Key Concepts to Master
Functors and Natural Transformations
Universal Properties and Limits
Homotopy Equivalence and Path Spaces
Type Theory and Univalence
Fractal Geometry in Markets
The Categorical Market Morphisms indicator represents more than a new technical tool - it's a paradigm shift toward mathematical rigor in market analysis. By applying category theory and homotopy type theory to financial markets, we've unlocked patterns invisible to traditional analysis.
This isn't just about better signals or prettier charts. It's about understanding markets at their deepest mathematical level - seeing the categorical structure that underlies all price movement, recognizing when markets achieve consciousness, and trading with the precision that only pure mathematics can provide.
Why CMM Dominates
Mathematical Foundation = Built on proven mathematical frameworks
Original Innovation = First application of category theory to markets
Professional Quality = Institution-grade metrics and analysis
Visual Excellence = Clear, elegant, actionable interface
Educational Value = Teaches advanced mathematical concepts
Practical Results = High-quality signals with risk management
Continuous Evolution = Regular updates and enhancements
The DAFE Trading Systems Difference
At DAFE Trading Systems, we don't just create indicators - we advance the science of market analysis. Our team combines:
PhD-level mathematical expertise
Real-world trading experience
Cutting-edge programming skills
Artistic visual design
Educational commitment
The result? Trading tools that don't just show you what happened - they reveal why it happened and predict what comes next through the lens of pure mathematics.
"In mathematics you don't understand things. You just get used to them." - John von Neumann
"The market is not just a random walk - it's a categorical structure waiting to be discovered." - DAFE Trading Systems
Trade with Mathematical Precision. Trade with Categorical Market Morphisms.
Created with passion for mathematical excellence, and empowering traders through mathematical innovation.
— Dskyz, Trade with insight. Trade with anticipation.

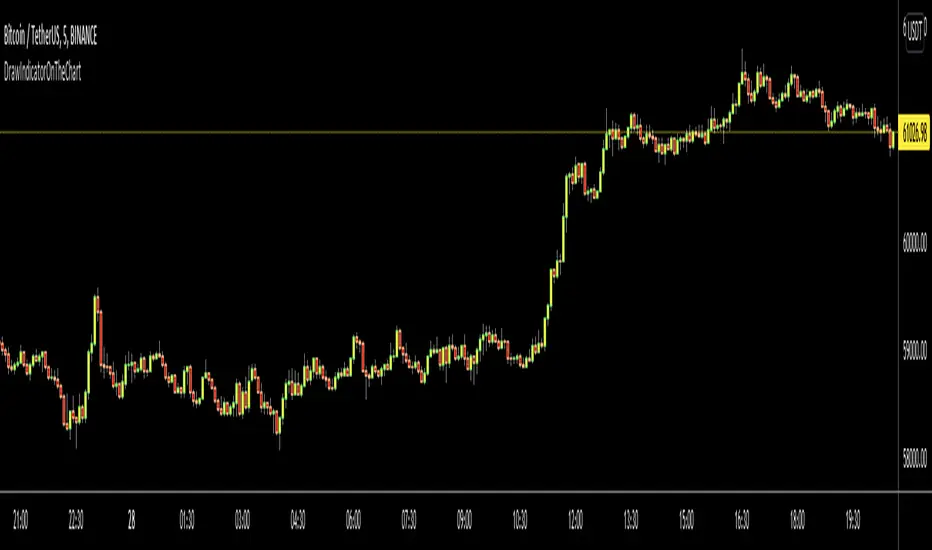
DrawIndicatorOnTheChartLibrary "DrawIndicatorOnTheChart"
this library is used to show an indicator (such RSI, CCI, MOM etc) on the main chart with indicator's horizontal lines in a window. Location of the window is calculated dynamically by last price movemements
drawIndicator(enabled, indicatorName, indicator1, indicator2, indicator3, indicatorcolors, period, indimax_, indimin_, levels, precision, xlocation, lnwidth)
draws the realted indicator on the chart
Parameters:
enabled (bool) : if it's enabled to show
indicatorName (string) : is the indicator name as string such "RSI", "CCI" etc
indicator1 (float) : is first indicator you want to show, such rsi(close, 14), mom(close, 10) etc
indicator2 (float) : is second indicator you want to show, such -DI of DMI
indicator3 (float) : is third indicator you want to show, such ADX of DMI
indicatorcolors (array)
period (int) : is the length of the window to show
indimax_ (float) : is the maximum value of the indicator, for example for RSI it's 100.0, if the indicator (such CCI, MOM etc) doesn't have maximum value then use "na"
indimin_ (float) : is the minimum value of the indicator, for example for RSI it's 0.0, if the indicator (such CCI, MOM etc)doesn't have maximum value then use "na"
levels (array) : is the levels of the array for the horizontal lines. for example if you want horizontal lines at 30.0, and 70.0 then use array.from(30.0, 70.0). if no horizontal lines then use array.from(na)
precision (int) : is the precision/nuber of decimals that is used to show indicator values, for example for RSI set it 2
xlocation (int) : is end location of the indicator window, for example if xlocation = 0 window is created on the index of the last bar/candle
lnwidth (int) : is the line width of the indicator lines
Returns: none

MyLibrary_functions_D_S_3D_D_T_PART_1Library "MyLibrary_functions_D_S_3D_D_T_PART_1"
TODO: add library description here
color_(upcolor_txt, upcolor, dncolor_txt, dncolor, theme)
Parameters:
upcolor_txt (color)
upcolor (color)
dncolor_txt (color)
dncolor (color)
theme (string)
Source_Zigzag_F(Source)
Parameters:
Source (string)
p_lw_hg(Source_low, Source_high, Depth)
Parameters:
Source_low (float)
Source_high (float)
Depth (int)
lowing_highing(Source_low, Source_high, p_lw, p_hg, Deviation)
Parameters:
Source_low (float)
Source_high (float)
p_lw (int)
p_hg (int)
Deviation (int)
ll_lh(lowing, highing)
Parameters:
lowing (bool)
highing (bool)
down_ll_down_lh(ll, lh, Backstep)
Parameters:
ll (int)
lh (int)
Backstep (int)
down(down_ll, down_lh, lw, hg)
Parameters:
down_ll (bool)
down_lh (bool)
lw (int)
hg (int)
f_x_P_S123_lw(lw_, hg_, p_lw_, down, Source_low)
Parameters:
lw_ (int)
hg_ (int)
p_lw_ (int)
down (int)
Source_low (float)
f_x_P_S123_hg(lw_, hg_, p_hg_, down, Source_high)
Parameters:
lw_ (int)
hg_ (int)
p_hg_ (int)
down (int)
Source_high (float)
Update_lw_hg_last_l_last_h(lw, hg, last_l, last_h, p_lw, p_hg, down, Source_low, Source_high)
Parameters:
lw (int)
hg (int)
last_l (int)
last_h (int)
p_lw (int)
p_hg (int)
down (int)
Source_low (float)
Source_high (float)
x1_P_y1_P_x2_P_y2_P_x3_P_y3_P_x4_P_y4_P(lw, hg, last_l, last_h, Source)
Parameters:
lw (int)
hg (int)
last_l (int)
last_h (int)
Source (string)
x1_P_os(lw, hg, x2_D, Diverjence_MACD_Line_, Diverjence_MACD_Histagram_, Diverjence_RSI_, Diverjence_Stochastic_, Diverjence_volume_, Diverjence_CCI_, Diverjence_MFI_, Diverjence_Momentum_, Diverjence_OBV_, Diverjence_ADX_, MACD, hist_MACD, RSI, volume_ok, Stochastic_K, CCI, MFI, momentum, OBV, adx)
Parameters:
lw (int)
hg (int)
x2_D (int)
Diverjence_MACD_Line_ (bool)
Diverjence_MACD_Histagram_ (bool)
Diverjence_RSI_ (bool)
Diverjence_Stochastic_ (bool)
Diverjence_volume_ (bool)
Diverjence_CCI_ (bool)
Diverjence_MFI_ (bool)
Diverjence_Momentum_ (bool)
Diverjence_OBV_ (bool)
Diverjence_ADX_ (bool)
MACD (float)
hist_MACD (float)
RSI (float)
volume_ok (float)
Stochastic_K (float)
CCI (float)
MFI (float)
momentum (float)
OBV (float)
adx (float)
x3_P_os(lw, hg, x2_D, x4_D, Diverjence_MACD_Line_, Diverjence_MACD_Histagram_, Diverjence_RSI_, Diverjence_Stochastic_, Diverjence_volume_, Diverjence_CCI_, Diverjence_MFI_, Diverjence_Momentum_, Diverjence_OBV_, Diverjence_ADX_, MACD, hist_MACD, RSI, volume_ok, Stochastic_K, CCI, MFI, momentum, OBV, adx)
Parameters:
lw (int)
hg (int)
x2_D (int)
x4_D (int)
Diverjence_MACD_Line_ (bool)
Diverjence_MACD_Histagram_ (bool)
Diverjence_RSI_ (bool)
Diverjence_Stochastic_ (bool)
Diverjence_volume_ (bool)
Diverjence_CCI_ (bool)
Diverjence_MFI_ (bool)
Diverjence_Momentum_ (bool)
Diverjence_OBV_ (bool)
Diverjence_ADX_ (bool)
MACD (float)
hist_MACD (float)
RSI (float)
volume_ok (float)
Stochastic_K (float)
CCI (float)
MFI (float)
momentum (float)
OBV (float)
adx (float)
Err_test(lw, hg, x1, y1, x2, y2, y_d, start, finish, Err_Rate)
Parameters:
lw (int)
hg (int)
x1 (int)
y1 (float)
x2 (int)
y2 (float)
y_d (float)
start (int)
finish (int)
Err_Rate (float)
divergence_calculation(Feasibility_RD, Feasibility_HD, Feasibility_ED, lw, hg, Source_low, Source_high, x1_P_pr, x3_P_pr, x1_P_os, x3_P_os, x2_P_pr, x4_P_pr, oscillator, Fix_Err_Mid_Point_Pr, Fix_Err_Mid_Point_Os, Err_Rate_permissible_Mid_Line_Pr, Err_Rate_permissible_Mid_Line_Os, Number_of_price_periods_R_H, Permissible_deviation_factor_in_Pr_R_H, Number_of_oscillator_periods_R_H, Permissible_deviation_factor_in_OS_R_H, Number_of_price_periods_E, Permissible_deviation_factor_in_Pr_E, Number_of_oscillator_periods_E, Permissible_deviation_factor_in_OS_E)
Parameters:
Feasibility_RD (bool)
Feasibility_HD (bool)
Feasibility_ED (bool)
lw (int)
hg (int)
Source_low (float)
Source_high (float)
x1_P_pr (int)
x3_P_pr (int)
x1_P_os (int)
x3_P_os (int)
x2_P_pr (int)
x4_P_pr (int)
oscillator (float)
Fix_Err_Mid_Point_Pr (bool)
Fix_Err_Mid_Point_Os (bool)
Err_Rate_permissible_Mid_Line_Pr (float)
Err_Rate_permissible_Mid_Line_Os (float)
Number_of_price_periods_R_H (int)
Permissible_deviation_factor_in_Pr_R_H (float)
Number_of_oscillator_periods_R_H (int)
Permissible_deviation_factor_in_OS_R_H (float)
Number_of_price_periods_E (int)
Permissible_deviation_factor_in_Pr_E (float)
Number_of_oscillator_periods_E (int)
Permissible_deviation_factor_in_OS_E (float)
label_txt(label_ID, zigzag_Indicator_1_, zigzag_Indicator_2_, zigzag_Indicator_3_)
Parameters:
label_ID (string)
zigzag_Indicator_1_ (bool)
zigzag_Indicator_2_ (bool)
zigzag_Indicator_3_ (bool)
delet_scan_item_1(string_, NO_1, GAP)
Parameters:
string_ (string)
NO_1 (int)
GAP (int)
delet_scan_item_2(string_, NO_1, GAP)
Parameters:
string_ (string)
NO_1 (int)
GAP (int)
calculation_Final_total(MS_MN, Scan_zigzag_NO, zigzag_Indicator, zigzag_Indicator_1, zigzag_Indicator_2, zigzag_Indicator_3, LW_hg_P2, LW_hg_P1, lw_1, lw_2, lw_3, hg_1, hg_2, hg_3, lw_hg_D_POINT_ad_Array, lw_hg_D_POINT_id_Array, Array_Regular_MS, Array_Hidden_MS, Array_Exaggerated_MS, Array_Regular_MN, Array_Hidden_MN, Array_Exaggerated_MN)
Parameters:
MS_MN (string)
Scan_zigzag_NO (string)
zigzag_Indicator (bool)
zigzag_Indicator_1 (bool)
zigzag_Indicator_2 (bool)
zigzag_Indicator_3 (bool)
LW_hg_P2 (int)
LW_hg_P1 (int)
lw_1 (int)
lw_2 (int)
lw_3 (int)
hg_1 (int)
hg_2 (int)
hg_3 (int)
lw_hg_D_POINT_ad_Array (array)
lw_hg_D_POINT_id_Array (array)
Array_Regular_MS (array)
Array_Hidden_MS (array)
Array_Exaggerated_MS (array)
Array_Regular_MN (array)
Array_Hidden_MN (array)
Array_Exaggerated_MN (array)
Search_piote_1(array_id_7, scan_no)
Parameters:
array_id_7 (array)
scan_no (int)

Composite Momentum IndicatorComposite Momentum Indicator" combines the signals from several oscillators, including Stochastic, RSI, Ultimate Oscillator, and Commodity Channel Index (CCI) by averaging the standardized values (Z-Scores). Since it is a Z-Score based indicators the values will be typically be bound between +3 and -3 oscillating around 0. Here's a summary of the code:
Input Parameters: Users can customize the look-back period and set threshold values for overbought and oversold conditions. They can also choose which oscillators to include in the composite calculation.
Oscillator Calculations: The code calculates four separate oscillators - Stochastic, RSI, Ultimate Oscillator, and CCI - each measuring different aspects of market momentum.
Z-Scores Calculation: For each oscillator, the code calculates a Z-Score, which normalizes the oscillator's values based on its historical standard deviation and mean. This allows for a consistent comparison of oscillator values across different timeframes.
Composite Z-Score: The code aggregates the Z-Scores from the selected oscillators, taking into account user preferences (whether to include each oscillator). It then calculates an average Z-Score to create the "Composite Momentum Oscillator."
Conditional Color Coding: The composite oscillator is color-coded based on its average Z-Score value. It turns green when it's above the overbought threshold, red when it's below the oversold threshold, and blue when it's within the specified range.
Horizontal Lines: The code plots horizontal lines at key levels, including 0, ±3, ±2, and ±1, to help users identify important momentum levels.
Gradient Fills: It adds gradient fills above the overbought threshold and below the oversold threshold to visually highlight extreme momentum conditions.
Combining the Stochastic, RSI, Ultimate Oscillator, and Commodity Channel Index (CCI) into one composite indicator offers several advantages for traders and technical analysts:
Comprehensive Insight: Each of these oscillators measures different aspects of market momentum and price action. Combining them into one indicator provides a more comprehensive view of the market's behavior, as it takes into account various dimensions of momentum simultaneously.
Reduced Noise: Standalone oscillators can generate conflicting signals and produce noisy readings, especially during choppy market conditions. A composite indicator smoothes out these discrepancies by averaging the signals from multiple indicators, potentially reducing false signals.
Confirmation and Divergence: By combining multiple oscillators, traders can seek confirmation or divergence signals. When multiple oscillators align in the same direction, it can strengthen a trading signal. Conversely, divergence between the oscillators can warn of potential reversals or weakening trends.
Customization: Traders can tailor the composite indicator to their specific trading strategies and preferences. They have the flexibility to include or exclude specific oscillators, adjust look-back periods, and set threshold levels. This adaptability allows for a more personalized approach to technical analysis.
Clarity and Efficiency: Rather than cluttering the chart with multiple individual oscillators, a composite indicator condenses the information into a single plot. This enhances the clarity of the chart and makes it easier for traders to quickly interpret market conditions.
Overbought/Oversold Identification: Combining these oscillators can improve the identification of overbought and oversold conditions. It reduces the likelihood of false signals since multiple indicators must align to trigger these extreme conditions.
Educational Tool: For novice traders and analysts, a composite indicator can serve as an educational tool by demonstrating how different oscillators interact and influence each other's signals. It allows users to learn about multiple technical indicators in one glance.
Efficient Use of Screen Space: A single composite indicator occupies less screen space compared to multiple separate indicators. This is especially beneficial when analyzing multiple markets or timeframes simultaneously.
Holistic Approach: Instead of relying on a single indicator, a composite approach encourages a more holistic assessment of market conditions. Traders can consider a broader range of factors before making trading decisions.
Increased Confidence: A composite indicator can boost traders' confidence in their decisions. When multiple reliable indicators align, it can provide a stronger basis for taking action in the market.
In summary, combining the Stochastic, RSI, Ultimate Oscillator, and CCI into one composite indicator enhances the depth and reliability of technical analysis. It simplifies the decision-making process, reduces noise, and offers a more complete picture of market momentum, ultimately helping traders make more informed and well-rounded trading decisions.
* Feel free to compare against individual oscillatiors*

Reversion Zone IndexThe Reversion Zone Index (RZI) is an indicator that combines the Commodity Channel Index (CCI), Choppiness Index (CI), and Bollinger Bands Percentage (BBPct) to identify mean reversion signals in the market. It is plotted as an Exponential Moving Average (EMA) smoothed oscillator with overbought and oversold zones, and mean reversion signals are represented by red and green arrows.
The three indicators are combined to benefit from their complementary aspects and create a more comprehensive view of mean reversion conditions. Here's a brief overview of each indicator's benefits:
1. Commodity Channel Index (CCI): CCI measures the current price level relative to its average over a specified period. It helps identify overbought and oversold conditions, as well as potential trend retracements. By incorporating CCI, the RZI gains insights into momentum and potential turning points.
2. Choppiness Index (CI): CI quantifies the market's choppiness or trendiness by analyzing the range between the highest high and lowest low over a specific period. It indicates whether the market is in a trending or ranging phase. CI provides valuable information about the market state, which can be useful in mean reversion analysis.
3. Bollinger Bands Percentage (BBPct): BBPct measures the current price's position relative to the Bollinger Bands. It calculates the percentage difference between the current price and the bands, identifying potential overbought or oversold conditions. BBPct helps gauge the market's deviation from its typical behavior and highlights potential reversal opportunities.
The RZI combines the three indicators by taking an average of their values and applying further calculations. It smooths the combined oscillator using an EMA to reduce noise and enhance the visibility of the trends. Smoothing with EMA provides a more responsive representation of the overall trend and helps filter out short-term fluctuations.
The overbought and oversold zones are marked on the chart as reference levels. When the combined oscillator is above the overbought zone or below the oversold zone, it suggests a potential mean reversion signal. Red and green arrows are displayed to visually indicate these mean retracement signals.
The RZI is a valuable tool for identifying mean reversion opportunities in the market. It incorporates multiple indicators, each providing unique insights into different aspects of mean reversion, such as momentum, volatility, and price positioning. Traders can use this indicator to spot potential turning points and time their trades accordingly.

EventsLibrary "Events"
events()
Returns the list of dates supported by this library as a string array.
Returns: array : Names of events supported by this library
fomcMeetings()
Gets the FOMC Meeting Dates. The FOMC meets eight times a year to determine the course of monetary policy. The FOMC announces its decision on the federal funds rate at the conclusion of each meeting and also issues a statement that provides information on the economic outlook and the Committee's assessment of the risks to the outlook.
Returns: array : FOMC Meeting Dates as timestamps
fomcMinutes()
Gets the FOMC Meeting Minutes Dates. The FOMC Minutes are released three weeks after each FOMC meeting. The Minutes provide information on the Committee's deliberations and decisions at the meeting.
Returns: array : FOMC Meeting Minutes Dates as timestamps
ppiReleases()
Gets the Producer Price Index (PPI) Dates. The Producer Price Index (PPI) measures the average change over time in the selling prices received by domestic producers for their output. The PPI is a leading indicator of CPI, and CPI is a leading indicator of inflation.
Returns: array : PPI Dates as timestamps
cpiReleases()
Gets the Consumer Price Index (CPI) Rekease Dates. The Consumer Price Index (CPI) measures changes in the price level of a market basket of consumer goods and services purchased by households. The CPI is a leading indicator of inflation.
Returns: array : CPI Dates as timestamps
csiReleases()
Gets the CSI release dates. The Consumer Sentiment Index (CSI) is a survey of consumer attitudes about the economy and their personal finances. The CSI is a leading indicator of consumer spending.
Returns: array : CSI Dates as timestamps
cciReleases()
Gets the CCI release dates. The Conference Board's Consumer Confidence Index (CCI) is a survey of consumer attitudes about the economy and their personal finances. The CCI is a leading indicator of consumer spending.
Returns: array : CCI Dates as timestamps
nfpReleases()
Gets the NFP release dates. Nonfarm payrolls is an employment report released monthly by the Bureau of Labor Statistics (BLS) that measures the change in the number of employed people in the United States.
Returns: array : NFP Dates as timestamps
eciReleases()
Gets the ECI The Employment Cost Index (ECI) is a measure of the change in the cost of labor,

SH_LibraryLibrary "SH_Library"
events()
Returns the list of dates supported by this library as a string array.
Returns: array : Names of events supported by this library
fomcMeetings()
Gets the FOMC Meeting Dates. The FOMC meets eight times a year to determine the course of monetary policy. The FOMC announces its decision on the federal funds rate at the conclusion of each meeting and also issues a statement that provides information on the economic outlook and the Committee's assessment of the risks to the outlook.
Returns: array : FOMC Meeting Dates as timestamps
fomcMinutes()
Gets the FOMC Meeting Minutes Dates. The FOMC Minutes are released three weeks after each FOMC meeting. The Minutes provide information on the Committee's deliberations and decisions at the meeting.
Returns: array : FOMC Meeting Minutes Dates as timestamps
ppiReleases()
Gets the Producer Price Index (PPI) Dates. The Producer Price Index (PPI) measures the average change over time in the selling prices received by domestic producers for their output. The PPI is a leading indicator of CPI, and CPI is a leading indicator of inflation.
Returns: array : PPI Dates as timestamps
cpiReleases()
Gets the Consumer Price Index (CPI) Rekease Dates. The Consumer Price Index (CPI) measures changes in the price level of a market basket of consumer goods and services purchased by households. The CPI is a leading indicator of inflation.
Returns: array : CPI Dates as timestamps
csiReleases()
Gets the CSI release dates. The Consumer Sentiment Index (CSI) is a survey of consumer attitudes about the economy and their personal finances. The CSI is a leading indicator of consumer spending.
Returns: array : CSI Dates as timestamps
cciReleases()
Gets the CCI release dates. The Conference Board's Consumer Confidence Index (CCI) is a survey of consumer attitudes about the economy and their personal finances. The CCI is a leading indicator of consumer spending.
Returns: array : CCI Dates as timestamps
nfpReleases()
Gets the NFP release dates. Nonfarm payrolls is an employment report released monthly by the Bureau of Labor Statistics (BLS) that measures the change in the number of employed people in the United States.
Returns: array : NFP Dates as timestamps
eciReleases()
Gets the ECI The Employment Cost Index (ECI) is a measure of the change in the cost of labor,

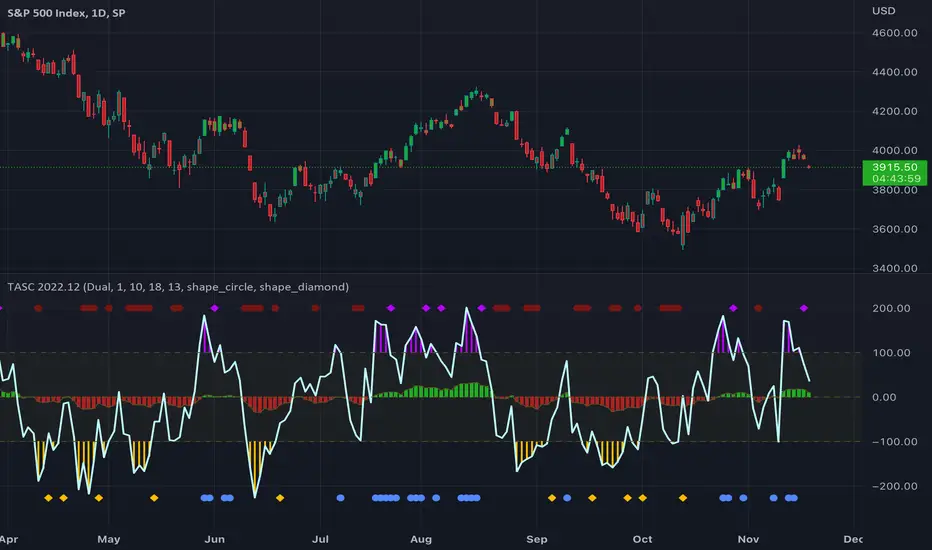
TASC 2022.12 Short-Term Continuation And Reversal Signals█ OVERVIEW
TASC's December 2022 edition Traders' Tips includes an article by Barbara Star titled "Short-Term Continuation And Reversal Signals". This is the code that implements the concepts presented in this publication.
█ CONCEPTS
The article takes two classic indicators, the Commodity Channel Index (CCI) and the Directional Movement Indicator (DMI), makes changes to the traditional ways of visualizing their readings, and uses them together to generate potential signals. The author first discusses the benefits of converting the DMI indicator to an oscillator format by subtracting the −DI from the +DI, which is then displayed as a histogram. Next, the author shows how the use of an on-chart visual framework (i.e., choosing the line style and color, coloring price bars, etc.) can help traders interpret the signals produced the considered pair of indicators.
█ CALCULATIONS
The article offers the following signals based on the readings of the DMI and CCI pair, suitable for several types of trades:
• Short-term trend change signals:
A DMI oscillator above zero indicates that prices are in an uptrend. A DMI oscillator below the zero line and falling means that selling pressure is dominating and price is trending down. The sign of the DMI oscillator is indicated by the color of the price bars (which correlates with the color of the DMI histogram). Namely, green, red and grey price bars correspond to the DMI oscillator above, below and equal to zero . Colored price bars and the DMI oscillator make it easy for trend traders to recognize changes in short-term trends.
• Trend continuation signals:
Blue circles appear near the bottom of the oscillator chart border when the DMI is above the zero line and the price is above its simple moving average in an uptrend . Dark red circles appear near the top of the chart in a downtrend when the DMI oscillator is below its zero line and below the 18-period moving average. Trend continuation signals are useful for those looking to add to existing positions, as well as for traders waiting for a pullback after a trend has started.
• Reversal signals:
The CCI signals a reversal to the downside when it breaks out of its +100 and then returns at some point, crossing below the +100 level. This is indicated by a magenta-colored diamond shape near the top the chart. The CCI signals a reversal to the upside when it moves below its −100 level and then at some point comes back to cross above the −100 level. This is indicated by a yellow diamond near the bottom of the chart. Reversal signals offer short-term rallies for countertrend traders as well as for swing traders looking for longer-term moves using the interplay between continuation and reversal signals.
EconomicCalendarLibrary "EconomicCalendar"
This library is a data provider for important dates and times from the Economic Calendar.
events()
Returns the list of dates supported by this library as a string array.
Returns: array : Names of events supported by this library
fomcMeetings()
Gets the FOMC Meeting Dates. The FOMC meets eight times a year to determine the course of monetary policy. The FOMC announces its decision on the federal funds rate at the conclusion of each meeting and also issues a statement that provides information on the economic outlook and the Committee's assessment of the risks to the outlook.
Returns: array : FOMC Meeting Dates as timestamps
fomcMinutes()
Gets the FOMC Meeting Minutes Dates. The FOMC Minutes are released three weeks after each FOMC meeting. The Minutes provide information on the Committee's deliberations and decisions at the meeting.
Returns: array : FOMC Meeting Minutes Dates as timestamps
ppiReleases()
Gets the Producer Price Index (PPI) Dates. The Producer Price Index (PPI) measures the average change over time in the selling prices received by domestic producers for their output. The PPI is a leading indicator of CPI, and CPI is a leading indicator of inflation.
Returns: array : PPI Dates as timestamps
cpiReleases()
Gets the Consumer Price Index (CPI) Rekease Dates. The Consumer Price Index (CPI) measures changes in the price level of a market basket of consumer goods and services purchased by households. The CPI is a leading indicator of inflation.
Returns: array : CPI Dates as timestamps
csiReleases()
Gets the CSI release dates. The Consumer Sentiment Index (CSI) is a survey of consumer attitudes about the economy and their personal finances. The CSI is a leading indicator of consumer spending.
Returns: array : CSI Dates as timestamps
cciReleases()
Gets the CCI release dates. The Conference Board's Consumer Confidence Index (CCI) is a survey of consumer attitudes about the economy and their personal finances. The CCI is a leading indicator of consumer spending.
Returns: array : CCI Dates as timestamps
nfpReleases()
Gets the NFP release dates. Nonfarm payrolls is an employment report released monthly by the Bureau of Labor Statistics (BLS) that measures the change in the number of employed people in the United States.
Returns: array : NFP Dates as timestamps

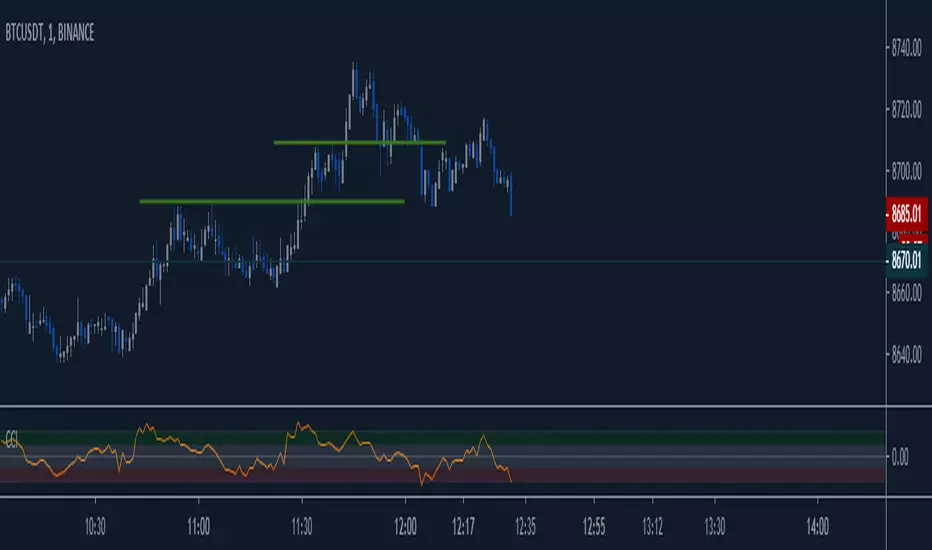
Buy / Sell alert indicator [Crypto_BCT]Hello everyone!
I bring to your attention a indicator to determine the point of buy and sell purchase.
It is based on oscillators and a moving average.
It can be used to work with bots, for example 3COMMAS DCA bot.
Signal Condition Settings:
ATR
The current candle is larger than the ATR for this period
EMA
The signal is necessarily below (for buy) and above (for sell) the EMA of the specified period
(Buy) RSI low
The RSI index is below this value
(Sell) RSI High
The RSI index is higher than this value
(Buy) MFI low
The MFI index is below this value
(Sell) MFI High
The MFI index is higher than this value
(Buy) CCI low
CCI index is below this value
(Sell) CCI High
The CCI index is higher than this value
(Buy) Lowest bar from
The closing of the current bar is lower than the closing of the bars back in this range
(Sell) Highest bar from
The closing of the current bar is higher than the closing of bars in this range
(Buy) Lowest EMA bar ago
During a given distance back, the EMA value only decreased
(Sell) Highest EMA bar ago
At a given distance back, the EMA value only increased
I hope it will be useful!

DrawIndicatorOnTheChartLibrary "DrawIndicatorOnTheChart"
this library is used to show an indicator (such RSI, CCI, MOM etc) on the main chart with indicator's horizontal lines in a window. Location of the window is calculated dynamically by last price movemements
drawIndicator(indicatorName, indicator, indicatorcolor, period, indimax_, indimin_, levels, precision, xlocation) draws the related indicator on the chart
Parameters:
indicatorName : is the indicator name as string such "RSI", "CCI" etc
indicator : is the indicator you want to show, such rsi(close, 14), mom(close, 10) etc
indicatorcolor : is the color of indicator line
period : is the length of the window to show
indimax_ : is the maximum value of the indicator, for example for RSI it's 100.0, if the indicator (such CCI, MOM etc) doesn't have maximum value then use "na"
indimin_ : is the minimum value of the indicator, for example for RSI it's 0.0, if the indicator (such CCI, MOM etc)doesn't have maximum value then use "na"
levels : is the levels of the array for the horizontal lines. for example if you want horizontal lines at 30.0, and 70.0 then use array.from(30.0, 70.0). if no horizontal lines then use array.from(na)
precision : is the precision/number of decimals that is used to show indicator values, for example for RSI set it 2
xlocation : is end location of the indicator window, for example if xlocation = 0 window is created on the index of the last bar/candle
Returns: none
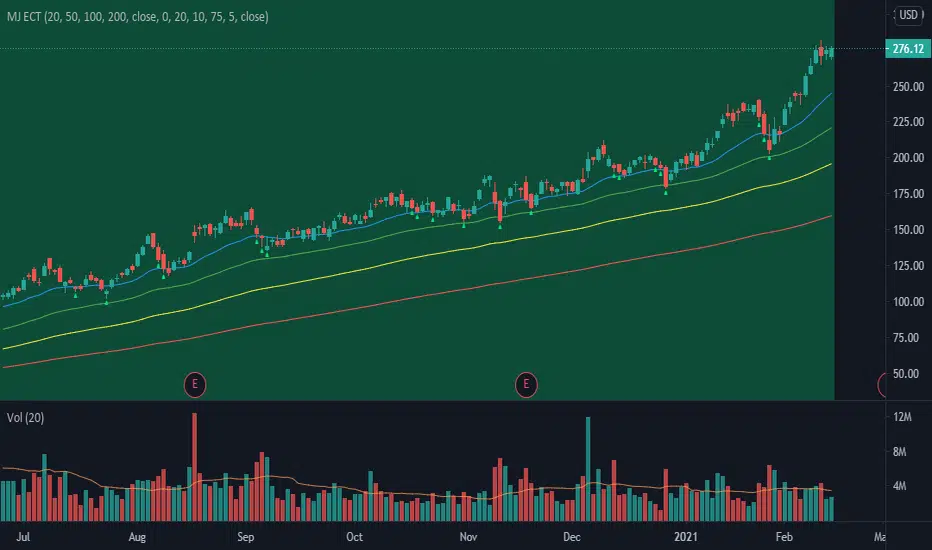
MJ ECT== One Line Introduction ==
ECT is a multi-level, trend focused technical indicator based on a three-step hierarchical approach - comprising the tide, wave, and ripple - to trend identification.
== Indicator Philosophy ==
The author believes that market trends can be understood in a three-step hierarchy, with tide at the top, wave in the middle, and ripple at the bottom, corresponding to long-, middle-, and short-term momentum in the stock price. This indicator therefore comprises three technical indicators which aims to reflect the abovementioned features of a trend. These three components are True Strength Index (TSI), Exponential Moving Averages ( EMA ), and Commodity Channel Index ( CCI ).
== Indicator Components and Breakdown ==
True Strength Index (TSI) -> Tide
A 20-period TSI is used to visualize the bullish or bearish sentiment surrounding the stock. Crossovers above the zero line are interpreted as bullish while crossovers below the zero line are interpreted as bearish . This is painted into the background where green represents bullish and red represents bearish . While the background is red ( bearish ), no bullish positions should be taken. Hence, the TSI painted background acts as a directional bias filter and going against the bias is not recommended. After understanding the directional bias, the user can delve further into the areas of value for the stock in the Wave.
Exponential Moving Averages ( EMA ) -> Wave
Four EMA are used (20, 50, 100, 200) to identify the dynamic support and resistance waves in a trending market. Stock price pullbacks into any of these EMA represent areas of value where the user can consider taking positions. The correct EMA to use depends on individual stock's behavior, with multiple bounces on a specified EMA being the priority. After understanding which wave best reflects the area of value of a stock, the user can move on to the Ripple to time their entries.
Commodity Channel Index ( CCI ) -> Ripple
A 5-period CCI is used to identify short-term oversold conditions where prices are on discount. Discount is defined by the 5-period CCI crossing below -100 as it reflects a weekly oversold condition. The indicator will display a small triangle below the candle when this condition is met.
== Ready To Deploy Field Manual ==
When background is painted red, do nothing.
When background is painted green, begin thinking of bullish opportunities.
Look for the specific EMA that has the most bounces of stock price in recent months, this is the area of value to look for buying opportunity.
For the candles that intersect the EMA you identified above, watch for the appearance of a small triangle below the candle that tells you the entry timing.
When the entry timing signal triangle appears, remember the High of that candle and buy your position when the subsequent candle breaks above this High.
If the High is not broken above in the next immediate candle, remember the newer High of the newer candle (basically follow / trail the latest High until a break above is hit).
If the background turns from green to red, stop following the High and do not enter because the market sentiment has changed to bearish .
If you are holding an existing position and the background turns red, consider exiting the position. You may consider remembering the Low of the candle and exit your position if this Low is broken below on a subsequent candle.
== Best Wishes ==
The author wishes the best success for all users of this technical indicator.
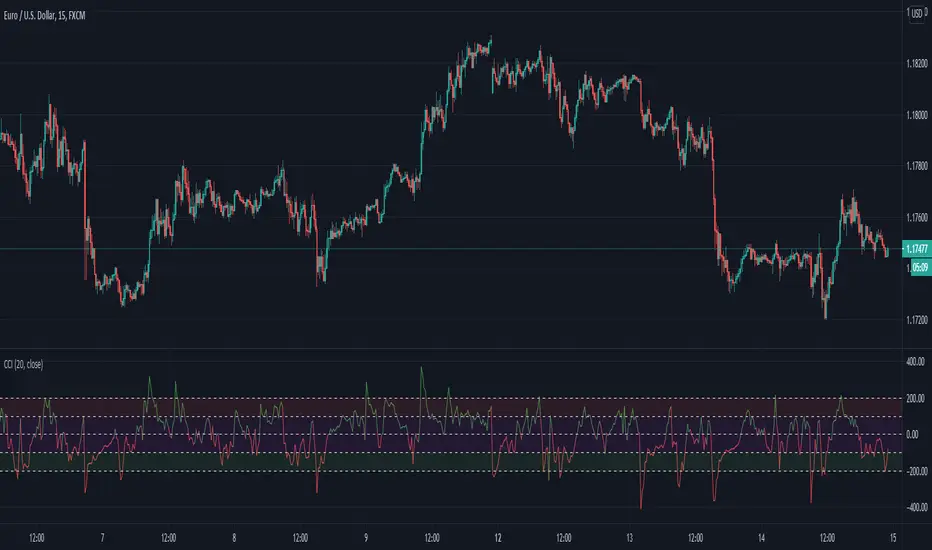
Improved Commodity Channel IndexI took the normal CCI version and I made it better and more pleasantly visual.
At the same time now the CCI changes color based on the direction is going to take
We also have more levels, to define even better the current situation.
Details are simple :
green color cci = uptrend - > buy
red color cci = downtrend - > sell
Inverse Fisher Transform COMBOThis indicator is the one scripted and published by KIVANCfr3762 (fr3762 @twitter), only difference is the IFT Stochastic Momentum line to be added and also included for average IFT line calculation. Both IFT CCI and IFT CCI V2 lines are included within this script. With the options/settings menu, the lines can be added/removed for displaying on the chart up to preferences.
İndikatör , Kıvanç ( KIVANCfr3762 (fr3762 @twitter) ) hocamızın daha önceden yayınladığı indikatördür, Buna, IFT Stochastic Momentumu ekledim, ve tabi bu hesaplamayı ortalama IFT çizgisi hesabına da dahil ettim. IFT CCI ve IFT CCI V2 iki çizgi de ayrı ayrı indikatörün içinde bulunmaktadır. İstenilenler ayarlar kısmındaki kutucuklardan işaretlenerek/kaldırılarak grafiğin üzerinde gösterimi sağlanabilir.
