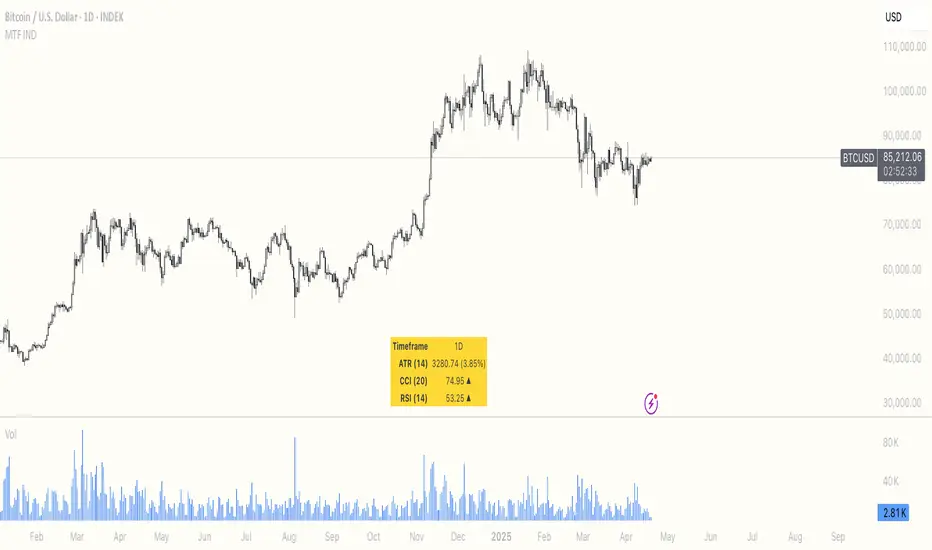
Multi Timeframe ATR, CCI & RSIMulti Timeframe ATR, CCI & RSI (MTF IND)
This indicator displays ATR, CCI, and RSI values from a custom selected timeframe in a clean table overlay.
It helps monitor volatility and momentum from higher/lower timeframes directly on your current chart.
Features:
• Select custom timeframe for all indicators (e.g., 1D, 1W, 65m, etc.)
• ATR with selectable smoothing type (RMA, SMA, EMA, WMA)
• CCI & RSI with trend arrows (▲ rising, ▼ falling, ▬ neutral)
• Compact summary table
Wyszukaj w skryptach "CCI"
Buy Only Strategy with Dynamic Re-Entry and ExitThe strategy aims to create a simple buy-only trading system based on moving average crossovers and the Weekly Commodity Channel Index (CCI) or Weekly Average Directional Index (ADX). It generates buy signals when the fast-moving average crosses above the slow-moving average and when the Weekly CCI and or Weekly ADX meet the specified conditions.
The strategy also allows for dynamic re-entry, which means it can open new long positions if the price goes above the three moving averages after an exit. However, the strategy will exit the long position if the price closes below the third moving average.
ENTRY CONDITIONS
The script defines the conditions for generating buy signals. It checks for two conditions for a valid buy signal:
• If the fast-moving average crosses above the slow-moving average -THERE IS Dynamic Re-Entry also
• If the user chooses HE OR SHE CAN FILTER TRADES BY USING CCI OR ADX
Dynamic Re-Entry:
the script allows for dynamic re-entry. If there is no active long position and the price is above all three moving averages a new long position is opened.
Exit Conditions
The script defines the exit condition for closing a long position. If the price closes below the third moving average, the script closes the long position.
IMPORTANT NOTICE
ONLY DAILY TIME FRAME
THERE WOULD BE WHIPSAW USE YOUR OWN ACCUMEN TO MINIMISE THEM
ITS ONLY BUY STRATEGY
EXIT CAN BE STRATEGY BASED OR SET PROFIT AND TARGETS AS PER RISK APETITE /RISK MANAGEMENT
DONT TRADE OPTIONS ON THIS
SUITABLE FOR STOCKS OF USA AND INDIAN MARKETS
ALWAYS REMEMBER TO DO YOUR OWN RESEARCH BEFORE TRADING AND INVESTING

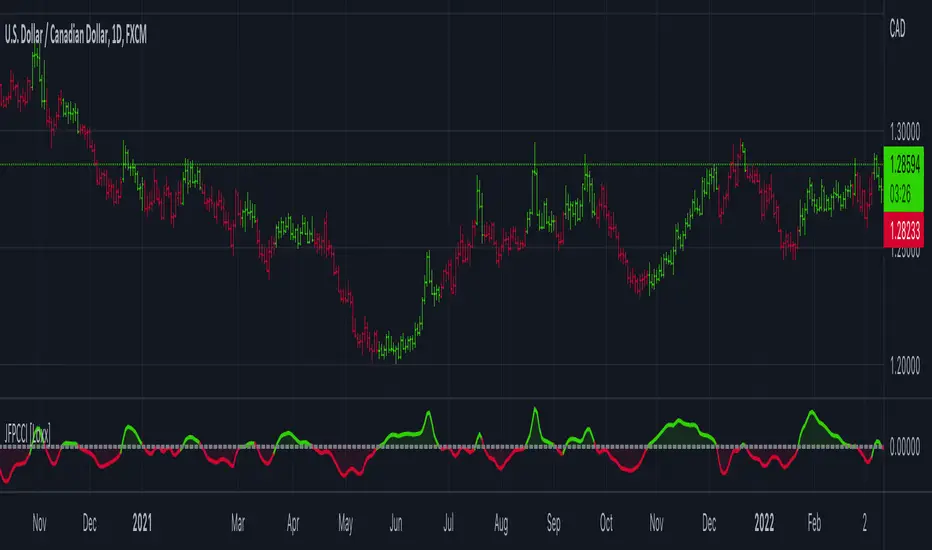
Jurik Filtered Perfect CCI (PCCI) [Loxx]Jurik Filtered Perfect CCI (PCCI) is a faster and more accurate version of CCI with Jurik Filtering.
What is the PCCI (Perfect Commodity Channel Index)?
PCCI (Perfect Commodity Channel Index) indicator is calculated by the following formula:
PCCI(bar) = close(bar) – DF(bar)
PCCI resembles D. Lambert's Commodity Channel Index by the method of its calculation.
Actually, CCI index is calculated as a normalized difference between the current price and its moving average. PCCI is calculated as a difference between a day closing price and its statistical expectation presented by a Digital Fitler value. Therefore, PCCI is more efficient than CCI.
PCCI index is a high frequency part of the exchange rate fluctuations normalized according to its standard deviation.
What is Jurik Volty used in the Juirk Filter?
One of the lesser known qualities of Juirk smoothing is that the Jurik smoothing process is adaptive. "Jurik Volty" (a sort of market volatility ) is what makes Jurik smoothing adaptive. The Jurik Volty calculation can be used as both a standalone indicator and to smooth other indicators that you wish to make adaptive.
What is the Jurik Moving Average?
Have you noticed how moving averages add some lag (delay) to your signals? ... especially when price gaps up or down in a big move, and you are waiting for your moving average to catch up? Wait no more! JMA eliminates this problem forever and gives you the best of both worlds: low lag and smooth lines.
Ideally, you would like a filtered signal to be both smooth and lag-free. Lag causes delays in your trades, and increasing lag in your indicators typically result in lower profits. In other words, late comers get what's left on the table after the feast has already begun.
Included:
-Bar coloring
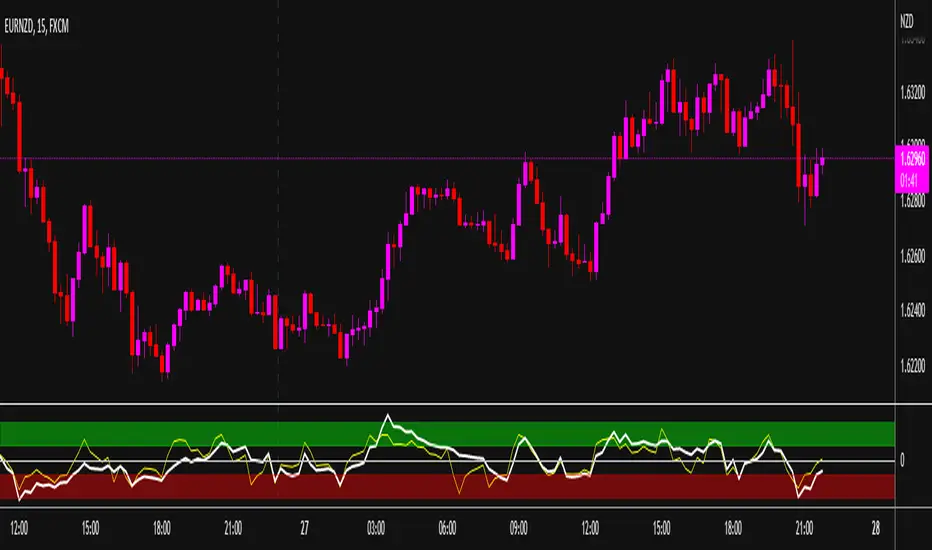
SuperJump Edge CCI RSIThis indicator for detecting inflection points of CCI and RSI.
Low time frames have high variability, which can lead to more unreliable signals.
But you can filter it appropriately by entering the levels of oversold and overbought.
Because CCI is highly volatile, RSI signals are more reliable.
You can also use it for other panes for example RSI or CCI pane.
Repainting is not used because I implemented the filter by myself.

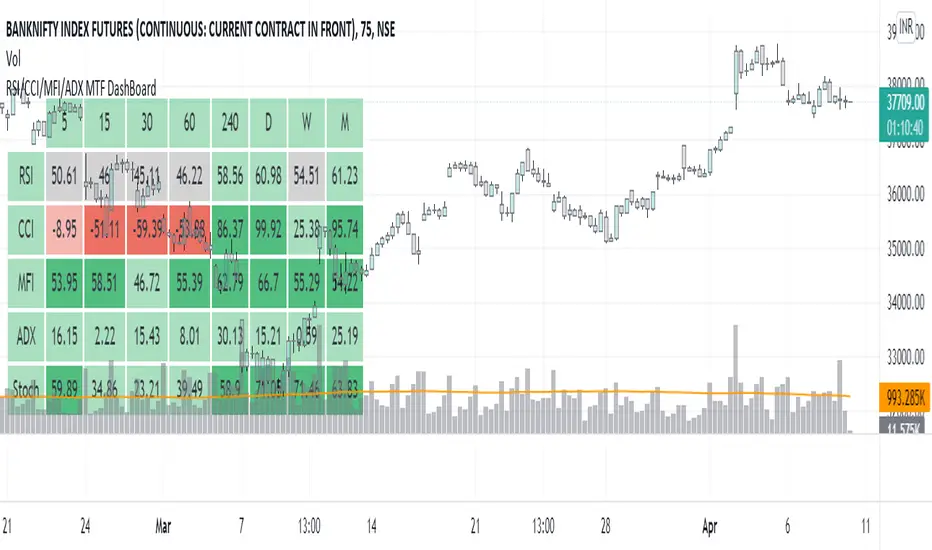
RSI/CCI/MFI/ADX/Stoch MTF DashBoardGauge Sentiment across timeframe for various indicators in single dashboard.
RSI - to get the idea about relative price strength across all TFs.
CCI /ADX- to get idea about power and strength in trend across all TFs.
MFI- gives idea whether trend is supported by volume or not across all TFs.
with this dashboard , you will get complete sentiment of market on your screen whether you use lower to upper TF or upper to lower TF approach. you can see market behavior and sentiment with these all in one dashboard across all TFs.
Better use this with MA or vwap to get trend direction.
Added feature to change location of dashboard on chart, now you can place it on top left, top right, bottom left, bottom right corner of chart as per your comfort.
2. Added ability to hide/show for all TFs.
Now you can on/off , 5min, 15 min, 30 min, 60 min, 4 hour, daily ,weekly and monthly TF column if you do not use it. you can keep and work with TFs as per your comfort and liking.
3. Added feature to hide/show indicators, MFI, CCI, ADX.
Now you can on/off indicator s MFI, CCI and ADX if you don't need them on dashboard as per your need.
Made dashboard cell width and height auto adjusted, so that it values can be visible fully on TV app on mobile too.
Hope it provides a better visual experience to read data on dashboard.
4. Added Stochastic as indicator to dashboard. STOCH is a range bound momentum oscillator. It is designed to display the location of the close compared to the high/low range over a user defined number of periods. You can use STOCH for Identifying overbought and oversold levels and also for identifying bull and bear set ups or signals across all TFs.
Hope IT helps to take better trading decisions.
StochRSI x RSI x CCI x EMAsWanted to put this out there. Kind of a rough explanation but basically I wanted to build an indicator that takes out emotions and is easy to read. The indicator is basically RSI, stochRSI, CCI, and EMAs into an easy to read package. The traffic lights at the end will tell you if stochRSI/RSI and price action above according to EMA ribbon are in agreement. RSI with a period of 2 also always seemed very useful to me but it was just extremely distracting to look at it. I tried to make many rules in this indicator to find as much confluence between RSI, stochRSI, CCI, and EMAs to help you make better decisions. What is shown on the indicator is not necessarily a buy/sell signal. It should be seen as a way to view strength of price and possible momentum changes.
I find that one of the biggest distractions of indicators is taking your eyes off what is really happening at the chart above. This indicator uses popular and well used tools and helps you to get an easier visual of what is happening.
Purple lines at top and bottom: Short RSI ob/os
Red/orange and blue/green lines at top and bottom: When stochRSI kd and CCI also crosses +/- 100 or 200
Blue background: when stochRSI k > d and short RSI crosses above 30
Red background: when stochRSI k < d and short RSI crosses below 70
Green crosses: StochRSI is above 80 and making higher highs
Red X crosses: StochRSI is below 20 and making lower lows
Red/green fill of stochRSI and purple/blue dots on RSI: When short RSI and stochRSI are both ob/os
Red/green fill of RSI: Green when Long rsi > 50, red when Long rsi < 50
60/40 lines: Possible support/resistance for RSI
Traffic lights
1st light: Long RSI > EMA and stoch RSI k>d or vice versa
2nd light: Price above EMA 1 and 2 or vice versa
3rd light: when lights 1 and 2 are in agreement
Hope you enjoy!

TSI CCI Hull with profit$$$$ , Alert versionThis is a modified version of @SeaSide420 TSI CCI Hull with profits exit on long and short order with alert as well
original script :
the strategy script:
/// feel free to edit/improve and comment

BEST Supertrend CCIHello traders
Today I present you a Supertrend not based on candle close but based on a CCI (Commodity Channel Index)
How does it work?
Bull event: CCI crossing over the 0 line
Bear event: CCI crossing below the 0 line
When the event is triggered, the script will plot the Supertrend as follow
UP Trend = High + ATR * Factor
DOWN Trend = Low - ATR * Factor
This is an alternative of the classical Supertrend based on candle close being above/beyond the previous Supertrend level.
Hope you'll enjoy it and it will improve your trading making you a better trader
Dave

Stochastic CCI BF 🚀Simply a Stochastic RSI and CCI mix with a Rate of Change filter to stay out of choppy sideways markets.
SIGNALS
For a long signal we need both the CCI above 0 and the stochastic line to be higher than the last candle.
For a short signal we need both the CCI below 0 and the stochastic line to be lower than the last candle.
INSTRUCTIONS
Pay attention to the background color.
Green = go long
Red = go short
White = no trade
RISK
We use a simple 3% stop loss.
If we get stopped out, we wait for the next signal before re-entering.
Tested on XBTUSD BitMex Daily chart.

Enhanced Commodity Channel Index(CCI) Cycle Indicator - MTFThis is a heavily modified and enhanced version of CCI Cycle and my first indicator released using Pine Script version 4.0, something I contributed to often in a small role, and will continue to do, in my free time. This indicator is highly reactive and does a magnificent job of identifying fluctuations in market cycles when they are not trending. Compared to my free "Enhanced Schaff Trend Cycle Indicator" presented above along side this indicator, CCI Cycle is superior in it's own way, but a superb companion for providing a more accurate signals analysis. I packed as much tech as I could into this indicator along with astounding color and agility, and I'm unsure if there is any room for major improvements in the near future.
Features List Includes:
I.P.O.C.S.(Initial Public Offering Clean Start) Technology - plotting from day one, minute one of IPO
Fully adjustable M.T.F. ( Multiple Time Frame ) is enable/disable capable
Enable/disable dark background for enhanced visibility
"Source" Selection
Multiple CCI Cycle adjustments
Moving average selection
Ranges and thresholds are enable/disable capable
Upper threshold adjustment
Red/green secondary range that adjusts +/- from the upper/lower thresholds
Lower threshold adjustment
Adjustable centered medial zone
Highlighting is enable/disable capable
Normalized zero mean to +/-1
This is not a freely available indicator, FYI. To witness my Pine poetry in action, properly negotiated requests for unlimited access, per indicator, may ONLY be obtained by direct contact with me using TV's "Private Chats" or by "Message" in my member name above. The comments section below is solely just for commenting and other remarks, ideas, compliments, etc... If you do have any questions or comments regarding this indicator, I will consider your inquiries, thoughts, and ideas presented below in the comments section, when time provides it. As always, "Like" it if you like it, and also return to my scripts list occasionally for additional postings. Have a profitable future everyone!

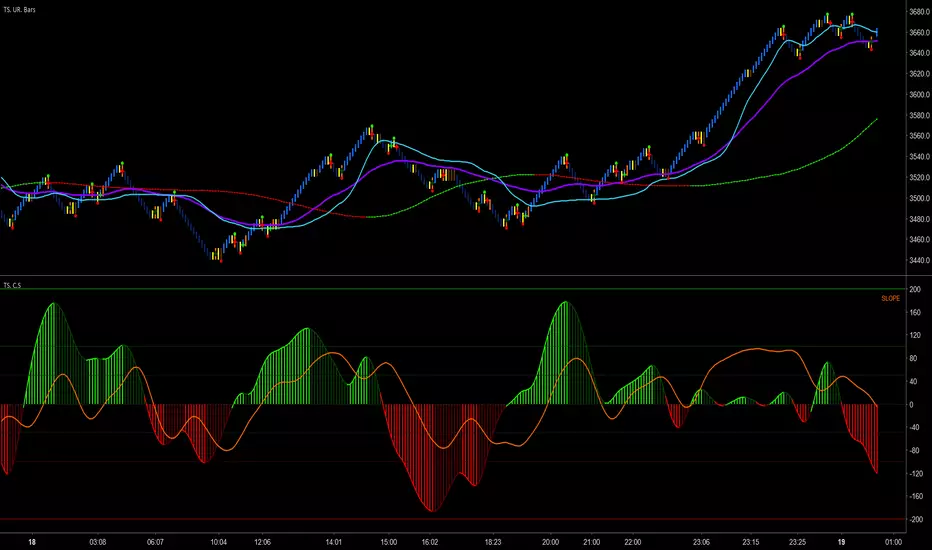
Trader Set - CCI Slope ComboThis is an oscillator that I was doing R&D for developing it, it took near three weeks. If you ever use Super CCI and keep it side by side with slope oscillator, in more than few cases, day in day out, you would find that both of them show similarities. These similarities suggest that there should be a way to combine these two and get a unique indicator that would do both jobs at the same time without the complexity of CCI and WITH simplicity of Slope!
The answer for the R&D was in ehlers books. Well, not the formulas he gave to the world but the concept! Here is a combination behavior of CCI and Slope, if you ever drop ehlers Universal Oscillator near this, you would see where the concept came but they are totally different in look and behavior.
Please don't contact me for access. This is part of my personal methodology that I teach to my students and soon, the English section of my website will be ready with English course for the methodology. When the course is ready I will announce it under every related indicator and those who participate will have access to these indicators.
Rsi/Cci Overbought Oversold CandlesThis indicator will allow you to see overbought and oversold areas of the rsi or the cci, you must set yourself the upper and lower band of the rsi (70-30) or cci (100, -100). By default, it's Rsi
I have already posted the same indicator but only with the Rsi, I wanted to posted a more complete that offers the 2.
On the chart, it is the overbought / oversold area of the Cci that is displayed

RSI + Stoch RSI + CCI [PrimeTrading]RSI + Stoch RSI + CCI alerts overlay (3 in one)
Blue alert = CCI crossover bullish
Red Alert = CCI crossover Bearish
-----
How to use it?
You can compare the alerts with RSI and Stoch RSI conditions to see if its reliable, check my vertical lines on the chart
Feel free to contact me anytime, good luck!
PrimeTrading

2TF CCI 5_30minTHIS INDICATOR WILL SHOW CCI(8), CCI(34) of 5 minutes on 5 minutes TF CHART ALONG WITH 30MIN CCI ON SAME TF i.e 5 minutes.IT WILL NOT OVERLAY ON CHART & WILL OPEN IN A SEPARATE WINDOW , SAVING EFFORT TO DO THE FUNCTION UNMERGED DOWN. +100 (GREEN) & -100(RED) LINE HAS BEEN ADDED BY DEFAULT WITH HIGHLIGHTED AREA BETWEEN +100 & -100 LINES .

Rational CCIThe Rational CCI uses a variety of mechanisms to signal potential long / short entries, both on the long and short time frames.
Bullish crosses (typically buys) are encountered when the CCI crosses the EMA, and is in the Bearish/Oversold territory. Typically, one should aim to go long when there is both a bullish cross, as well as bullish divergence (higher low on the indicator, with equal to lower price).
This indicator also works great for detecting valid FOMO buys vs. getting in when there is not much juice left to squeeze. When there is a strong bullish move encountered that does not have a bearish crossover immediately preceeding it, these are considered strong breakout/momentum buys.
Bearish crosses (typically exits/shorts) are encountered when the CCI crosses down under the EMA and is in the Bullish/Overbought territory. Similar with the long entries, one should aim to exit long, or enter in a short when there is both a bearish cross, as well as bearish divergence (lower high on the indicator, with equal to higher price).
Lastly, similar to highly bullish breakouts/momentum peaks, strong bearish momentum is detected when there is a strong bearish movement that does not have a strong bullish move and/or bullish cross immediately before it.
On higher resolution time frames, the trading strategy is nearly the same -- however as mentioned before, it works best when there is both a signal + divergence.
While effective buy itself, I highly recommend employing this indicator in conjunction with your other favorites. I find it to work best with GodMode, LazyBear WaveTrend, and Willy's%R. If anything, this is a great indicator to use as confirmation when other indicators may be contradicting one another.

Indicator: CCI coded OBVOBV is colored green if CCI > threshold, red if CCI < threshold.
Both "threshold" and "CCI Length" can be customized using the options page.
Indicator also displays a 13EMA (length can be changed) over OBV.

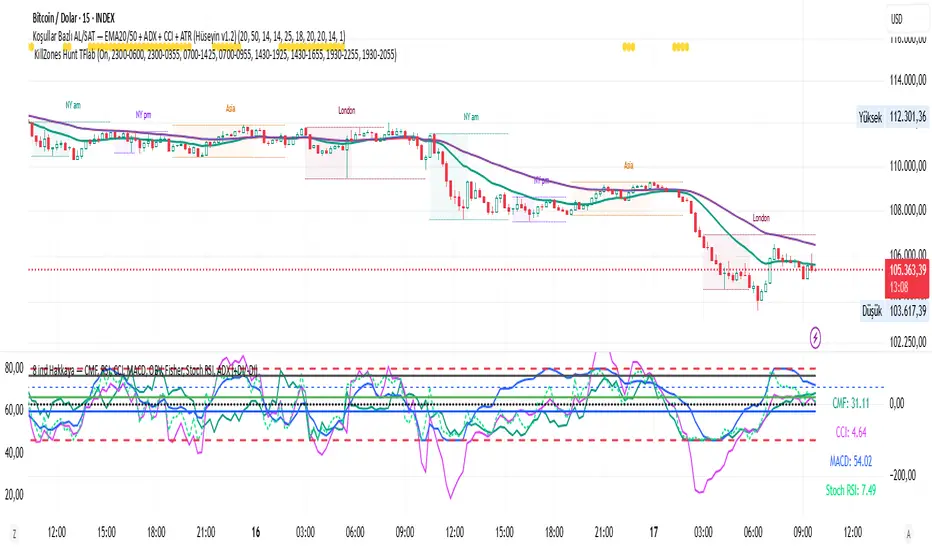
CMF, RSI, CCI, MACD, OBV, Fisher, Stoch RSI, ADX (+DI/-DI)
Stoch RSINine indicators in one, CMF, RSI, CCI, MACD, OBV, Fisher, Stoch RSI, ADX (+DI/-DI) You can use whichever of the nine indicators you want. I use CFM, CCI, MACD, Stoch RSI.
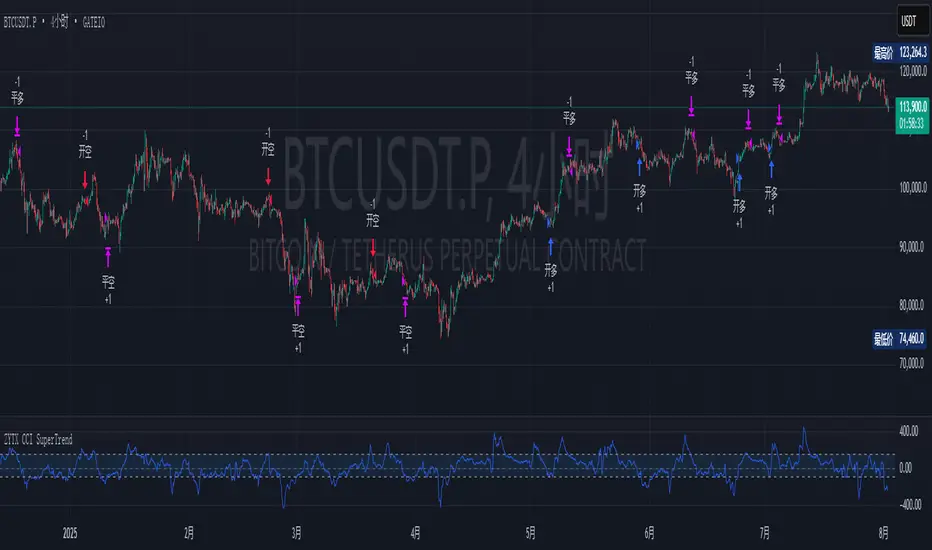
ZYTX CCI SuperTrendZYTX CCI SuperTrend
The definitive integration of CCI and SuperTrend trend-following indicators, delivering exemplary performance in automated trading bots.
MomentumSignal Kit RSI-MACD-ADX-CCI-CMF-TSI-EStoch// ----------------------------------------
// Description:
// ----------------------------------------
// MomentumKit RSI/MACD-ADX-CCI-CMF-TSI-EStoch Suite is a comprehensive momentum indicator suite designed to provide robust buy and sell signals through the consensus of multiple normalized momentum indicators. This suite integrates the following indicators:
// - **Relative Strength Index (RSI)**
// - **Stochastic RSI**
// - **Moving Average Convergence Divergence (MACD)** with enhanced logic
// - **True Strength Index (TSI)**
// - **Commodity Channel Index (CCI)**
// - **Chaikin Money Flow (CMF)**
// - **Average Directional Index (ADX)**
// - **Ehlers' Stochastic**
//
// **Key Features:**
// 1. **Normalization:** Each indicator is normalized to a consistent scale, facilitating easier comparison and interpretation across different momentum metrics. This uniform scaling allows traders to seamlessly analyze multiple indicators simultaneously without the confusion of differing value ranges.
//
// 2. **Consensus-Based Signals:** By combining multiple indicators, MomentumKit generates buy and sell signals based on the agreement among various momentum measurements. This multi-indicator consensus approach enhances signal reliability and reduces the likelihood of false positives.
//
// 3. **Overlap Analysis:** The normalization process aids in identifying overlapping signals, where multiple indicators point towards a potential change in price or momentum. Such overlaps are strong indicators of significant market movements, providing traders with timely and actionable insights.
//
// 4. **Enhanced Logic for MACD:** The MACD component within MomentumKit utilizes enhanced logic to improve its responsiveness and accuracy in detecting trend changes.
//
// 5. **Debugging Features:** MomentumKit includes advanced debugging tools that display individual buy and sell signals generated by each indicator. These features are intended for users with technical and programming skills, allowing them to:
// - **Visualize Signal Generation:** See real-time buy and sell signals for each integrated indicator directly on the chart.
// - **Adjust Signal Thresholds:** Modify the criteria for what constitutes a buy or sell signal for each indicator, enabling tailored analysis based on specific trading strategies.
// - **Filter and Manipulate Signals:** Enable or disable specific indicators' contributions to the overall buy and sell signals, providing flexibility in signal generation.
// - **Monitor Indicator Behavior:** Utilize debug plots and labels to understand how each indicator reacts to market movements, aiding in strategy optimization.
//
// **Work in Progress:**
// MomentumKit is continuously evolving, with ongoing enhancements to its algorithms and user interface. Current debugging features are designed to offer deep insights for technically adept users, allowing for extensive customization and fine-tuning. Future updates aim to introduce more user-friendly interfaces and automated optimization tools to cater to a broader audience.
//
// **Usage Instructions:**
// - **Visibility Controls:** Users can toggle the visibility of individual indicators to focus on specific momentum metrics as needed.
// - **Parameter Adjustments:** Each indicator comes with customizable parameters, allowing traders to fine-tune the suite according to their trading strategies and market conditions.
// - **Debugging Features:** Enable the debugging mode to visualize individual indicator signals and adjust their contribution to the overall buy/sell signals. This requires a basic understanding of the underlying indicators and their operational thresholds.
//
// **Benefits:**
// - **Simplified Analysis:** Normalization simplifies the process of analyzing multiple indicators, making it easier to identify consistent signals across different momentum measurements.
// - **Improved Decision-Making:** Consensus-based signals backed by multiple normalized indicators provide a higher level of confidence in trading decisions.
// - **Versatility:** Suitable for various trading styles and market conditions, MomentumKit offers a versatile toolset for both novice and experienced traders.
//
// **Technical Requirements:**
// - **Programming Knowledge:** To fully leverage the debugging and signal manipulation features, users should possess a foundational understanding of Pine Script and the mechanics of momentum indicators.
// - **Customization Skills:** Ability to adjust indicator parameters and debug filters to align with specific trading strategies.
//
// **Disclaimer:**
// This indicator suite is intended for educational and analytical purposes only and does not constitute financial advice. Trading involves significant risk, and past performance is not indicative of future results. Always conduct your own analysis or consult a qualified financial advisor before making trading decisions.

Combo 2/20 EMA & CCI
This is another part of my research work, where I test a combination of two strategies, receiving a combined signal. In order to understand which indicator combinations work better, which work worse, as filters for trades. This is combo strategies for get a cumulative signal.
First strategy
This indicator plots 2/20 exponential moving average. For the Mov Avg X 2/20 Indicator, the EMA bar will be painted when the Alert criteria is met.
Second strategy
The Commodity Channel Index (CCI) is best used with markets that display cyclical or seasonal characteristics, and is formulated to detect the beginning and ending of the cycles by incorporating a moving average together with a divisor that reflects both possible and actual trading ranges. The final index measures the deviation from normal, which indicates major changes in market trend.
Strategy tester settings:
Initial capital: 1000
Order size: 0.5
Commission: 0.1%
Other as default.
Indicator settings:
EMA Length: 50
CCI Length: 10
Fast MA Length: 15
Slow MA Length: 20
Other as default.
WARNING:
- For purpose educate only
- This script to change bars colors.

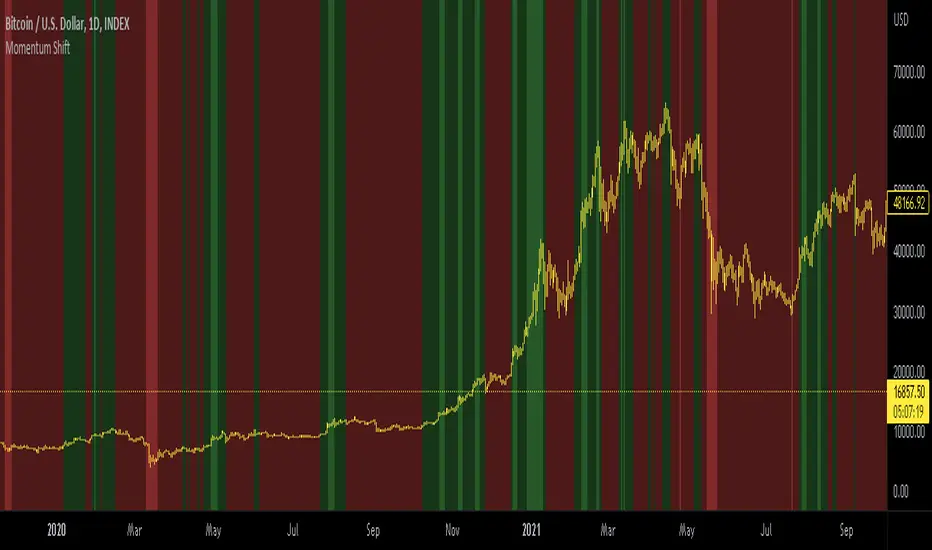
Momentum shift CCI, MACD, RSI, AligatorIndicator for BTC only.
This indicator combines CCI MACD RSI AND William's alligator.
Bullish macd cross, RSI over 50, bullish William cross and positive CCI result in green background. Otherwise red background is displayed.
For better visibility extreme values can be displayed with greater color saturation. 1D BTCUSD is best with default values.
For other TFs Bull side and bear side values can be tweaked.
For bright red we may assume price to be `greatly oversold.
For bright green we may seek some profit taking.
CFB-Adaptive CCI w/ T3 Smoothing [Loxx]CFB-Adaptive CCI w/ T3 Smoothing is a CCI indicator with adaptive period inputs and T3 smoothing. Jurik's Composite Fractal Behavior is used to created dynamic period input.
What is Composite Fractal Behavior ( CFB )?
All around you mechanisms adjust themselves to their environment. From simple thermostats that react to air temperature to computer chips in modern cars that respond to changes in engine temperature, r.p.m.'s, torque, and throttle position. It was only a matter of time before fast desktop computers applied the mathematics of self-adjustment to systems that trade the financial markets.
Unlike basic systems with fixed formulas, an adaptive system adjusts its own equations. For example, start with a basic channel breakout system that uses the highest closing price of the last N bars as a threshold for detecting breakouts on the up side. An adaptive and improved version of this system would adjust N according to market conditions, such as momentum, price volatility or acceleration.
Since many systems are based directly or indirectly on cycles, another useful measure of market condition is the periodic length of a price chart's dominant cycle, (DC), that cycle with the greatest influence on price action.
The utility of this new DC measure was noted by author Murray Ruggiero in the January '96 issue of Futures Magazine. In it. Mr. Ruggiero used it to adaptive adjust the value of N in a channel breakout system. He then simulated trading 15 years of D-Mark futures in order to compare its performance to a similar system that had a fixed optimal value of N. The adaptive version produced 20% more profit!
This DC index utilized the popular MESA algorithm (a formulation by John Ehlers adapted from Burg's maximum entropy algorithm, MEM). Unfortunately, the DC approach is problematic when the market has no real dominant cycle momentum, because the mathematics will produce a value whether or not one actually exists! Therefore, we developed a proprietary indicator that does not presuppose the presence of market cycles. It's called CFB (Composite Fractal Behavior) and it works well whether or not the market is cyclic.
CFB examines price action for a particular fractal pattern, categorizes them by size, and then outputs a composite fractal size index. This index is smooth, timely and accurate
Essentially, CFB reveals the length of the market's trending action time frame. Long trending activity produces a large CFB index and short choppy action produces a small index value. Investors have found many applications for CFB which involve scaling other existing technical indicators adaptively, on a bar-to-bar basis.
What is Jurik Volty used in the Juirk Filter?
One of the lesser known qualities of Juirk smoothing is that the Jurik smoothing process is adaptive. "Jurik Volty" (a sort of market volatility ) is what makes Jurik smoothing adaptive. The Jurik Volty calculation can be used as both a standalone indicator and to smooth other indicators that you wish to make adaptive.
What is the Jurik Moving Average?
Have you noticed how moving averages add some lag (delay) to your signals? ... especially when price gaps up or down in a big move, and you are waiting for your moving average to catch up? Wait no more! JMA eliminates this problem forever and gives you the best of both worlds: low lag and smooth lines.
Ideally, you would like a filtered signal to be both smooth and lag-free. Lag causes delays in your trades, and increasing lag in your indicators typically result in lower profits. In other words, late comers get what's left on the table after the feast has already begun.
What is the T3 moving average?
Better Moving Averages Tim Tillson
November 1, 1998
Tim Tillson is a software project manager at Hewlett-Packard, with degrees in Mathematics and Computer Science. He has privately traded options and equities for 15 years.
Introduction
"Digital filtering includes the process of smoothing, predicting, differentiating, integrating, separation of signals, and removal of noise from a signal. Thus many people who do such things are actually using digital filters without realizing that they are; being unacquainted with the theory, they neither understand what they have done nor the possibilities of what they might have done."
This quote from R. W. Hamming applies to the vast majority of indicators in technical analysis . Moving averages, be they simple, weighted, or exponential, are lowpass filters; low frequency components in the signal pass through with little attenuation, while high frequencies are severely reduced.
"Oscillator" type indicators (such as MACD , Momentum, Relative Strength Index ) are another type of digital filter called a differentiator.
Tushar Chande has observed that many popular oscillators are highly correlated, which is sensible because they are trying to measure the rate of change of the underlying time series, i.e., are trying to be the first and second derivatives we all learned about in Calculus.
We use moving averages (lowpass filters) in technical analysis to remove the random noise from a time series, to discern the underlying trend or to determine prices at which we will take action. A perfect moving average would have two attributes:
It would be smooth, not sensitive to random noise in the underlying time series. Another way of saying this is that its derivative would not spuriously alternate between positive and negative values.
It would not lag behind the time series it is computed from. Lag, of course, produces late buy or sell signals that kill profits.
The only way one can compute a perfect moving average is to have knowledge of the future, and if we had that, we would buy one lottery ticket a week rather than trade!
Having said this, we can still improve on the conventional simple, weighted, or exponential moving averages. Here's how:
Two Interesting Moving Averages
We will examine two benchmark moving averages based on Linear Regression analysis.
In both cases, a Linear Regression line of length n is fitted to price data.
I call the first moving average ILRS, which stands for Integral of Linear Regression Slope. One simply integrates the slope of a linear regression line as it is successively fitted in a moving window of length n across the data, with the constant of integration being a simple moving average of the first n points. Put another way, the derivative of ILRS is the linear regression slope. Note that ILRS is not the same as a SMA ( simple moving average ) of length n, which is actually the midpoint of the linear regression line as it moves across the data.
We can measure the lag of moving averages with respect to a linear trend by computing how they behave when the input is a line with unit slope. Both SMA (n) and ILRS(n) have lag of n/2, but ILRS is much smoother than SMA .
Our second benchmark moving average is well known, called EPMA or End Point Moving Average. It is the endpoint of the linear regression line of length n as it is fitted across the data. EPMA hugs the data more closely than a simple or exponential moving average of the same length. The price we pay for this is that it is much noisier (less smooth) than ILRS, and it also has the annoying property that it overshoots the data when linear trends are present.
However, EPMA has a lag of 0 with respect to linear input! This makes sense because a linear regression line will fit linear input perfectly, and the endpoint of the LR line will be on the input line.
These two moving averages frame the tradeoffs that we are facing. On one extreme we have ILRS, which is very smooth and has considerable phase lag. EPMA has 0 phase lag, but is too noisy and overshoots. We would like to construct a better moving average which is as smooth as ILRS, but runs closer to where EPMA lies, without the overshoot.
A easy way to attempt this is to split the difference, i.e. use (ILRS(n)+EPMA(n))/2. This will give us a moving average (call it IE /2) which runs in between the two, has phase lag of n/4 but still inherits considerable noise from EPMA. IE /2 is inspirational, however. Can we build something that is comparable, but smoother? Figure 1 shows ILRS, EPMA, and IE /2.
Filter Techniques
Any thoughtful student of filter theory (or resolute experimenter) will have noticed that you can improve the smoothness of a filter by running it through itself multiple times, at the cost of increasing phase lag.
There is a complementary technique (called twicing by J.W. Tukey) which can be used to improve phase lag. If L stands for the operation of running data through a low pass filter, then twicing can be described by:
L' = L(time series) + L(time series - L(time series))
That is, we add a moving average of the difference between the input and the moving average to the moving average. This is algebraically equivalent to:
2L-L(L)
This is the Double Exponential Moving Average or DEMA , popularized by Patrick Mulloy in TASAC (January/February 1994).
In our taxonomy, DEMA has some phase lag (although it exponentially approaches 0) and is somewhat noisy, comparable to IE /2 indicator.
We will use these two techniques to construct our better moving average, after we explore the first one a little more closely.
Fixing Overshoot
An n-day EMA has smoothing constant alpha=2/(n+1) and a lag of (n-1)/2.
Thus EMA (3) has lag 1, and EMA (11) has lag 5. Figure 2 shows that, if I am willing to incur 5 days of lag, I get a smoother moving average if I run EMA (3) through itself 5 times than if I just take EMA (11) once.
This suggests that if EPMA and DEMA have 0 or low lag, why not run fast versions (eg DEMA (3)) through themselves many times to achieve a smooth result? The problem is that multiple runs though these filters increase their tendency to overshoot the data, giving an unusable result. This is because the amplitude response of DEMA and EPMA is greater than 1 at certain frequencies, giving a gain of much greater than 1 at these frequencies when run though themselves multiple times. Figure 3 shows DEMA (7) and EPMA(7) run through themselves 3 times. DEMA^3 has serious overshoot, and EPMA^3 is terrible.
The solution to the overshoot problem is to recall what we are doing with twicing:
DEMA (n) = EMA (n) + EMA (time series - EMA (n))
The second term is adding, in effect, a smooth version of the derivative to the EMA to achieve DEMA . The derivative term determines how hot the moving average's response to linear trends will be. We need to simply turn down the volume to achieve our basic building block:
EMA (n) + EMA (time series - EMA (n))*.7;
This is algebraically the same as:
EMA (n)*1.7-EMA( EMA (n))*.7;
I have chosen .7 as my volume factor, but the general formula (which I call "Generalized Dema") is:
GD (n,v) = EMA (n)*(1+v)-EMA( EMA (n))*v,
Where v ranges between 0 and 1. When v=0, GD is just an EMA , and when v=1, GD is DEMA . In between, GD is a cooler DEMA . By using a value for v less than 1 (I like .7), we cure the multiple DEMA overshoot problem, at the cost of accepting some additional phase delay. Now we can run GD through itself multiple times to define a new, smoother moving average T3 that does not overshoot the data:
T3(n) = GD ( GD ( GD (n)))
In filter theory parlance, T3 is a six-pole non-linear Kalman filter. Kalman filters are ones which use the error (in this case (time series - EMA (n)) to correct themselves. In Technical Analysis , these are called Adaptive Moving Averages; they track the time series more aggressively when it is making large moves.
Included:
Bar coloring
Signals
Alerts

Double CCIWith this variant of the CCI indicator you have 2 CCIs. I call it convenience the fast and the slow.
The slow one has the default period of 20. The fast one has a lower value and will therefore also change his direction much faster.
I don't use this as a decisive indicator, but the fast one does indicate where the standard CCI might go and so you are already prepared for the decisive moment.
I've added a zero line so you can visually track whether the buyers or the sellers are predominant.
Between 0 and +100, as well as between 0 and -100 there is still a battle between buyers and sellers and it is better to wait a little longer before entering a trade.
From +100 to +250 I have colored the zone green; here the buyers are winning and it is a confirmation that you can safer enter the BUY.
From -100 to -250 it's colored red; here the sellers are firmly winning and it is a confirmation to go into a SELL.
Most values are adjustable via the settings and can be switched on or off.
This indicator is not intended to be used as the sole decision element, but rather to fine-tune your entry and exit points . Maybe wait a little longer than you normally would, but then be able to step in at the right time that there is enough volume in your desired direction.
Good luck with it and I would love feedback.
Thank you Tradingview-community.