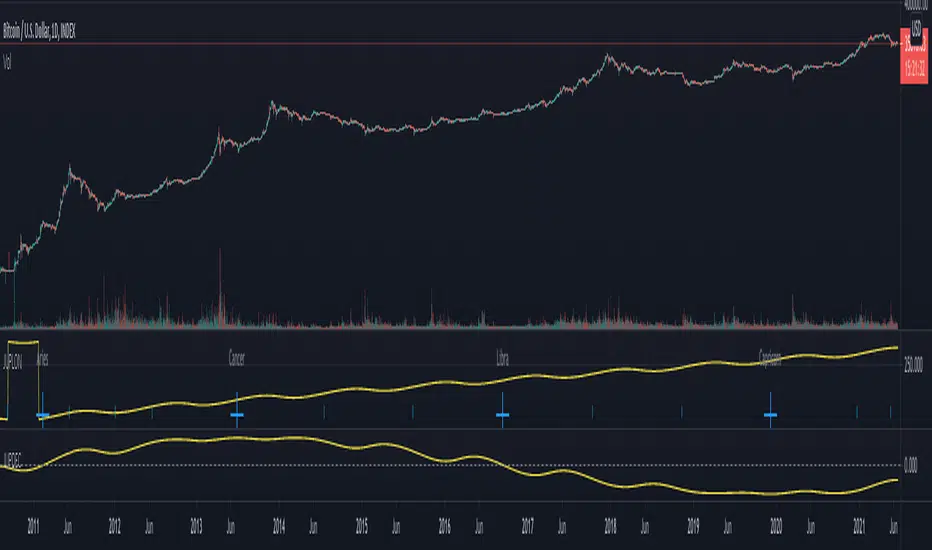
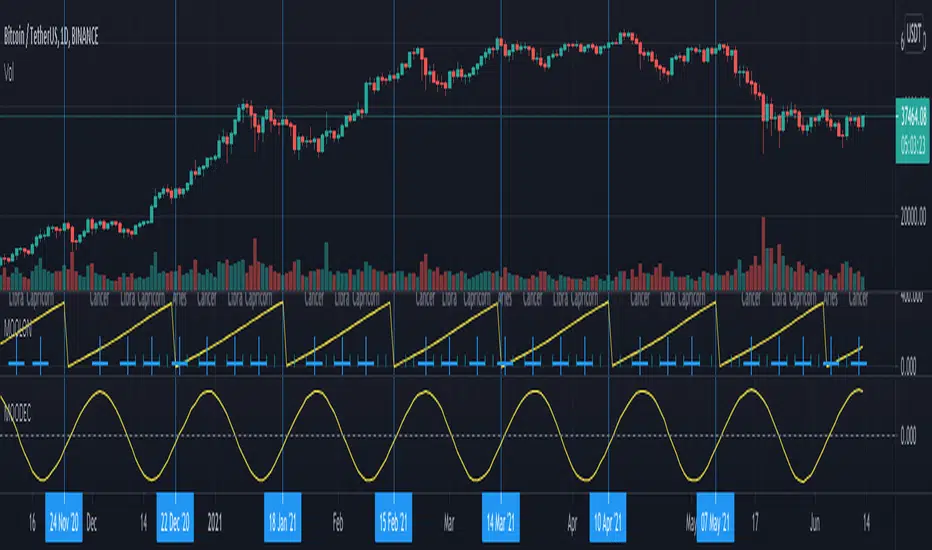
Financial Astrology Sun SpeedSun speed from geocentric view represents the apparent daily move (in degrees) of the Sun through the Zodiac wheel, we know well that is the Earth which is moving and this Sun dance through the tropical Zodiac is just apparent. The maximum speed 1.02 degrees per day is reached at the perihelion (closest to Sun) which occurs in January at the zodiac sign of Capricorn, the minimum speed is 0.97 at aphelion (further to Sun) and occurs at July at the sign of Cancer. The speed is inversely correlated to the Sun declination so at the maximum value in North declination we get the minimum value in speed and viceversa.
Is interesting to note that at the speed maxima, minima or exact average (that coincide with the start of the different Earth seasons) we can identify some of the most relevant top and bottoms in BTCUSD. Is said that "gold" metal is ruled by the Sun so would be great to analyse if there is a relevant correlation of top and bottoms in GLD market with in speed extreme value, I will leave this as homework to some of the amazing astro traders that do research with Trading View charts.
Note: The Sun speed indicator is based on an ephemeris array that covers years 2010 to 2030, prior or after this years the speed is not available, this daily ephemeris are based on UTC time so in order to align properly with the price bars times you should set UTC as your chart timezone.
Wyszukaj w skryptach "2010年+黄金价格+历史数据"

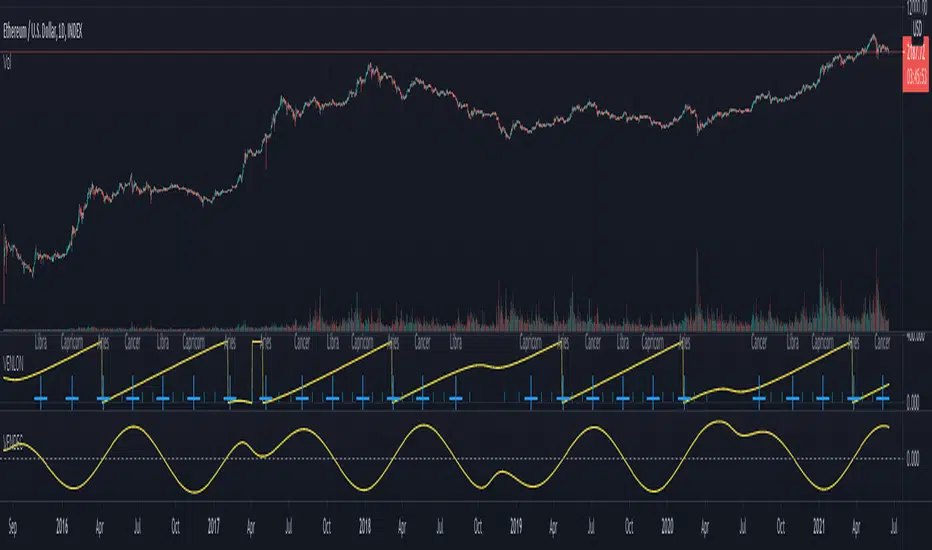
Financial Astrology Venus SpeedVenus speed phases (stationary and retrograde) are essential to determine a market corrections or consolidation periods, we can see that for BTCUSD, in the majority of the historical occurrences, when Venus speed decelerated, a price dip or consolidation period formed. Once the Venus average speed resumed, there was a continuation of the main trend. When the speed deceleration coincide with Venus in South declination (observe the Venus Declination indicator), the corrections was more intense, however, we don't have enough past observations to determine if this astro setup is significant we will keep watching future occurrences to confirm.
Note: The Venus speed indicator is based on an ephemeris array that covers years 2010 to 2030, prior or after this years the speed is not available, this daily ephemeris are based on UTC time so in order to align properly with the price bars times you should set UTC as your chart timezone.

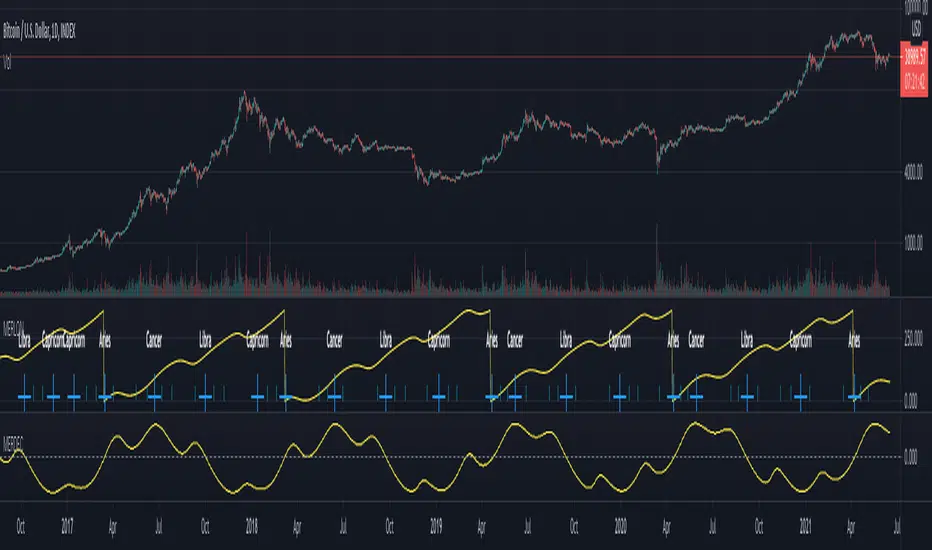
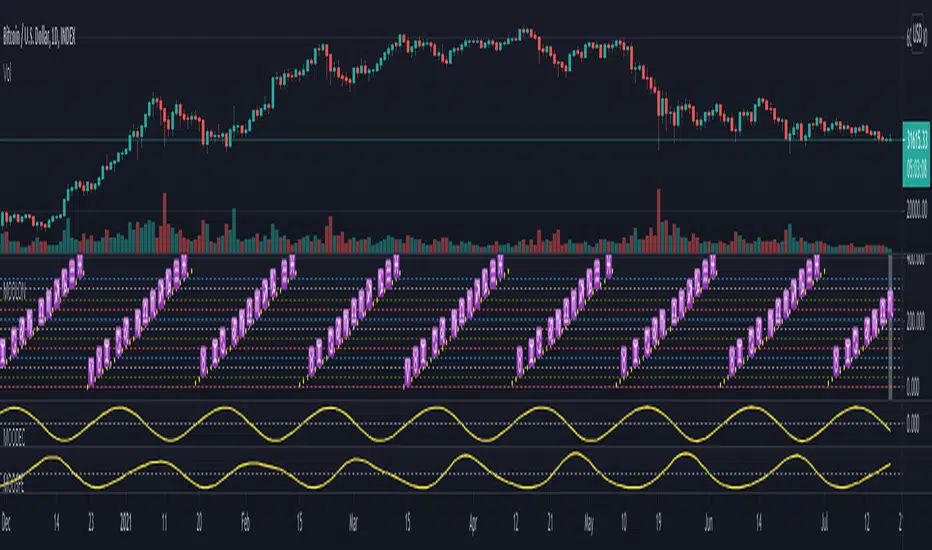
Financial Astrology Mercury SpeedMercury speed phases (stationary and retrograde) was closely observed by W. D. Gann in order to determine potential trend changes, in BTCUSD we can see some turning points close to the speed dips (when Mercury speed cross the zero line). However, what looks more interesting is that when the Mercury speed is accelerating the price range of the candles is larger, is the same pattern that we noted with the Moon speed indicator so we can conclude that speed acceleration periods produce more intense effects when Mercury aspects occurs.
Note: The Mercury speed indicator is based on an ephemeris array that covers years 2010 to 2030, prior or after this years the speed is not available, this daily ephemeris are based on UTC time so in order to align properly with the price bars times you should set UTC as your chart timezone.

Financial Astrology Moon SpeedThe acceleration of the Moon seems to be important in determining the periods of increasing volatility, when the speed is accelerating we can note that the price range of the candles during the acceleration period is greater than the candles during the deceleration period. In other words, the speed increase produce stronger effect in the price action and is expected that Moon aspects during speed acceleration are more intense than the ones formed during deceleration.
In order to evaluate this astro trading pattern, observe when Moon touch the speed minima around 11.5 degrees per day, at that point the speed curve start to increase until it reach the maxima around 15 degrees per day, within this period the candles price range seems to be more intense.
Note: The Moon speed indicator is based on an ephemeris array that covers years 2010 to 2030, prior or after this years the speed is not available, this daily ephemeris are based on UTC time so in order to align properly with the price bars times you should set UTC as your chart timezone.

Financial Astrology Saturn DeclinationSaturn declination don't exhibit a clear correlation with the price action of BTCUSD, we need to consider that we only have observations for the period of Saturn within South declination and based on other planets declination analysis we discover that stronger price effects are caused when planets are moving from South minima toward North declination maxima. One possibility is that as Saturn reaches the South maxima and start moving North, the Saturn malefic effects will be stronger when planets do hard aspects to it, this should be start to manifest in the following 2-3 years. Additionally, this Saturn weakening in South declination could explain why very hard aspect such as the exact Saturn square Uranus we experienced in 2022 don't produced the crash that many astrologers was forecasting.
Note: The Saturn declination indicator is based on an ephemeris array that covers years 2010 to 2030, prior or after this years the declination is not available, this daily ephemeris are based on UTC time so in order to align properly with the price bars times you should set UTC as your chart reference timezone.

Financial Astrology Jupiter DeclinationJupiter moving from South declination minima toward the North maxima and during all the travel from North maxima to zero declination produced the strong bullish long term trend, this coincide with other planets declinations observations, in general, we noted that when a planet is in North declination (above zero boundary) this strengthen the planet force and produces more strong price effects.
This Jupiter declination pattern needs more research in others markets, will be great to get the participation from more financial astrologers that could research this declination cycle in other markets and share feedback with us.
Note: The Jupiter declination indicator is based on an ephemeris array that covers years 2010 to 2030, prior or after this years the declination is not available, this daily ephemeris are based on UTC time so in order to align properly with the price bars times you should set UTC as your chart reference timezone.
Financial Astrology Venus DeclinationVenus crossing zero declination towards the south direction until the minima is reached seems to produce that the price change slows down and calms the volatility. This also coincides with few small corrections in ETHUSD, looks that Venus moving from South to North declination path produce much more strong trends.
This Venus declination pattern needs more research in others markets, I have analysed BTCUSD and was not able to see any clear cycle with Venus declination, will be great to get the participation from more financial astrologers that could research this declination cycle in other markets and share feedback with us.
Note: The Venus declination indicator is based on an ephemeris array that covers years 2010 to 2030, prior or after this years the declination is not available, this daily ephemeris are based on UTC time so in order to align properly with the price bars times you should set UTC as your chart reference timezone.
Financial Astrology Mars DeclinationMars crossing zero declination through the north direction exhibits more stronger force in the impulsive and aggressive price fluctuations, for BTCUSD we can see that in many of the occurrences there was very intense price action on this cryptocurrency. In the contrary when crossed the zero declination through the south declination direction, in many occurrences the price was in congestion / consolidation.
Is very likely that similar pattern repeats in others markets so will be great to get the participation of other financial astrologers that could research this declination cycle and share feedback with us.
Note: The Mars declination indicator is based on an ephemeris array that covers years 2010 to 2030, prior or after this years the declination is not available, this daily ephemeris are based on UTC time so in order to align properly with the price bars times you should set UTC as your chart reference timezone.
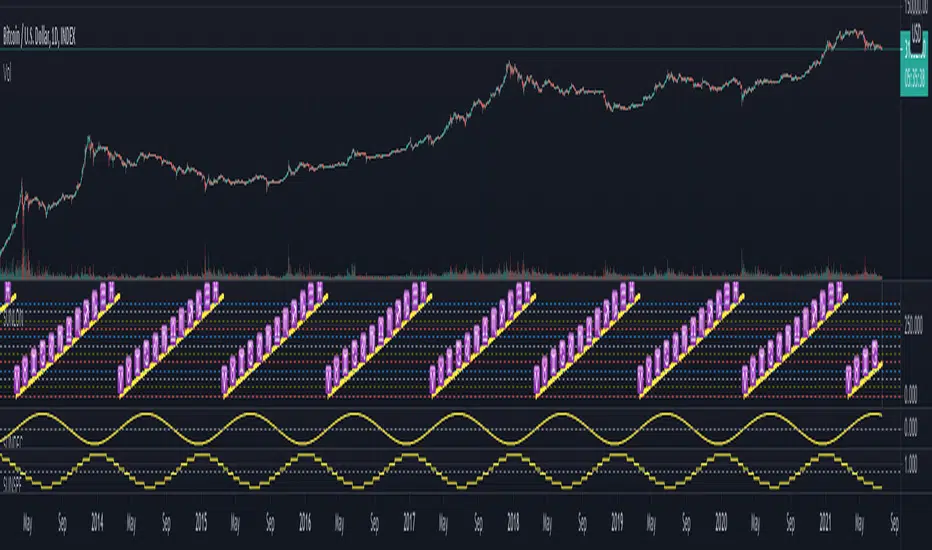
Financial Astrology Mercury DeclinationSeems that Mercury in extreme declinations above or below 21 tends to produce trend turning points. When the points where the declination reverse from maximum or minimum value are observed, could be noted that in BTCUSD it correlates quite close with trend turning points.
This financial astrology rule needs to be researched in different markets, if you find correlation of this turning points in other instruments, leve us a comment with your observations so we can confirm the significance of this rule. Thanks.
Note: The Mercury declination indicator is based on an ephemeris array that covers years 2010 to 2030, prior or after this years the declination is not available, this daily ephemeris are based on UTC time so in order to align properly with the price bars times you should set UTC as your chart reference timezone.
Financial Astrology Moon DeclinationIt's said by financial astrologers that Moon in extreme declinations above or below 22, tends to produce more extreme effects of the Moon energy effects. My friend Peter advised that extreme declinations are very intense energy points and when the extreme is reached a reversal effect is expected. We are not quite sure if this rule is valid so this indicator is to validate the this empirical observations.
Note: The Moon declination indicator is based on an ephemeris array that covers years 2010 to 2030, prior or after this years the declination is not available, this daily ephemeris are based on UTC time so in order to align properly with the price bars times you should set UTC as your chart reference timezone.
Financial Astrology Venus LongitudeVenus energy influence the affections, beauty, passion, arts, festivities, finance, marriage, speculation. As a traders the Venus cycle will determine the affection, love and interest we manifest for specific industries that we perceive more fascinating and seductive for our speculation purposes. Financial astrologer Bill Meridian suggest that Venus rules the industries of "recreation, cosmetics, fashion, leisure".
Personally I believe that the affection to hold shares within specific industries will be determined by the zodiac sign position of Venus. For example, Venus in Aries will rule sports, war industry, high risk and volatility, in Taurus the land, agriculture, cattle raising, banks, exchanges and and desire for stability, in Gemini the mass media, newspapers, marketing, publishing house, conferences and desire to discuss the trending topics, in Cancer the real state, bars and restaurants, fishing and so forth with the standard zodiac sign industries rulership. Therefore, traders will feel more affection for the industries / emotional behavior ruled by the sign that Venus is transiting. Therefore, as Venus transition to other signs that are incompatible with an industry characteristics, that desire to hold shares in a given industry would diminish.
Within the financial astrology research we have identified that the BTCUSD bullish Venus zodiac signs are: Aries, Gemini, Leo, Virgo, Scorpio, Aquarius and Pisces. The bearish signs are: Taurus, Cancer, Libra and Capricorn. The other signs show mixed results. As expected, Aquarius was a prominent position due to the fact that represent "technology and innovation", Pisces seem very relevant because represent the destruction of the previous model, the end of the traditional banks financial system in favor of the decentralized finances (DeFI) approach. Aries, because is the entrepreneurship spirit of the new opportunities that arise with this financial system transition where masses are willing to start trying, exploring and taking risks (adventures) in this alternative way to manage and storing your assets. Leo because cryptocurrencies is the new tech fashion and hot speculation area. Virgo because it provide a perfect immutable decentralised database (the blockchain) that couldn't be altered or manipulated so is precise and exact financial system that correlate well with the precision and exactness affection we feel within Virgo influence.
With this indicator there is unlimited possibilities to explore across different markets to strudy how the Venus energy influence plays out, no more manual chart annotations to identify the zodiac sign location of Venus. We encourage you to analyze this zodiac sign cycles in different markets and share with us your observations, leave us a comment with your research outcomes. Happy research!
Note: The Venus tropical longitude indicator is based on an ephemeris array that covers years 2010 to 2030, prior or after this years the longitude is not available, this daily ephemeris are based on UTC time so in order to align properly with the price bars times you should set UTC as your chart reference timezone.

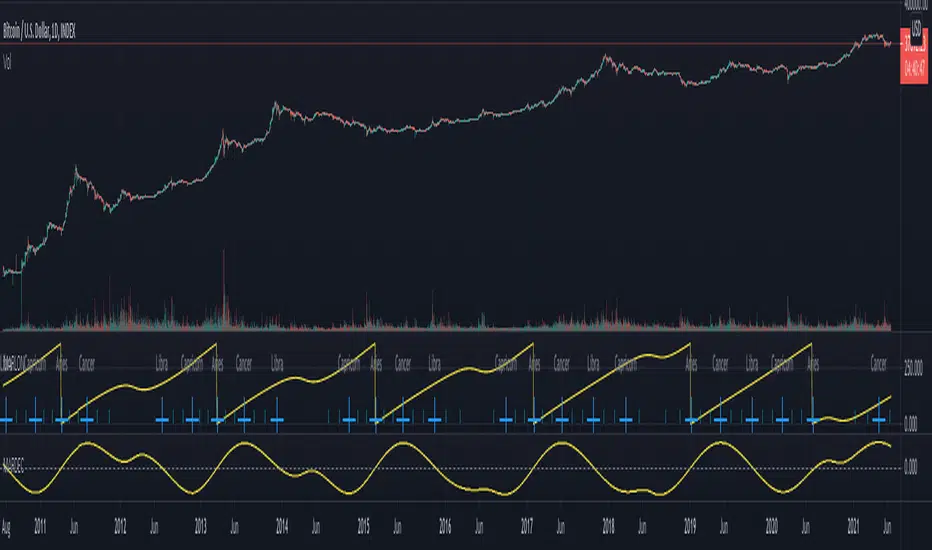
Financial Astrology Moon LongitudeMoon energy represent the masses, crowds, public places, children and emotions. The transit of the Moon through the zodiacal signs will color the crowd emotional responses that fluctuate based on the elemental qualities of the signs: fire (energetic and impulsive), earth (rigid, static, patient), water (assimilation, transformation, humor fluctuations), air (expansion, fervent, germination).
The daily average speed of the Moon is 13 degrees, for this reason the emotional elemental energy is transforming in average every 2 days and few hours, this mood fluctuations produces the short term instinctive and emotional actions performed by traders that forget the precise mathematical / statistical approach in favor of irrational and emotional impulses.
Based on statistical buy/sell frequency analysis we discovered that for BTC-USD, the Moon is usually bullish in zodiac signs: Aries, Libra, Scorpio, Aquarius and Pisces, the most relevant bullish sign is "Aquarius", from 206 observations in all the BTC-USD price history where Moon was in this sign the 60% of those days the price increased compared to the previous day. The bearish zodiac signs for BTC-USD are: Taurus, Cancer, Leo, Sagittarius and Capricorn, the most relevant bearish sign is "Capricorn".
Interestingly this zodiac sign locations tends to fluctuate during some periods of time and from the last 10 observations of the Moon transiting through Aries we noted that 7 of the 10 observations coincide with a dip, sometimes the Moon in Aries indicate the reversal of the short term trend, this is kind of expected considering that when Moon approaches Taurus the fall becomes more likely due to the fact that Moon in Taurus is a bearish signal.
With this indicator there is unlimited possibilities to explore across different markets and complementing with Moon phases this may be the perfect financial astrology indicator for those intraday traders that keep positions only for few hours.
We encourage you to analyze the Moon zodiac sign cycles in different markets and share with us your observations, leave us a comment with your research outcomes. Happy trading!
Note: The Moon longitude indicator is based on an ephemeris array that covers years 2010 to 2030, prior or after this years the longitude is not available, this daily ephemeris are based on UTC time so in order to align properly with the price bars times you should set UTC as your chart reference timezone.
Financial Astrology Sun LongitudeFinancial astrology is a branch of mundane astrology that research the correlations of planet cycles with market prices, this indicator developed by the Financial Astrology Research Group provides the visualization of the Sun Tropical Zodiac Longitude to support that astrology traders can study multiple markets within the powerful Trading View UI to detect potential cyclical patterns in price action that are connected with the cosmic rhythm of the Sun.
The Sun have been very relevant cycle among all ancient civilizations such as Maya, Aztec, Inca, this cyclical move is the fundamental frequency of our life's due to the fact that our calendar year is a model from this cycle. Chinese astrologers and W.D. Gann was aware of the powerful predictive power of the solar terms which is a representation of the most relevant weather transitions within the Sun longitude path.
With this indicator we try to ease the research work of the amazing community of astro-traders that prior to this indicators needed to create hundreds of manual annotations on the markets price charts to visualize the Sun zodiac position within a long period of time in order to research potential cycles. That manual work is over. Let's move faster in our cycles research!
We encourage all traders using astrology to continue their research, please share your ideas of astro cycles trading strategies and contribute your experiments at our Github exploration projects: github.com
Note: The Sun longitude is based on an ephemeris array that covers years 2010 to 2030, prior or after this years the longitude is not available, this daily ephemeris are based on UTC time so in order to align properly with the price bars times you should set UTC as your chart reference timezone.
Woobull BTC Top CapA close approximation of Willy Woo's Top Cap indicator.
Top Cap is BTC's market cap cumulative average x 35
Since trading view lacks the data from 2010 to 2014 that is used for the calculation, initial values are taken from Willy Woo's chart.
The indicator must be applied to a CRYPTOCAP:BTC chart and daily timeframe

Bollinger Band Width PercentileIntroducing the Bollinger Band Width Percentile
Definitions :
Bollinger Band Width Percentile is derived from the Bollinger Band Width indicator.
It shows the percentage of bars over a specified lookback period that the Bollinger Band Width was less than the current Bollinger Band Width.
Bollinger Band Width is derived from the Bollinger Bands® indicator.
It quantitatively measures the width between the Upper and Lower Bands of the Bollinger Bands.
Bollinger Bands® is a volatility-based indicator.
It consists of three lines which are plotted in relation to a security's price.
The Middle Line is typically a Simple Moving Average.
The Upper and Lower Bands are typically 2 standard deviations above, and below the SMA (Middle Line).
Volatility is a statistical measure of the dispersion of returns for a given security or market index, measured by the standard deviation of logarithmic returns.
The Broad Concept :
Quoting Tradingview specifically for commonly noted limitations of the BBW indicator which I have based this indicator on....
“ Bollinger Bands Width (BBW) outputs a Percentage Difference between the Upper Band and the Lower Band.
This value is used to define the narrowness of the bands.
What needs to be understood however is that a trader cannot simply look at the BBW value and determine if the Band is truly narrow or not.
The significance of an instruments relative narrowness changes depending on the instrument or security in question.
What is considered narrow for one security may not be for another.
What is considered narrow for one security may even change within the scope of the same security depending on the timeframe.
In order to accurately gauge the significance of a narrowing of the bands, a technical analyst will need to research past BBW fluctuations and price performance to increase trading accuracy. ”
Here I present the Bollinger Band Width Percentile as a refinement of the BBW to somewhat overcome the limitations cited above.
Much of the work researching past BBW fluctuations, and making relative comparisons is done naturally by calculating the Bollinger Band Width Percentile.
This calculation also means that it can be read in a similar fashion across assets, greatly simplifying the interpretation of it.
Plotted Components of the Bollinger Band Width Percentile indicator :
Scale High
Mid Line
Scale Low
BBWP plot
Moving Average 1
Moving Average 2
Extreme High Alert
Extreme Low Alert
Bollinger Band Width Percentile Properties:
BBWP Length
The time period to be used in calculating the Moving average which creates the Basis for the BBW component of the BBWP.
Basis Type
The type of moving average to be used as the Basis for the BBW component of the BBWP.
BBWP Lookback
The lookback period to be used in calculating the BBWP itself.
BBWP Plot settings
The BBWP plot settings give a choice between a user defined solid color, and a choice of "Blue Green Red", or "Blue Red" spectrum palettes.
Moving Averages
Has 2 Optional User definable and adjustable moving averages of the BBWP.
Visual Alerts
Optional User adjustable High and low Signal columns.
How to read the BBWP :
A BBWP read of 95 % ... means that the current BBW level is greater than 95% of the lookback period.
A BBWP read of 5 % .... means that the current BBW level is lower than 95% of the lookback period.
Proposed interpretations :
When the BBWP gets above 90 % and particularly when it hits 100% ... this can be a signal that volatility is reaching a maximum and that a macro High or Low is about to be set.
When the BBWP gets below 10 % and particularly when it hits 0% ...... this can be a signal that volatility is reaching a minimum and that there could be a violent range breakout into a trending move.
When the BBWP hits a low level < 5 % and then gets above its moving average ...... this can be an early signal that a consolidation phase is ending and a trending move is beginning.
When the BBWP hits a high level > 95 % and then falls below its moving average ... this can be an early signal that a trending move is ending and a consolidation phase is beginning.
Essential knowledge :
The BBWP was designed with the daily timeframe in mind, but technical analysists may find use for it on other time frames also.
High and Low BBWP readings do not entail any direction bias.
Deeper Concepts :
In finance, “mean reversion” is the assumption that a financial instrument's price will tend to move towards the average price over time.
If we apply that same logic to volatility as represented here by the Bollinger band width percentile, the assumption is that the Bollinger band width percentile will tend to contract from extreme highs, and expand from extreme lows over time corresponding to repeated phases of contraction and expansion of volatility.
It is clear that for most assets there are periods of directional trending behavior followed by periods of “consolidation” ( trading sideways in a range ).
This often ends with a tightening range under reducing volume and volatility ( popularly known as “the squeeze” ).
The squeeze typically ends with a “breakout” from the range characterized by a rapid increase in volume, and volatility when price action again trends directionally, and the cycle repeats.
Typical Use Cases :
The Bollinger Band Width Percentile may be especially useful for Options traders, as it can provide a bias for when Options are relatively expensive, or inexpensive from a Volatility (Vega) perspective.
When the Bollinger Band Width Percentile is relatively high ( 85 percentile or above ) it may be more advantageous to be a net seller of Vega.
When the Bollinger Band Width Percentile is relatively low ( 15 percentile or below ) it may be advantageous to be net long Vega.
Here we examine a number of actionable signals on BTCUSD daily timeframe using the BBWP and a momentum oscillator ( using the TSI here but can equally be used with Bollinger bands, moving averages, or the traders preferred momentum oscillator ).
In this first case we will examine how a spot trader and an options trader could each use a low BBWP read to alert them to a good potential trade setup.
note: using a period of 30 for both the Bollinger bands and the BBWP period ( approximately a month ) and a BBWP lookback of 350 ( approximately a year )
As we see the Bollinger Bands have gradually contracted while price action trended down and the BBWP also fell consistently while below its moving average ( denoting falling volatility ) down to an extremely low level <5% until it broke above its moving average along with a break of range to the upside ( signaling the end of the consolidation at a low level and the beginning of a new trending move to the upside with expanding volatility).
In this next case we will continue to follow the price action presuming that the traders have taken or locked in profit at reasonable take profit levels from the previous trade setup.
Here we see the contraction of the Bollinger bands, and the BBWP alongside price action breaking below the BB Basis giving a warning that the trending move to the upside is likely over.
We then see the BBWP rising and getting above its moving average while price action fails to get above the BB Basis, likewise the TSI fails to get above its signal line and actually crosses below its zeroline.
The trader would normally take this as a signal that the next trending move could be to the downside.
The next trending move turns out to be a dramatic downside move which causes the BBWP to hit 100% signaling that volatility is likely to hit a maximum giving good opportunities for profitable trades to the skilled trader as outlined.
Limitations :
Here we will look at 2 cases where blindly taking BBWP signals could cause the trader to take a failed trade.
In this first example we will look at blindly taking a low volatility options trade
Low Volatility and corresponding low BBWP levels do not automatically mean there has to be expansion immediately, these periods of extreme low volatility can go on for quite some time.
In this second example we will look at blindly taking a high volatility spot short trade
High volatility and corresponding high BBWP levels do not automatically mean there has to be a macro high and contraction of volatility immediately, these periods of extreme high volatility can also go on for quite some time, hence the famous saying "The trend is your friend until the end of the trend" and lesser well known, but equally valid saying "never try to short the top of a parabolic blow off top"
Markets are variable and past performance is no guarantee of future results, this is not financial advice, I am not a financial advisor.
Final thoughts
The BBWP is an improvement over the BBW in my opinion, and is a novel, and useful addition to a Technical Analysts toolkit.
It is not a standalone indicator and is meant to be used in conjunction with other tools for direction bias, and Good Risk Management to base sound trades off.
John Bollinger has suggested using Bolliger bands, and its related indicators with two or three other non-correlated indicators that provide more direct market signals.
He believes it is crucial to use indicators based on different types of data.
Some of his favored technical techniques are moving average divergence/convergence (MACD), on-balance volume and relative strength index (RSI).
Thanks
Massive respect to John Bollinger, long-time technician of the markets, and legendary creator of both the Bollinger Bands® in the 1980´s, and the Bollinger band Width indicator in 2010 which this indicator is based on.
His work continues to inspire, decades after he brought the original Bollinger Bands to the market.
Much respect also to Eric Crown who gave me the fundamental knowledge of Technical Analysis, and Options trading.

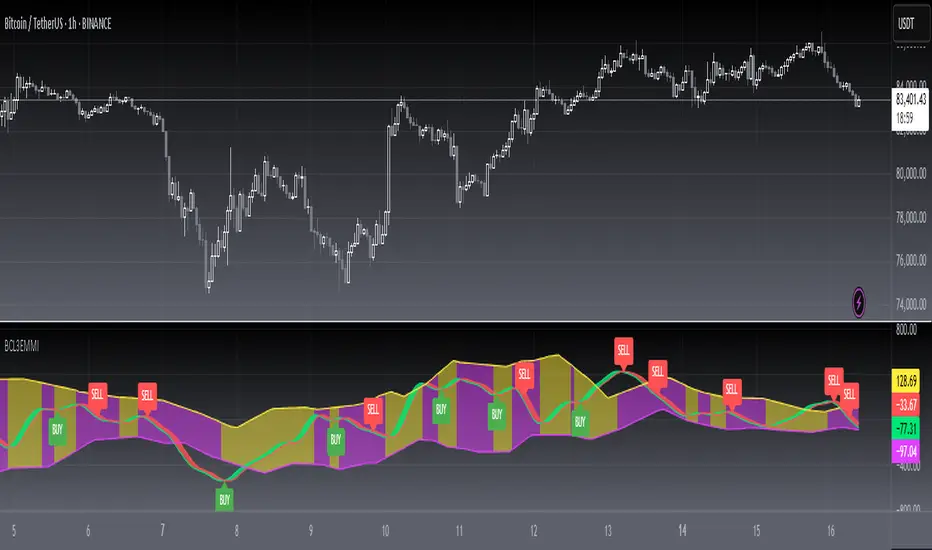
[blackcat] L3 Ehlers Market Mode IndicatorLevel: 3
Background
John F. Ehlers introuced Market Mode Indicator on April, 2012.
Function
This indicator is used to determine whether the market is in a trending or a cyclical mode. This is accomplished by comparing the average value of price, after being filtered to the peaks and valleys of that filtered price. The filter used in this indicator is a second order butterworth filter. For more information on this calculation see "Introducing SwamiCharts" (March 2012) and "Empirical Mode Decomposition" (March 2010) from Technical Analysis of Stocks and Commodities by Dr. Ehlers.
Key Signal
MeanCalc --> short term fast line
MeanCalc(2) --> short term slow line
long ---> long entry signal
short ---> short entry signal
Pros and Cons
NOT 100% John F. Ehlers definition translation, even variable names are the same. This help readers who would like to use pine to read his book.
Remarks
The 80th script for Blackcat1402 John F. Ehlers Week publication.
I kept the core of Ehlers market mode indicator, but add conditons for long and short entries which i think they are reasonable.
Readme
In real life, I am a prolific inventor. I have successfully applied for more than 60 international and regional patents in the past 12 years. But in the past two years or so, I have tried to transfer my creativity to the development of trading strategies. Tradingview is the ideal platform for me. I am selecting and contributing some of the hundreds of scripts to publish in Tradingview community. Welcome everyone to interact with me to discuss these interesting pine scripts.
The scripts posted are categorized into 5 levels according to my efforts or manhours put into these works.
Level 1 : interesting script snippets or distinctive improvement from classic indicators or strategy. Level 1 scripts can usually appear in more complex indicators as a function module or element.
Level 2 : composite indicator/strategy. By selecting or combining several independent or dependent functions or sub indicators in proper way, the composite script exhibits a resonance phenomenon which can filter out noise or fake trading signal to enhance trading confidence level.
Level 3 : comprehensive indicator/strategy. They are simple trading systems based on my strategies. They are commonly containing several or all of entry signal, close signal, stop loss, take profit, re-entry, risk management, and position sizing techniques. Even some interesting fundamental and mass psychological aspects are incorporated.
Level 4 : script snippets or functions that do not disclose source code. Interesting element that can reveal market laws and work as raw material for indicators and strategies. If you find Level 1~2 scripts are helpful, Level 4 is a private version that took me far more efforts to develop.
Level 5 : indicator/strategy that do not disclose source code. private version of Level 3 script with my accumulated script processing skills or a large number of custom functions. I had a private function library built in past two years. Level 5 scripts use many of them to achieve private trading strategy.
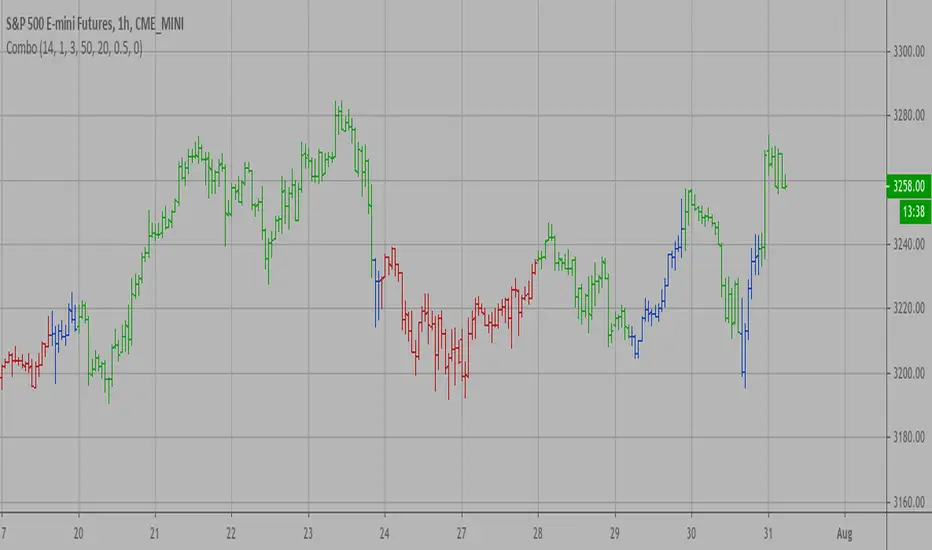
Combo Backtest 123 Reversal & Extracting The Trend This is combo strategies for get a cumulative signal.
First strategy
This System was created from the Book "How I Tripled My Money In The
Futures Market" by Ulf Jensen, Page 183. This is reverse type of strategies.
The strategy buys at market, if close price is higher than the previous close
during 2 days and the meaning of 9-days Stochastic Slow Oscillator is lower than 50.
The strategy sells at market, if close price is lower than the previous close price
during 2 days and the meaning of 9-days Stochastic Fast Oscillator is higher than 50.
Second strategy
Extracting The Trend
The related article is copyrighted material from Stocks & Commodities Mar 2010
WARNING:
- For purpose educate only
- This script to change bars colors.

Combo Strategy 123 Reversal & Extracting The Trend This is combo strategies for get a cumulative signal.
First strategy
This System was created from the Book "How I Tripled My Money In The
Futures Market" by Ulf Jensen, Page 183. This is reverse type of strategies.
The strategy buys at market, if close price is higher than the previous close
during 2 days and the meaning of 9-days Stochastic Slow Oscillator is lower than 50.
The strategy sells at market, if close price is lower than the previous close price
during 2 days and the meaning of 9-days Stochastic Fast Oscillator is higher than 50.
Second strategy
Extracting The Trend
The related article is copyrighted material from Stocks & Commodities Mar 2010
WARNING:
- For purpose educate only
- This script to change bars colors.
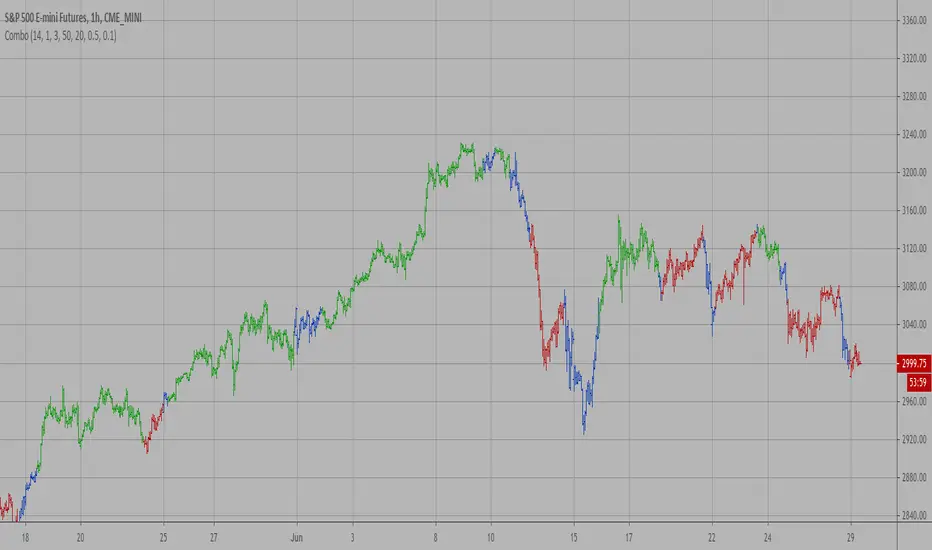
Combo Backtest 123 Reversal & Empirical Mode Decomposition This is combo strategies for get a cumulative signal.
First strategy
This System was created from the Book "How I Tripled My Money In The
Futures Market" by Ulf Jensen, Page 183. This is reverse type of strategies.
The strategy buys at market, if close price is higher than the previous close
during 2 days and the meaning of 9-days Stochastic Slow Oscillator is lower than 50.
The strategy sells at market, if close price is lower than the previous close price
during 2 days and the meaning of 9-days Stochastic Fast Oscillator is higher than 50.
Second strategy
The related article is copyrighted material from Stocks & Commodities Mar 2010
WARNING:
- For purpose educate only
- This script to change bars colors.

Combo Strategy 123 Reversal & Empirical Mode Decomposition This is combo strategies for get a cumulative signal.
First strategy
This System was created from the Book "How I Tripled My Money In The
Futures Market" by Ulf Jensen, Page 183. This is reverse type of strategies.
The strategy buys at market, if close price is higher than the previous close
during 2 days and the meaning of 9-days Stochastic Slow Oscillator is lower than 50.
The strategy sells at market, if close price is lower than the previous close price
during 2 days and the meaning of 9-days Stochastic Fast Oscillator is higher than 50.
Second strategy
The related article is copyrighted material from Stocks & Commodities Mar 2010
WARNING:
- For purpose educate only
- This script to change bars colors.
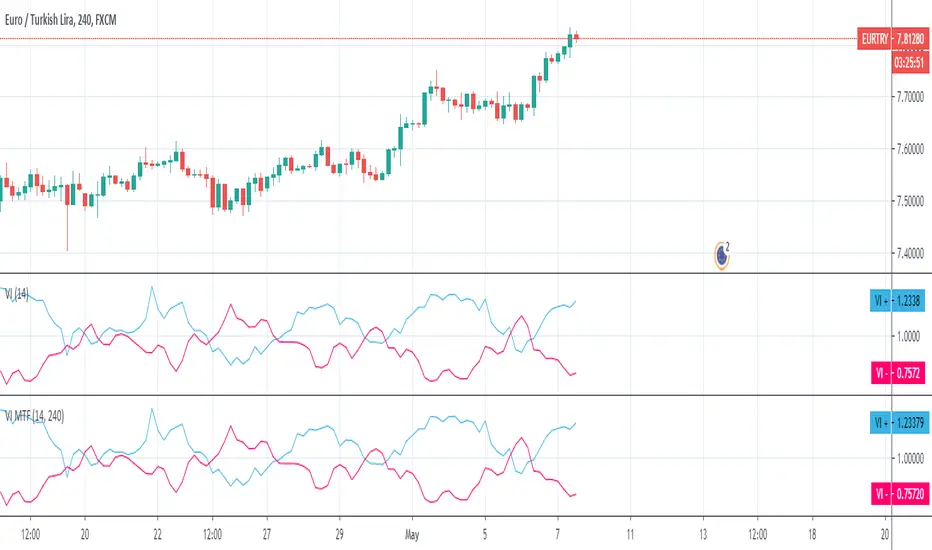
Vortex MTFUnderstanding Vortex Indicator (VI)
The vortex indicator was first developed by Etienne Botes and Douglas Siepman who introduced the concept in the January 2010 edition of “Technical Analysis of Stocks & Commodities.” The vortex indicator is based on two trendlines: VI+ and VI-.
What is the Vortex Indicator (VI)?
A vortex indicator (VI) is an indicator composed of two lines - an uptrend line (VI+) and a downtrend line (VI-). These lines are typically colored green and red respectively. A vortex indicator is used to spot trend reversals and confirm current trends.
Vortex Indicator Calculations
The calculation for the indicator is divided into four parts.
1. True range (TR) is the greatest of:
Current high minus current low
Current high minus previous close
Current low minus previous close
2. Uptrend and downtrend movement:
VM+ = Absolute value of current high minus prior low
VM- = Absolute value of current low minus prior high
3. Parameter length (n)
Decide on a parameter length (between 14 and 30 days is common)
Sum the last n period’s true range, VM+ and VM-:
Sum of the last n periods’ true range = SUM TRn
Sum of the last n periods’ VM+ = SUM VMn+
Sum of the last n periods’ VM- = SUM VMn−
4. Create the trendlines VI+ and VI-
SUM VMn+/SUM TRn = VIn+
SUM VMn-/SUM TRn = VIn−
Repeating this process daily forms the VI+ and VI- trendlines.
The traditional application of using VI- and VI+ crossovers can result in a number of false trade signals when price action is choppy. Increase the number of periods used in the indicator to reduce this, for example, using 25 periods instead of 14.
What is MTF?
Multiple Time Frame Analysis is the technique of analyzing several time frames of the same asset before entering a trade. This type of analysis is best done using a top-down approach, i.e. starting at a higher time frame and working your way down, via several lower time frames, until the execution time frame is reached where a trade could be entered. Traders who use this technique usually look at 3 or 4 different time frames to identify the general trend and find the best entries. They minimize their risk and improve the odds of success simply by taking the bigger picture into account. It can easily be combined with any trading strategy.
Time frames are usually several times apart. For example a day trader who trades hourly charts, could analyse the weekly (high time frame), the daily (7 times smaller), the 4 hour (6 times smaller) and finally the hourly time frame (execution time frame, 4 times smaller). TradingView has a chart layout feature with multiple charts per layout, so you can analyse an asset on multiple time frames under one tab in your browser.
Summary
With MTF, you can see the Vortex indicator values for a specific time period without changing the graph time period.
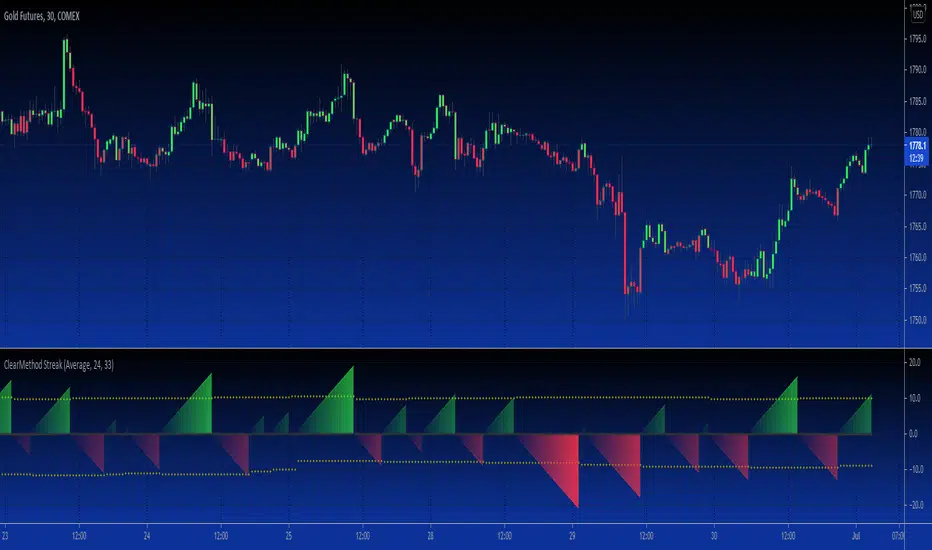
B3 Clear Method Streak CountAbout Clear Method -- to repeat my prior post on the bar painter script:
This indicator is translated out of Technical Analysis of Stocks & Commodities , September 2010, (I take zero design credit). The script simply looks for the price action to break or "clear" the most recent action, and only changes the paintbar color if the action indeed clears the previous candles. Simple to use, just add to your chart from your favorites and change the colors in the UI. It does the rest.
This version can replace my previous Clear Method Bar Painter as it also paints the bars.
What is different is this share is a lower study that counts the streak of the bars shown via histogram.
The way to use the streak is to notice the previous streaks and get a sense of how long the current trend is lasting versus prior trends of the same direction.
@Tradestation recently posted their "price streak" study, and this one is quite similar in nature.
Enjoy, the code open to view,
_B3
d^.^b
MAC-Z [ChuckBanger]Here I show the relationship between the MACD and Z-Score in a indicator called MAC-Z. MACD is short for moving average convergence/divergence and is in it self showing the relationship between two EMA. The Z-Score in contrast is related to Bollinger Bands and in MAC-Z the Z-score is the difference between the current price and a moving average divided by the standard deviation of price over the same time period.
MAC-Z has its best use in the short term time frames in my opinion compared to MACD. Here i show from current time of writing how effective it is.
More info on MAC-Z:
cssanalytics.wordpress.com
Also take a look at MACD Leader:
