VIX Filter/RSI/EMA Bias/Cum-TICK w/ Exhaustion Zone DashboardThis all-in-one dashboard gives intraday traders a real-time visual read of market conditions, combining volatility regime, trend bias, momentum exhaustion, and internal strength — all in a fully customizable overlay that won’t clutter your chart.
📉 VIX Market Regime Detector
Identifies "Weak", "Normal", "Volatile", or "Danger" market states based on customizable VIX ranges and symbol (e.g., VXN or VIX).
📊 RSI Momentum Readout
Displays real-time RSI from any selected timeframe or symbol, with adjustable length, OB/OS thresholds, and color-coded exhaustion alerts.
📈 EMA Trend Bias Scanner
Compares fast and slow EMAs to define bullish or bearish bias, using your preferred timeframe, symbol, and EMA lengths — ideal for multi-timeframe setups.
🧠 Cumulative TICK Pressure & Exhaustion Engine
Analyzes internal market strength using cumulative TICK data to classify conditions as:
-Strong / Mild Bullish or Bearish Pressure
-Choppy / No Edge
-⚠️ Exhaustion Zones — when raw TICK values hit extreme highs/lows, a separate highlight box appears in the dashboard, warning of potential turning points
All logic is customizable, including TICK symbol, timeframes, thresholds, and lookback periods.
Scalpers and day traders who want fast, visual insight into market internals, exhaustion, and trend bias.
Wyszukaj w skryptach "同花顺软件+美国+VIX+恐慌指数+行情代码"

VIX/VOLI RatioWe all know TVC:VIX . But what is NASDAQ:VOLI ?
VOLI is basically a measure of expectations for market volatility over the next 30 calendar days as expressed by ATM options on AMEX:SPY
nations.com
So why is this VIX /VOLI ratio important? It's because it can give an important measure of options skew.
It can show the premium of OTM options (particularly puts) over ATM.
It can show if traders are interested in owning wings in AMEX:SPY
Not a lot of info can be taken by just looking at the ratio as a standalone nominal value. Plus, the ratio is noisy and spotting a clear trend can be hard.
For these reasons, I decided to code this indicator (which is best used on the Daily chart).
I added two EMA clouds, 7 and 12 and color code them with respect to their positions. If 7 > 12, cloud will be green. If 7 < 12, cloud will be red. This will give a better view of how the ratio is trending.
I then added a lookback period that can be changed from the indicator's setting (along with the fast and slow EMAs).
The lookback period will be used to get the following parameters:
- highest value
- lowest value
- 10th, 30th, 50th, 70th and 90th percentiles
- Percentile Rank
- Average, Median and Mode
Having all these values in a table will give a better idea of where the current ratio sits.

VIX - SHORT - SVXY - Daily Chart (Oldinvestor)This looks at he VIX and trades SVXY. Load SVXY and run the script on SVXY.
INPUTS:
Entry - You set this number to how high you want the VIX to go before SVXY will be bought. Keep in mind it buys the bar after a trigger, results may be confusing
Exit - You set this number to how low you want the VIX to go before SVXY will be sold.
Year - This as stated, It will start trading on the year you set here.
Good luck.
This script is for learning purposes, and boy did I learn something. UVXY still sucks

Bars Since VIX MedianBARS SINCE VIX17 Median by dime (v1.0 release) 04/02/2017
(Inspired by "Bars Since the last RSI Extreme" from DRodriguezFX)
This indicator is useful in tracking how many daily bars since the VIX was last at a historically 'normal' range.
Currently the VIX has been in a period of low volatility for a period of 98 daily bars since the VIX was last at the 17 historical median.

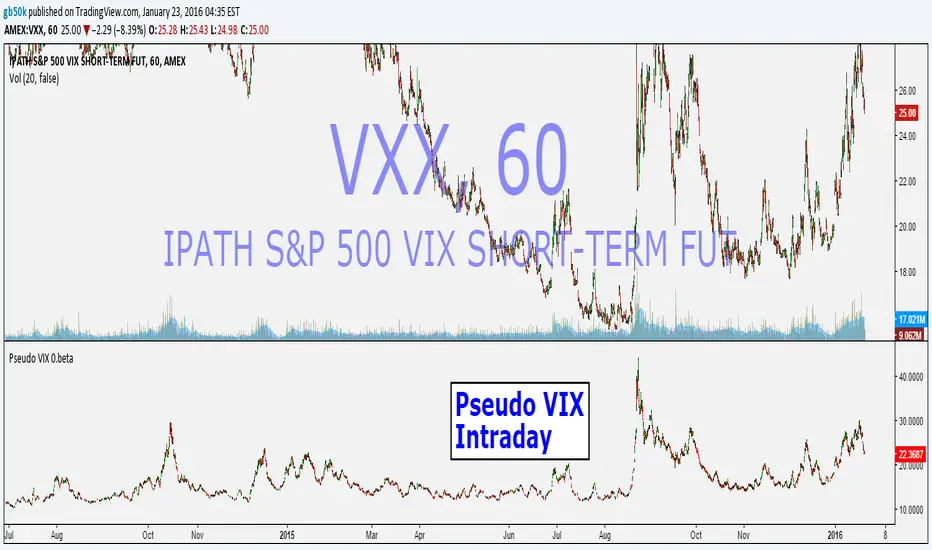
Pseudo VIX -Intraday -.betaFor Educational Purpose -
Intraday VIX estimation using yesterdays VIX, previous overnight roll , and intraday values for the VXX etf (scaled up to VIX)
Works in all intraday time frames.
First attempt...feedback welcome.
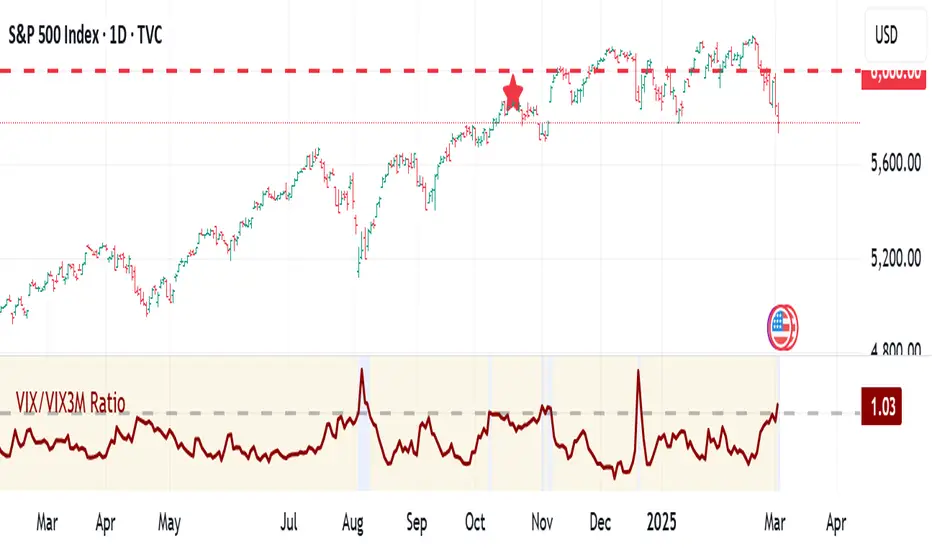
VIX:VIX3M RatioThe VIX/VIX3M Ratio indicator compares the short-term (1-month) volatility index (VIX) to the medium-term (3-month) volatility index (VIX3M). This ratio provides insights into the market's volatility expectations across different time horizons.
Key Interpretations:
Ratio > 1: Short-term volatility expectations are higher than 3-month expectations
Ratio = 1: Short-term and medium-term volatility expectations are aligned
Ratio < 1: Medium-term volatility expectations are higher than short-term expectations
Potential Trading Insights:
A rising ratio may indicate increasing near-term market uncertainty
Significant deviations from 1.0 can signal potential market stress or changing risk perceptions
Traders use this to gauge the term structure of market volatility
VIX Cheat SheetHello!
This indicator - "VIX Cheat Sheet" - performs several calculations for $VIX against the asset on your chart. However, using $VIX as a risk proxy or volatility metric often fails beyond large-cap U.S equities. To remedy this, the VixFix indicator is included in the script; you can select whether the script performs calculations for an asset against $VIX or against VixFix (i.e. Forex, Crypto)
Measured are: $VIX correlation to an asset's price fluctuations, the average close-to-close gain/loss subsequent a $VIX/VixFix close above the upper Bollinger Band, the average 5-session gain/loss following the same occurrence in addition to the average 10-session gain/loss, all close-to-close, 5 session, and 10-session gains/losses are stored as tooltips for labels on the chart. The current close-to-close percentage gain/loss for $VIX and VixFix are displayed on the chart.
Displayed in the example image is a box incorporating $VIX price data alongside an upper Bollinger Band and lower Bollinger Band. The data isn't cast to its own price scale but is helpful for quick interpretation of $VIX fluctuations. You can select to plot VixFix data in the box in the user inputs table.
Displayed in the second example image is a semi-transparent blue box encompassing all price moves that occurred when $VIX measured above $40 for at least ten consecutive sessions. The largest percentage close-to-close loss is displayed below the box.
Also illustrated is a red label that appears when $VIX or VixFix closes above the upper Bollinger Band. The indicator will calculate and display the performance of the asset for the subsequent 10 sessions, to which the red label will disappear and all data stored as a tooltip in the blue labels stating "VIX Closed Above Upper Band" or "VixFix Closed Above Upper Band".
To reduce chart clutter, a label and line combination marking all $VIX closes above the upper Bollinger Band was not included. Instead, bar color changes were added. When "$VIX" is selected in the user inputs table the indicator will mark all sessions in which $VIX closed above the upper band as blue, in addition to plotting $VIX price data in the dynamic black box. When "VixFix" is selected, the indicator will mark all sessions where VixFix closed above the upper band as purple; the VixFix indicator will be plotted in the black box.
Be sure to hover over labels to access tooltip information; try the indicator with bar replay!

Vix Jump for Selling Puts or Buying CallsThis script aims to identify optimal times when to write Puts for premium, for example using the SPX Weeklies model or simply buying Calls. Not perfect but provides some additional confidence when playing Puts on SPX or the Wheel on SPY.
What it does:
We compare current VIX with a lookback VIX for X% delta. If there is a jump of say 20% over a defined period then that would indicate an opportunity to sell Puts, run a straddle or buy Calls. We use VVIX as a check to stop to many false positives ie VVIX falls of faster than VIX.
You can also use this loosely as a bottom finder.

VIX Near-Term Futures CurveThis indicator provides a 3 day smoothed histogram expressing whether the near term VIX futures curve is in a state of contango or backwardation. The solid red/green bars express the spot vs front-month vs next month curve with the value being the cumulative point spread between them. The shaded overlay bars express the spread between the VIX spot index and front-month futures contract only.
This indicator is to be used on a 1 DAY interval or higher.

VIX Implied Move Bands for ES/Emini futuresThis script uses the close of the VIX on a daily resolution to provide the 'implied move' for the E-mini SP500 futures. While it can be applied to any equity index, it's crucial to know that the VIX is calculated using SPX options, and may not reflect the implied volatility of other indices. The user can adjust the length of the moving average used to calculate the bands, the window of days used to calculate the implied move, and the multiplier that effects the width of the bands.

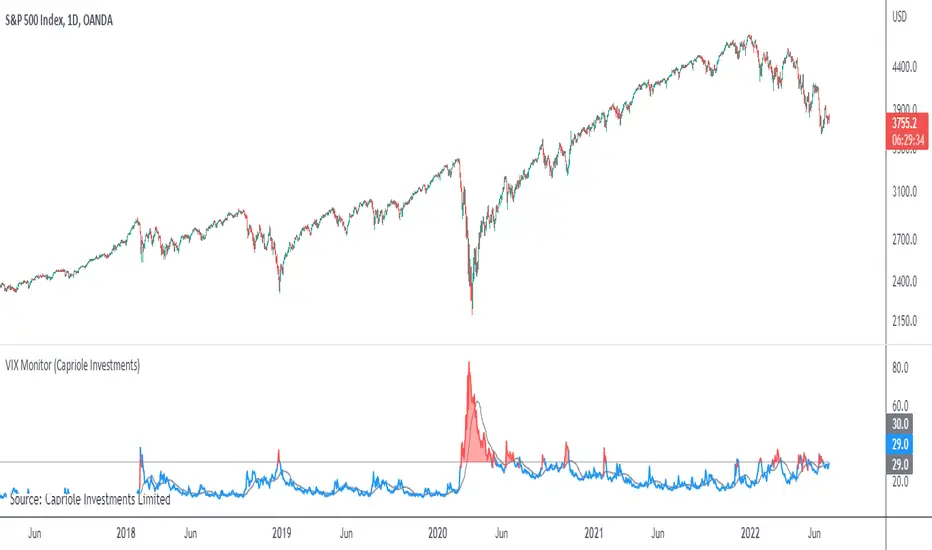
VIX MonitorSimple VIX Monitor to track spikes.
Spikes in VIX are often followed by big moves up in stocks.
Useful when paired with "Correlation & Beta" Indicator.
For Bitcoin Traders: when Bitcoin is highly correlated to Stocks (such as now) it could be a good opportunity for a short-term long trade.
VIX INDICATORWorks best as an intraday indicator
Background black & line green = Long VIX
Background black & red line = No trade
Background orange & line green = Consider selling
Background orange & line red = Short VIX

Vix FIX / StochRSI StrategyThis strategy is based off of Chris Moody's Vix Fix Indicator . I simply used his indicator and added some rules around it, specifically on entry and exits.
Rules :
Enter upon a filtered or aggressive entry
If there are multiple entry signals, allow pyramiding
Exit when there is Stochastic RSI crossover above 80
This works great on a number of stocks. I am keeping a list of stocks with decent Profit Factors and clean equity curves here .
Possible ways to use this:
Modify this script and setup alerts around the various entries
Use as is with different stocks or currency pairs
Modify entry / exit points to make it more profitable for even more symbols and currencies

VIX vs VIX1Y SpreadSpread Calculation: Shows VIX1Y minus VIX
Positive = longer-term vol higher (normal contango)
Negative = near-term vol elevated (inverted term structure)
Can help identify longer term risk pricing of equity assets.

VIX based LevelsSupport and resistance levels for the day based on the volatility index.
Major - The Major support line where the day low, high or close can occur at that level
Minor - The second level of the Support/Resistance line , where we can expect some rejections or breakouts/breakdowns
Mild - The mid level between the Major and minor levels. The market may consolidate around that area.
The script will automatically get the previous day close value of the current scrip and the India vix.
India vix is calculated based on the annual percentage and hence the previous day close value of the scrip is divided by 19.1 ( square root of 365 )
The PDC values can be manually overridden for backtesting purposes.
Please note, there will be some slippages involved on the trend lines.

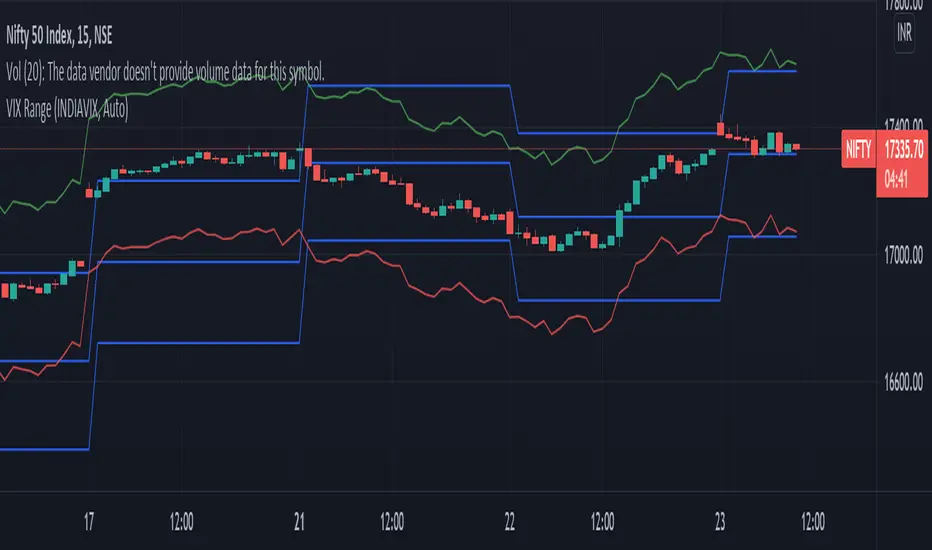
VIX RangeThis indicator shows the daily expected trading range of the instrument.
An upper and lower line denotes the range. It is calulated based on the volatility index selected (NSE:India VIX is used by default). Also it shows developing upper and lower line for the next trading day.
Non-directional option strategies (like straddle, strangle) can be performed based on the expected trading range.

VIX - Fast 30% gains in volatility - shorting Script is showing if volatility has risen 30% or more from the 10-day MA. Great opportunity for shorting when indicator gets close or above green 30% line. Red line is current MA average.

Dual SuperTrend w VIX Filter - Strategy [presentTrading]Hey everyone! Haven't been here for a long time. Been so busy again in the past 2 months. I recently started working on analyzing the combination of trend strategy and VIX, but didn't get outstanding results after a few tries. Sharing this tool with all of you in case you have better insights.
█ Introduction and How it is Different
The Dual SuperTrend with VIX Filter Strategy combines traditional trend following with market volatility analysis. Unlike conventional SuperTrend strategies that focus solely on price action, this experimental system incorporates VIX (Volatility Index) as an adaptive filter to create a more context-aware trading approach. By analyzing where current volatility stands relative to historical norms, the strategy adjusts to different market environments rather than applying uniform logic across all conditions.
BTCUSD 6hr Long Short Performance
█ Strategy, How it Works: Detailed Explanation
🔶 Dual SuperTrend Core
The strategy uses two SuperTrend indicators with different sensitivity settings:
- SuperTrend 1: Length = 13, Multiplier = 3.5
- SuperTrend 2: Length = 8, Multiplier = 5.0
The SuperTrend calculation follows this process:
1. ATR = Average of max(High-Low, |High-PreviousClose|, |Low-PreviousClose|) over 'length' periods
2. UpperBand = (High+Low)/2 - (Multiplier * ATR)
3. LowerBand = (High+Low)/2 + (Multiplier * ATR)
Trend direction is determined by:
- If Close > previous LowerBand, Trend = Bullish (1)
- If Close < previous UpperBand, Trend = Bearish (-1)
- Otherwise, Trend = previous Trend
🔶 VIX Analysis Framework
The core innovation lies in the VIX analysis system:
1. Statistical Analysis:
- VIX Mean = SMA(VIX, 252)
- VIX Standard Deviation = StdDev(VIX, 252)
- VIX Z-Score = (Current VIX - VIX Mean) / VIX StdDev
2. **Volatility Bands:
- Upper Band 1 = VIX Mean + (2 * VIX StdDev)
- Upper Band 2 = VIX Mean + (3 * VIX StdDev)
- Lower Band 1 = VIX Mean - (2 * VIX StdDev)
- Lower Band 2 = VIX Mean - (3 * VIX StdDev)
3. Volatility Regimes:
- "Very Low Volatility": VIX < Lower Band 1
- "Low Volatility": Lower Band 1 ≤ VIX < Mean
- "Normal Volatility": Mean ≤ VIX < Upper Band 1
- "High Volatility": Upper Band 1 ≤ VIX < Upper Band 2
- "Extreme Volatility": VIX ≥ Upper Band 2
4. VIX Trend Detection:
- VIX EMA = EMA(VIX, 10)
- VIX Rising = VIX > VIX EMA
- VIX Falling = VIX < VIX EMA
Local performance:
🔶 Entry Logic Integration
The strategy combines trend signals with volatility filtering:
Long Entry Condition:
- Both SuperTrend 1 AND SuperTrend 2 must be bullish (trend = 1)
- AND selected VIX filter condition must be satisfied
Short Entry Condition:
- Both SuperTrend 1 AND SuperTrend 2 must be bearish (trend = -1)
- AND selected VIX filter condition must be satisfied
Available VIX filter rules include:
- "Below Mean + SD": VIX < Lower Band 1
- "Below Mean": VIX < VIX Mean
- "Above Mean": VIX > VIX Mean
- "Above Mean + SD": VIX > Upper Band 1
- "Falling VIX": VIX < VIX EMA
- "Rising VIX": VIX > VIX EMA
- "Any": No VIX filtering
█ Trade Direction
The strategy allows testing in three modes:
1. **Long Only:** Test volatility effects on uptrends only
2. **Short Only:** Examine volatility's impact on downtrends only
3. **Both (Default):** Compare how volatility affects both trend directions
This enables comparative analysis of how volatility regimes impact bullish versus bearish markets differently.
█ Usage
Use this strategy as an experimental framework:
1. Form a hypothesis about how volatility affects trend reliability
2. Configure VIX filters to test your specific hypothesis
3. Analyze performance across different volatility regimes
4. Compare results between uptrends and downtrends
5. Refine your volatility filtering approach based on results
6. Share your findings with the trading community
This framework allows you to investigate questions like:
- Are uptrends more reliable during rising or falling volatility?
- Do downtrends perform better when volatility is above or below its historical average?
- Should different volatility filters be applied to long vs. short positions?
█ Default Settings
The default settings serve as a starting point for exploration:
SuperTrend Parameters:
- SuperTrend 1 (Length=13, Multiplier=3.5): More responsive to trend changes
- SuperTrend 2 (Length=8, Multiplier=5.0): More selective filter requiring stronger trends
VIX Analysis Settings:
- Lookback Period = 252: Establishes a full market cycle for volatility context
- Standard Deviation Bands = 2 and 3 SD: Creates statistically significant regime boundaries
- VIX Trend Period = 10: Balances responsiveness with noise reduction
Default VIX Filter Selection:
- Long Entry: "Above Mean" - Tests if uptrends perform better during above-average volatility
- Short Entry: "Rising VIX" - Tests if downtrends accelerate when volatility is increasing
Feel Free to share your insight below!!!

VIX on MNQVIX on MNQ — VIX percent-move overlay on the MNQ price scale (daily-open anchor, optional inversion)
Overview
This indicator projects the VIX’s intraday percent change from the daily open onto the MNQ price scale. It takes today’s open for both VIX and MNQ, measures the VIX’s percentage move since that open, optionally inverts it (given the typical inverse relationship), and applies a scale factor to fit that move onto MNQ’s price axis. The result is a single line that reflects VIX dynamics but is plotted in MNQ points—great for reading risk-on/risk-off tone, spotting divergences, and timing mean-reversion around volatility spikes.
How it works
• Fetches VIX close on your chart timeframe and today’s open for VIX and MNQ.
• Computes pct = (VIX_close − VIX_open) / VIX_open.
• Optionally multiplies by −1 (invert) and then by a Scale Factor to compress amplitude.
• Plots MNQ_open * (1 + pct * (invert? −1 : 1) * scaleFactor) as the VIX-on-MNQ line.
• Adds a last-bar label with the current VIX value and a small info panel (VIX, % change, scaled level).
Inputs
• VIX Symbol: VIX, CBOE:VIX, or TVC:VIX (pick the one that matches your data feed).
• VIX Line Color: color of the overlay line.
• Invert VIX: flip the sign to reflect inverse correlation with MNQ.
• Scale Factor (default 0.05): tune how much of the VIX move is mapped onto MNQ points.
Why it’s useful
• Surfaces volatility-led divergences: when MNQ’s path disagrees with VIX’s risk signal.
• Helps confirm/fade breakouts and pullbacks during volatility expansions/compressions.
• Provides a quick, visual “volatility baseline” directly on the MNQ chart without juggling two panes.
Notes & limitations
• This is a percent-rebased overlay, not a hedge ratio, fair value, or spread model.
• It anchors to the current day’s open; session/timezone settings and your VIX symbol choice (CBOE:VIX vs TVC:VIX) can affect exact prints.
• The scale factor is intentionally manual—adjust until the overlay’s swings are visually informative for your setup.
Disclaimer
For educational use only. Not financial advice. Always manage risk.

VIX Counter-Trend StrategyVIX Panic Index VOO Bottom-Fishing Strategy
📊 Strategy Overview
This strategy utilizes the VIX (Volatility Index) as a market sentiment indicator to help investors rationally enter positions during periods of extreme market panic, using objective technical signals to avoid emotional decision-making. It is designed to capture rebound opportunities in VOO (or other US equity ETFs) following panic-driven selloffs.
🎯 Entry and Exit Conditions
Entry Conditions (both must be met):
VIX reaches or exceeds the set threshold (default 25, adjustable)
VIX death crosses below its moving average (default 5-day MA), confirming panic sentiment is beginning to recede
Exit Conditions (three modes available):
Holding Period Mode: Exit after holding for the set number of days (default 100 days)
VIX Decline Mode: Exit when VIX falls below the set threshold (default 20)
Either Condition Mode: Exit when either condition is met
⚠️ Important Warnings
Not Suitable for Leveraged ETF Bottom-Fishing: VIX reflects market volatility. Using leveraged ETFs (such as TQQQ, SOXL) increases risk due to decay effects and greater volatility, potentially causing larger losses during panic periods.
Bear Market Inaccuracy Risk: This strategy assumes markets will rebound from panic. However, during prolonged bear markets or systemic risks (such as the 2008 financial crisis or 2022 rate hike cycle), VIX may remain elevated for extended periods, triggering multiple buy signals while prices continue declining, rendering the strategy ineffective.
Recommended to Combine with Market Trend Analysis: Works better in bull market conditions. In bear markets, consider raising VIX thresholds or suspending use.
For Reference Only, Not Investment Advice: Historical performance does not guarantee future results. Please use cautiously according to your personal risk tolerance.
VIX 恐慌指數 VOO 抄底策略
📊 策略目的
本策略利用 VIX 恐慌指數作為市場情緒指標,幫助投資人在市場極度恐慌時理性進場抄底,並透過客觀的技術訊號避免情緒化操作。適合用於捕捉 VOO(或其他美股 ETF)在恐慌性下跌後的反彈機會。
🎯 進出場條件
進場條件(同時滿足):
VIX 指數達到設定門檻以上(預設 25,可調整)
VIX 死亡交叉其均線(預設 5 日均線),確認恐慌情緒開始回落
出場條件(三種模式可選):
持有天數模式:持有達到設定天數後出場(預設 100 天)
VIX 回落模式:VIX 降至設定門檻以下時出場(預設 20)
兩者皆可模式:任一條件滿足即出場
⚠️ 重要警語
不適合槓桿型 ETF 抄底:VIX 反映的是市場波動度,使用槓桿 ETF(如 TQQQ、SOXL)會因為衰減效應和更大波動而增加風險,可能在恐慌期間造成更大虧損。
空頭市場失準風險:本策略假設市場會從恐慌中反彈,但在長期空頭或系統性風險(如 2008 金融危機、2022 升息循環)中,VIX 可能長期處於高檔,多次觸發買入訊號卻持續下跌,導致策略失效。
建議搭配大盤趨勢判斷:在多頭格局中使用效果較佳,空頭格局建議提高 VIX 門檻或暫停使用。
僅供參考,非投資建議:歷史績效不代表未來表現,請依個人風險承受度謹慎使用。

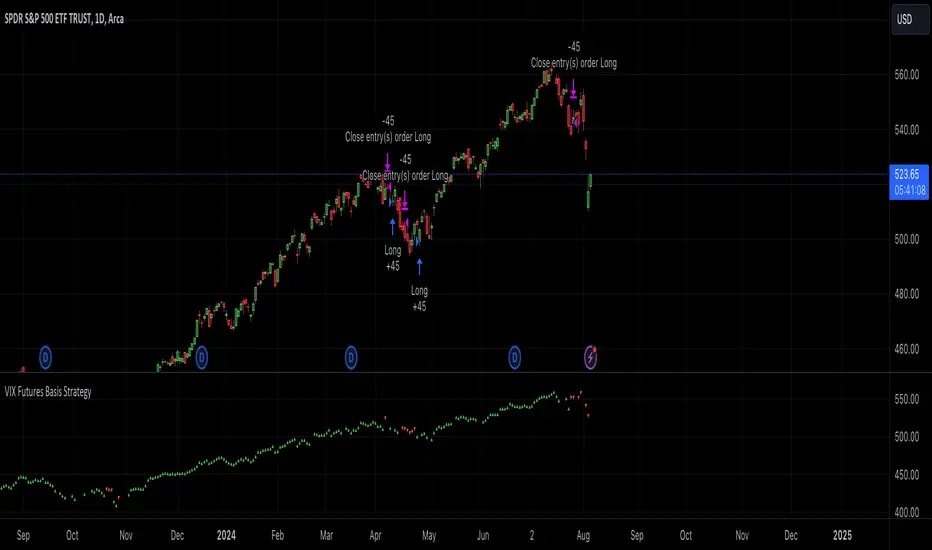
VIX Futures Basis StrategyVIX Futures Basis Strategy
The VIX Futures Basis Strategy is a trading approach that takes advantage of the unique characteristics of the VIX index and its futures market. The VIX, often referred to as the "fear index," measures market expectations of near-term volatility. This strategy focuses on how the VIX futures contracts behave in relation to the spot VIX index and seeks to capitalize on the market's contango and backwardation phases.
Key Concepts:
VIX Index and VIX Futures:
The VIX index reflects the market's expectation of volatility over the next 30 days.
VIX futures allow traders to speculate on the future value of the VIX index.
Contango and Backwardation:
Contango occurs when the futures price is higher than the spot price, often indicating that the market expects volatility to rise in the future.
Backwardation is when the futures price is lower than the spot price, suggesting that the market expects a decrease in volatility.
Basis:
The basis is the difference between the futures price and the spot price. This strategy examines the basis for two consecutive VIX futures contracts.
Strategy Overview:
The VIX Futures Basis Strategy uses the relationship between the VIX index and its futures contracts to generate trading signals:
Long Position on Contango:
When both the front month and the second month VIX futures contracts are in contango (their prices are above the spot VIX index by a specified threshold), the strategy takes a long position.
This implies an expectation that the market will move from a state of expected higher future volatility to a more stable state, allowing profits to be made as the futures prices converge toward the spot price.
Closing Position on Backwardation:
If the basis for both futures contracts indicates backwardation (their prices are below the spot VIX index by a threshold), the strategy closes any long positions.
This condition suggests that the market anticipates decreasing volatility, and closing positions helps to avoid potential losses.
VIX Percentile Rank HistogramVIX Percentile Rank Histogram
The VIX Percentile Rank Histogram provides a visual representation of the CBOE Volatility Index (VIX) percentile rank over a customizable lookback period, helping traders gauge market sentiment and make informed trading decisions.
Overview:
This indicator calculates the percentile rank of the VIX over a specified lookback period and displays it as a histogram. The histogram helps traders understand whether the current VIX level is relatively high or low compared to its recent history. This information is particularly useful for timing entries and exits in the S&P 500 or related ETFs and Mega Caps.
How It Works:
VIX Data Integration: The script fetches daily VIX close prices, regardless of the chart you are viewing, to analyze market volatility.
Percentile Rank Calculation: The indicator calculates the rank percentile of the VIX over the chosen lookback period.
Histogram Visualization: The histogram plots the difference between the flipped VIX percentile rank and 50, showing green bars for ranks below 50 (indicating lower market volatility) and red bars for ranks above 50 (indicating higher market volatility).
Usage:
This indicator is most effective when trading the S&P 500 (SPX, SPY, ES1!) or ETFs and Mega Caps that closely follow the S&P 500. It provides insight into market sentiment, helping traders make more informed decisions.
Timing Entries and Exits: Green histogram readings suggest it's a good time to enter or hold long positions, while red readings suggest considering exits or short positions.
Market Sentiment: A high VIX percentile rank (red bars) indicates market fear and uncertainty, while a low percentile rank (green bars) suggests investor confidence and reduced volatility.
Key Features:
Customizable Lookback Period: The default lookback period is set to 20 days, but can be adjusted based on the trader's average trade duration. For example, if your trades typically last 20 days, a 20-day lookback period helps contextualize the VIX level relative to its recent history.
Histogram Visualization: The histogram provides a clear visual representation of market volatility.
Green Bars: Indicate a lower-than-median VIX percentile rank, suggesting reduced market volatility.
Red Bars: Indicate a higher-than-median VIX percentile rank, suggesting increased market volatility.
Threshold Line: A dashed gray line at the 0 level serves as a visual reference for the median VIX rank.
Important Note:
This indicator always shows readings from the VIX, regardless of the chart you are viewing. For example, if you are looking at Natural Gas futures, this indicator will provide no relevant data. It works best when trading the S&P 500 or related ETFs and Mega Caps.
