Ultimate Custom MTF ScreenerThis indicator will allow you to make your custom TradingView MTF screener without coding. Add it to the chart, select up to 10 instruments, 4 timeframes, and 4 indicators, and the screener will do the rest for you. The indicator will form a lovely table with all values and highlighted signals.
The screener is highly customizable, and you can choose its position on the chart, sorting, order of the columns, and colors for the tables. You can easily change parameters for all supported indicators and their signals.
Currently, there are 21 different custom indicators available. Current list of indicators:
Average Directional Index (ADX) - displaying the value of ADX and checking if it's higher than the threshold
Average True Range (ATR) - showing the value of ATR
Awesome Oscillator (AO) - displaying the value of AO and highlighting positive/negative values.
Bollinger Bands (BB) - showing if the price is above/below/in the channel.
Breakout Pivots - Displaying when the price is below/above the most recent pivot low/high.
Commodity Channel Index (CCI) - shows the last CCI value and highlights overbought/oversold values.
Directional Movement Index (DMI) - Up/Down signal (+DI above or below -DI)
Donchian Channel (DC) - showing if the price is above/below/in the channel.
Heikin Ashi Count (HAC) - What is the current Heikin Ashi candle color and for how long was this color?
Historical Volatility (HV) - Current value of Historical Volatility
Keltner Channel (KC) -showing if the price is above/below/in the channel.
Moving Average Convergence Divergence (MACD) - Up/Down signal (MACD above / below signal)
Moving Average Crossover (MA Cross) - Displaying MA crosses signals (SMA, EMA, WMA, HMA, VWMA, SMMA, DEMA, VWAP supported)
Moving Average Distance (MA DIST) - Displaying distance to the MA (SMA, EMA, WMA, HMA, VWMA, SMMA, DEMA, VWAP supported)
Parabolic Stop and Reverse (PSAR) - Up or Down
Relative Strength Index (RSI) - Displaying the last RSI value and highlighting overbought/oversold values.
Stochastic (STOCH) - Displaying the last Stochastic value and highlighting overbought/oversold values.
Stochastic RSI (STOCH RSI) - Displaying the last Stochastic RSI value and highlighting overbought/oversold values.
SuperTrend - Current state of the SuperTrend.
Trailing Stop-Loss (TSL) - Up or Down
True Strength Index (TSI) - Displaying the last TSI value and highlighting overbought/oversold values.
We're already working on adding a few more supported indicators. If you have any ideas about the indicators you want to see in our screener, contact us, and we'll consider them.
Disclaimer
Please remember that past performance may not be indicative of future results.
Due to various factors, including changing market conditions, the strategy may no longer perform as well as in historical backtesting.
This post and the script don’t provide any financial advice.
Screener

OHL Screener by KiranScript is intended to scan Open = High and Open = Low (OHL) stocks for selected Opening Range in minutes.
I have added NSE NIFTY 50 stocks as default input for the script. Hopefully it will work with other stocks and exchanges.
Opening Range time is limited to the "1 min, 3 min, 5 min, 15 min, 30 min and 60 min" as OHL generally required for Intraday.
Stock qualified criteria OPEN = LOW (in selected Opening Range timeframe) will be listed in the table at TOP RIGHT corner of the chart screen in a green background.
Stock qualified criteria OPEN = HIGH (in selected Opening Range timeframe) will be listed in the table at BOTTOM LEFT corner of the chart screen in a red background.
Script scans stocks irrespective of current chart symbol and current time frame on the chart.
Limitations:
- Maximum 40 stocks can be scanned.
- request.security can't be placed under loop hence repeat call to request.security should be placed on separate line

Watchlist Screening Hammer & Engulfing Strategies [By MUQWISHI]A trading strategy screener is an idea of a visual alert for those who're trading particular strategies and facing a lack of capability of monitoring many symbols simultaneously, so this kind of tool could be more efficient to keep managing trading plans smoothly and quickly. I developed this screener as an idea more than providing legend strategies.
This screener indicator performs scanning 4 different strategies with customizable 10 symbols inputs, and 5 min is the preferable timeframe.
Strategies
1. Hammer at Low of the day.
2. Shooting Star at High of the day.
3. Bull Engulfing at Low of the day.
4. Bear Engulfing at High of the day.
Screener Overview
Disclaimer
I'm an amateur, and I'm not a qualified licensed investment advisor.
I don't recommend the use of showing signals as a sole means of trading decisions.

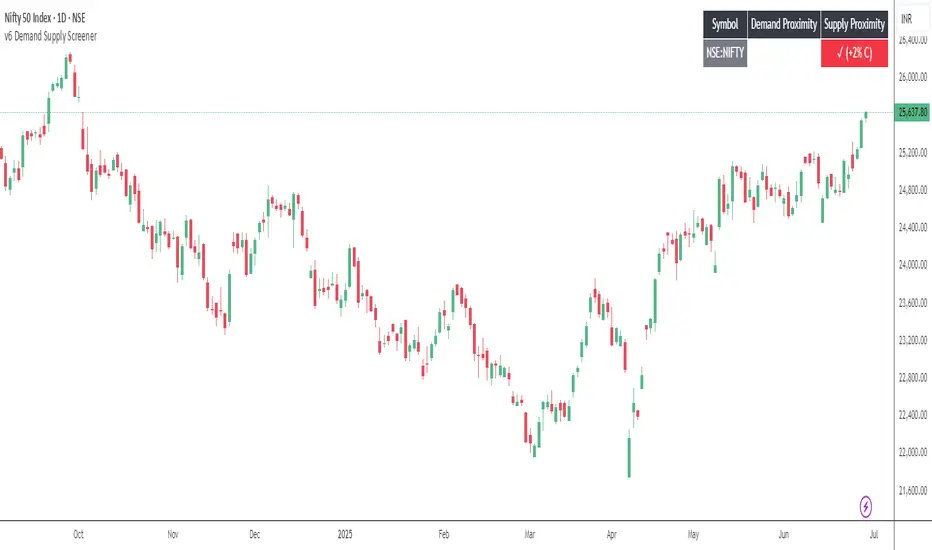
Demand Supply Screener 1.0The Demand Supply Screener helps in identifying symbols that are trading close to or inside Demand Supply Zones. You can provide a list of up to 40 symbols to the screener.
The more the number of symbols or smaller the time frame, the longer it will take for the screener to shortlist symbols. This can result in a calculation timeout. In such a case, you can reduce the number of symbols in the list by splitting it into multiple charts/indicators until the error is resolved.
Use "Proximity %" to filter symbols, for example, if you set it to 2%, the screener will shortlist symbols where the high/low of the time frame you are on is within 2% proximity of the supply/demand zone respectively.
For shortlisting symbols that are currently touching demand supply zones or trading inside of them use Proximity % as 0 and ensure Show Tested Zones is enabled.
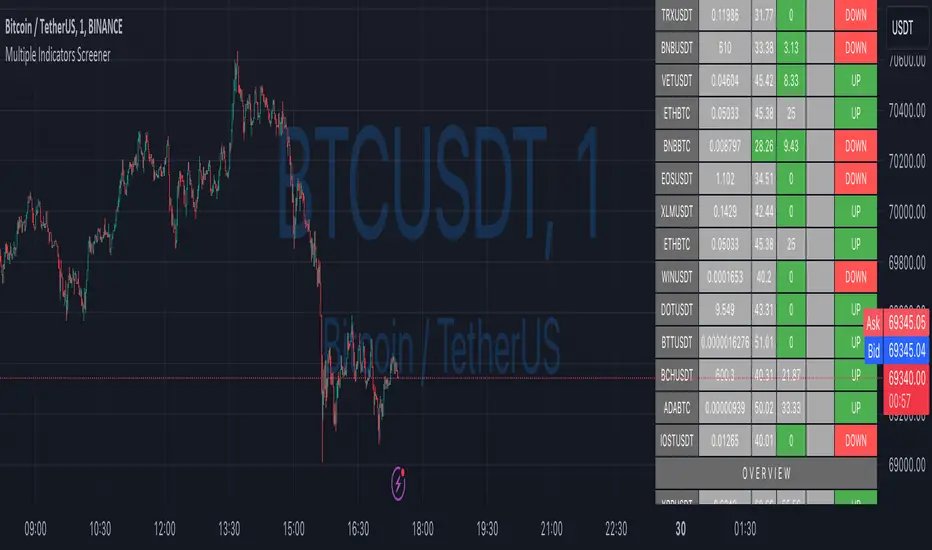
TradingCube : Crypto : Pivot ScreenerThe Crypto Pivot Screener is a real-time scanner of a list of top crypto assets.
You can use the indicator to monitor the pivots of about 40 crypto assets.
At least once a month, I will update the List of Crypto assets.
The indicator includes three types of pivots . Classic, Fibonacci, and Standard.
You have the option to select between Daily, Weekly, and Monthly time frames as well

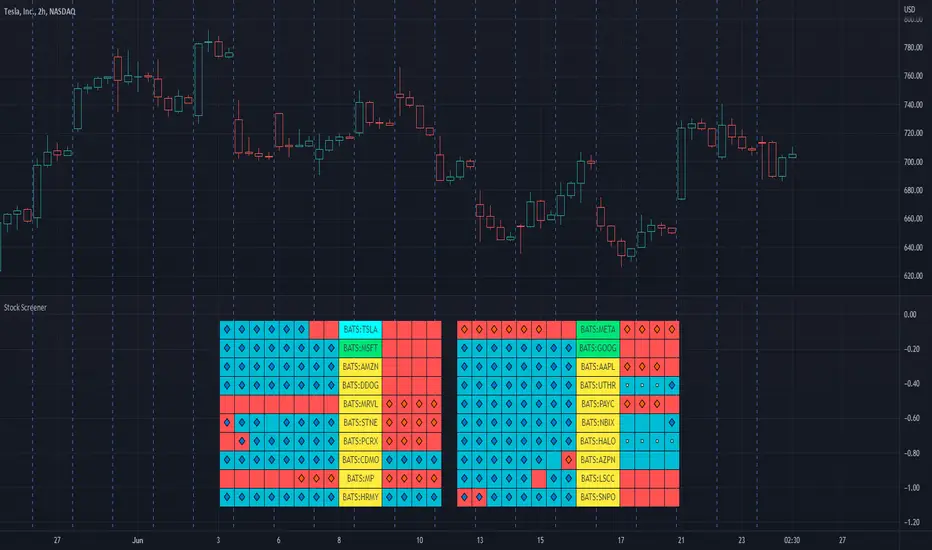
Stock ScreenerThis indicator helps monitoring QQE Mod and RMO of 20 tickers simultaneously.
This indicator shows last 4/8 indicator results of particular ticker.
Left side: 8 last colors of both indicator on current timeframe. Most left is older.
Right side: 4 last colors of both indicator on selected higher timeframe. Most right is newer.
Icon color is QQE Mod.
Background color is RMO color.
This indicator is suitable for daily or swing trade.
Recommended timeframe is 2 Hours, and recommended higher timeframe is Daily.
All-Time-High Drops and Bounces ScreenerThis screener tracks the following for up to 40 assets:
All-Time-High
Days since ATH
Percentage drop from ATH
Bounce off the low after ATH
Thanks to @QuantNomad and @MUQWISHI for building the base for this screener. I only adjusted it to show different data.

Super Sniper - Screener - MTF- Multi Asset -Multi IndicatorSuper Sniper Screener with Multi Indicator EMA Crossover, Trend, ADX, MACD, SSL, CCI, STOCHASTIC, RSI, HMA, QQE, WAE. Trade Entry/Exit with multiple Indicator for Multiple Assets and Multiple Timeframe. if you are on a Higher / Lower Time frame and are looking for Entry/Exit based on a lower timeframe then this indicator is the best. The all in one screener for EMA Crossover, Trend, ADX, MACD, SSL, CCI, STOCHASTIC, RSI, HMA, QQE, WAE
What is Sniper Entry?
if you are on a Higher / Lower Time frame and are looking for Entry/Exit based on a lower timeframe then this indicator is the best.
About this indicator.
horizontal Lines are in pink (down) and blue(up) color grey (neutral)
10 horizontal lines are plotted each for a timeframe + Asset / Currency / Stock
Back ground represents UP/DOWN Trend based on EMA 200 with the current time frame.
RED-Dot and GREEN-Dot are buy sell signals of SSL Channel for current Time Frame.
You can choose only one type of indicator (EMA Crossover, Trend, ADX, MACD, SSL, CCI, STOCHASTIC, RSI, HMA, QQE, WAE) for all the 10-lines
Select Asset and Timeframe for Each Line on the Graph.
Based on the color of the line and changes on Multi Timeframe you can ENTER/EXIT a Trade on current Timeframe.
Hence a Sniper Entry with multiple Indicator Screener

Custom Multi-Timeframe IndicatorIt's a pretty simple example of a nice custom screener you can run for multiple timeframes. This is an RSI screener, but you can easily change the function for your own Indicator.
Screener displays:
Last value of the instrument
RSI value for up to 10 instruments / 4 timeframes.
In Parameters you can change:
4 timeframes
10 instruments
Parameters for RSI
Styling parameters for table
If the selected timeframe will be lower than the current one you will receive a warning message in a table.
Thanks to @MUQWISHI to help me code it.
Disclaimer
Please remember that past performance may not be indicative of future results.
Due to various factors, including changing market conditions, the strategy may no longer perform as well as in historical backtesting.
This post and the script don’t provide any financial advice.

Ultimate Custom ScreenerThis indicator will allow you to make your custom TradingView screener without coding. Add it to the chart, select up to 40 symbols and five indicators, and the screener will do the rest for you. The indicator will form a lovely table with all values and highlighted signals.
The screener is highly customizable, and you can choose its position on the chart, sorting, order of the columns, colors for the tables, and all signals separately. You can easily change parameters for all supported indicators and their signals.
Currently, there are 19 different custom indicators available. Current list of indicators:
Average Directional Index (ADX) - displaying the value of ADX and checking if it's higher than the threshold
Average True Range (ATR) - showing the value of ATR
Awesome Oscillator (AO) - displaying the value of AO and highlighting positive/negative values.
Bollinger Bands (BB) - showing if the price is above/below/in the channel.
Breakout Pivots - Displaying when the price is below/above the most recent pivot low/high.
Commodity Channel Index (CCI) - shows the last CCI value and highlights overbought/oversold values.
Directional Movement Index (DMI) - Up/Down signal (+DI above or below -DI)
Donchian Channel (DC) - showing if the price is above/below/in the channel.
Historical Volatility (HV) - Current value of Historical Volatility
Keltner Channel (KC) - showing if the price is above/below/in the channel.
Moving Average Convergence Divergence (MACD) - Up/Down signal (MACD above / below signal)
Moving Average Crossover (MA Cross) - Displaying MA crosses signals (SMA, EMA, WMA, HMA, VWMA, SMMA, DEMA, VWAP supported)
Moving Average Distance (MA DIST) - Displaying distance to the MA (SMA, EMA, WMA, HMA, VWMA, SMMA, DEMA, VWAP supported)
Price - Displaying the last price for the instrument
Relative Strength Index (RSI) - Displaying the last RSI value and highlighting overbought/oversold values.
Stochastic (STOCH) - Displaying the last Stochastic value and highlighting overbought/oversold values.
Stochastic RSI (STOCH RSI) - Displaying the last Stochastic RSI value and highlighting overbought/oversold values.
SuperTrend - Current state of the SuperTrend.
True Strength Index (TSI) - Displaying the last TSI value and highlighting overbought/oversold values.
We're already working on adding a few more supported indicators. If you have any ideas about the indicators you want to see in our screener, contact us, and we'll consider them.
Disclaimer
Please remember that past performance may not be indicative of future results.
Due to various factors, including changing market conditions, the strategy may no longer perform as well as in historical backtesting.
This post and the script don’t provide any financial advice.
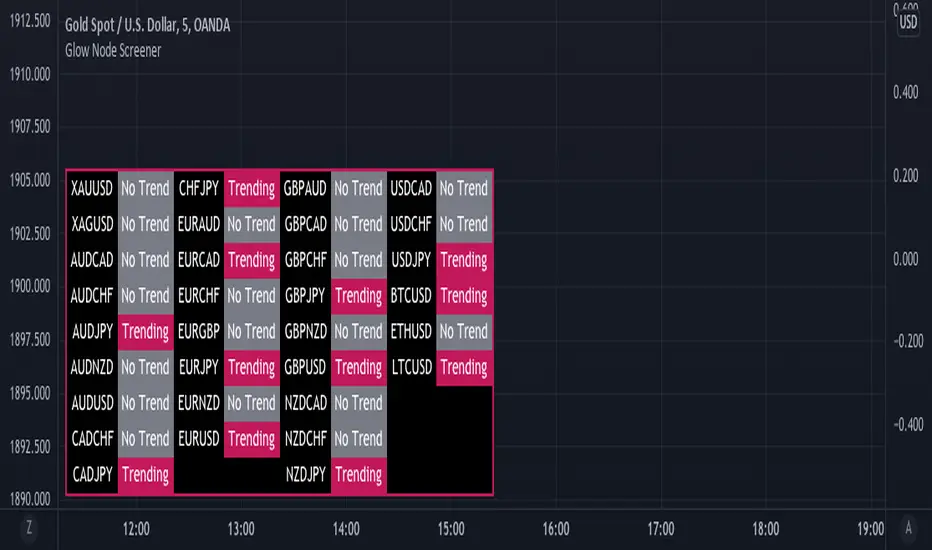
Glow Node ScreenerGlow Node Screener
Our Screener helps you identify whether a pair is in a strong trend for 32 different pairs including crypto.
Using our screener with a strategy will help you weed out bad markets that are ranging at a higher timeframe.
Which will in turn help reduce some of the bad trades you may take due to signals appearing in consolidation.
Very useful to choose which pairs you may like to trade for that day and what to avoid.
Higher Timeframe
The higher timeframe is automatically selected for you on the 15M - 30M - 1H - 4H time frames. You can override this by toggling the override button and selecting your timeframe manually
Pairs:
XAUUSD
XAGUSD
AUDCAD
AUDCHF
AUDJPY
AUDNZD
AUDUSD
CADCHF
CADJPY
CHFJPY
EURAUD
EURCAD
EURCHF
EURGBP
EURJPY
EURNZD
EURUSD
GBPAUD
GBPCAD
GBPCHF
GBPJPY
GBPNZD
GBPUSD
NZDCAD
NZDCHF
NZDJPY
USDCAD
USDCHF
USDJPY
BTCUSD
ETHUSD
LTCUSD
more will be added if requested
FVG Screener (Nephew_Sam_)// This source code is subject to the terms of the Mozilla Public License 2.0 at mozilla.org
// © nephew_sam_
FVG's are a skip in liquidity, zones where prices move quickly away from, which causes orders to not be fully filled in there. Think of it as weekend gaps, but during trading hours.
This indicator plots a table which looks for when price enters a MTF Fair Value Gap.
Note : The indicator will work fine when finding fvgs that are on a higher timeframe than your chart but if it is trying to find them on a lower timeframe it might cause repainting.
Eg. your chart is on the 1hr and its finding fvg's on the 5 min
Note: When you are on a timeframe much different from the indicator timeframe, the computation will be quite slow.
Eg. your chart is on the 5 min and the indicator is trying to find fvg's on the daily or weekly timeframe.
To fix this issue, only input timeframes that are close to your chart timeframe.
I split my chart into two, the left side indicator only has HTF (1hr, 4hr, D) and the right side indicator is LTF (5m, 15m, 30m)
The code is open source for anyone who can make this more effecient.

ORB PSAR MTF Screener+ 1.0The parabolic SAR is a technical indicator used to determine the price direction of an asset, as well as draw attention to when the price direction is changing.
Sometimes known as the "stop and reversal system," the parabolic SAR was developed by J. Welles Wilder Jr., creator of the relative strength index (RSI).
PSAR can itself prove to be great trading strategy if it is used on a multiple timeframe.
This indicator contains the followings:
1. A Screener to process multiple stocks at one go to show possible trades
2. MTF plotting of trading signals for individual stocks as well as list of stocks
3. Alert system to inform you of possible trade setups
4. Auto selection of best MTF for trades
5. Strength Candle markings.
6. Configurable options to customise as per your need.
The indicator works on the 1 Min, 5Min, 30Min, 1Hr, 4Hr, Daily, Monthly setups.
Due to TradingView restrictions and MTF usages, the screener can process a list of only 14 symbols. However , you can use the alerts option to define multiple lists of 14 stocks.
Enjoy!

Screener for 40+ instrumentsAs you probably know in TradingView there is a limit of 40 instruments in one custom screener.
I created a script that will allow you to scan more symbols.
The idea of it is pretty simple. You have to add a screener a few times on your screen with a different set of symbols. Then select column width (as % of your chart width) and # of the screener right to left.
Script will plot #1 screener next to the right border. For #2 and all next tables, the script will compute the needed offset and will draw it on the left. This way it will look like one table and not a few separate indicators.
I created a script with an RSI screener, but you can create more complicated examples with it.
Off course, that's not a silver bullet solution but might work for some of you.
Disclaimer
Please remember that past performance may not be indicative of future results.
Due to various factors, including changing market conditions, the strategy may no longer perform as well as in historical backtesting.
This post and the script don’t provide any financial advice.

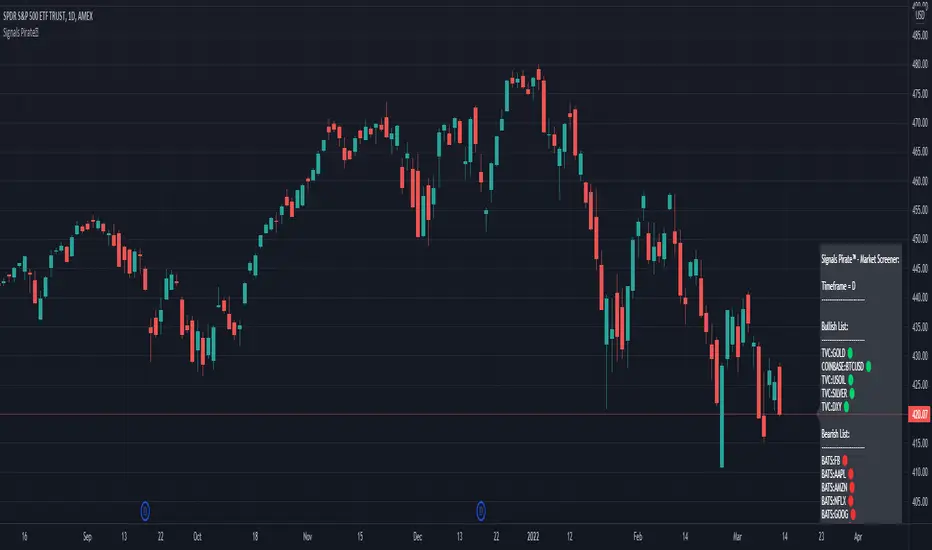
Signals Pirate™ Market ScreenerSignalsPirate™ Market Screener provides users with the ability to quickly and easily check the current trend of up to 40 different assets on any timeframe! With a simple ‘Bullish’ or ‘Bearish’ trend easily defined using accurate and reliable calculations, this tool could massively cut down the amount of time your TA takes!
The main Input options are 'Reactivity' and 'Depth', which allow for a dynamic trend following strategy that works on all time frames and assets. Using these values the strategy will print the bundles main ‘Buy’ and ‘Sell’ signals to try and identify the trend early and accurately. Their main functions are to dynamically calculate volatility and current trend direction – but we’ve gone more in-depth below!
Reactivity:
Reactivity controls how quickly the Algo reacts to changes in trend. This part of the bundle takes into account the Average True Range (ATR) to gauge current market volatility and direction of the trend. Lowering the reactivity value will generate quicker reaction times of the algorithm as it will lower the threshold of volatility required for a signal to be generated. Therefore, it’ll show trades more frequently.
Depth:
Depth controls the position of the signals according to the trend swing. Calculated using a variation of the Average Direction Index (ADX) to measure the changes in prices over a given period, when running parallel to the Reactivity volatility filter the trend can be identified quickly and accurately on any given time frame or asset. Higher Depth will allow for less frequent and slower entries. In contrast, lower Depth will give more frequent and earlier entries.
The default settings are the best settings we’ve found so far but you can change them to build your own unique trading strategy. We’d recommend experimenting with these values to find the best results for the asset you are trading, and your own personal trading and investing style.
Direction for use:
1. Use on any asset class and time frame and add the tickers of any asset you want included in the screener.
2. Fine tune the Reactivity (volatility) and Depth (trend sensitivity).
3. Consider longing assets that appear in the ‘Bullish List’ after candle close, and consider shorting assets that appear in the ‘Bearish List’ after candle close.
4. Exit positions once an asset has switched from one list to the other.
As mentioned previously, this Market Sceener uses a trend base system that dynamically operates to function with superior accuracy regardless of what you’re trading. But with the level of customisation available, this can easily be fine tuned to accommodate scalping, reversal trading, or even long term investing.
We hope you love this Screener, and it takes your trading and investing to the next level. Please let us know if you have any questions or queries regarding the logic behind the bundle, or if you have any suggestions for improvements etc. We love your feedback and are constantly striving to continuously improve!
[Screener]_[Detect_Day_Hi_Lo_Screener]_[with_Alerts]_ _
- A Screener that can scan a given list of symbols to detect Day High and Day Low as they occur.
- The Symbols can be selected from the settings
- Alerts can be configured to be informed as and when the Day High/Day Low is detected for any of the selected symbols
- This screener is best used along with my other indicator ---> " _ _ _ _ "
------------------
This screener can be configured with any condition to be alerted on.
------------------

Donchian Screener█ OVERVIEW
This is a screener script for the Donchian Channel indicator . It's an excellent indicator for trend following, a trading strategy which tries to take advantage of long, medium or short-term moves that seem to play out in various markets.
█ DESCRIPTION
The screener works by scanning through up to 10 symbols and list down symbols that are currently breaking through the upper or lower band as definied by the Donchian Channels, at which point the market signals the start of a bullish or bearish trend.
█ HOW TO USE
After adding the indicator, open the script settings and type the symbol name and length to be used on the Donchian Channels for each stock.
█ PARAMETERS
- Use High/Low Price Breakouts: check this box if you want to use price high/low instead of price close to identify breakouts
- Panel Position: choose whether you want to position the panel on the top, middle or bottom right side of the graph (default is top)
- Default Timeframe: what timeframe to use on the screener (default is daily)
- Ticker: the ticker name you want to monitor
- Length: length parameter used on Donchian Channel indicator
█ FEATURES
The screener can scan up to 10 symbols each time.
█ LIMITATIONS
The screener will scan the symbols breaking out bands on the current bar, and as such, there maybe some delays depending on the stock/ etf /crypto you choose. Some exchanges require an additional subscription to get realtime data.

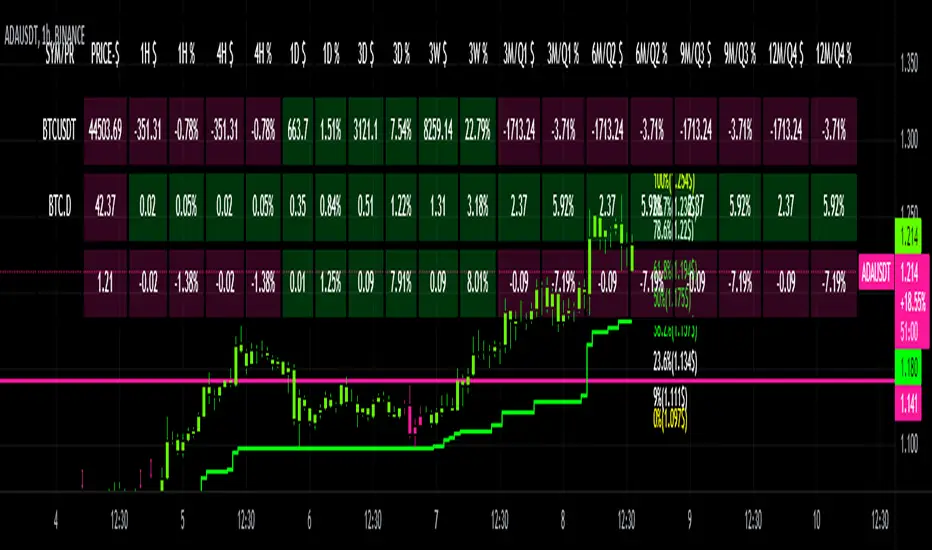
CRYPTO DASHBOARD Gs₿A Simple Crypto Dashboard/Screener which indicates the Price and percentage changes for the Given Period of time i.e for 1 Hr ,4 Hrs, 1 Day, 3 Days, 3 Weeks and 3 - 12 Months. By Default it displays #BTC and its Dominance and current trading pair Price and % changes.
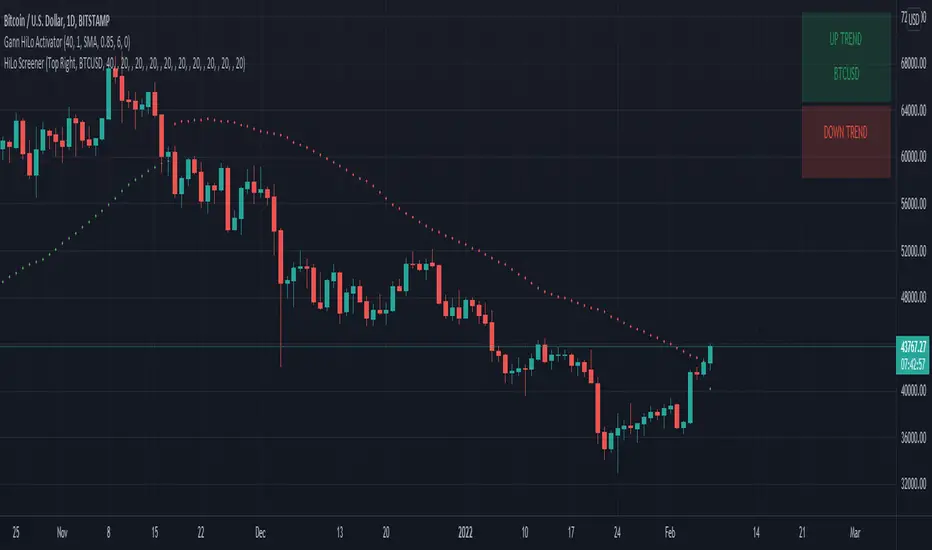
HiLo Screener█ OVERVIEW
This is a screener script for the Gann Hilo Indicator . It's an excellent trend analysis indicator to spot trend reversals.
█ DESCRIPTION
The screener works by scanning through up to 10 symbols and list down symbols that are currently breaking the high or low mean averages as definied by the Gann Hilo Indicator. Once you add it, 2 panels will be added to your chart - the green panel will list the symbols reversing into a bullish trend and the red panel will show the symbols reversing into a bearish trend.
█ HOW TO USE
After adding the indicator, open the script settings and type the symbol name and length to be used on the Gann Hilo Indicator for each stock.
█ FEATURES
The screener can scan up to 10 symbols each time.
█ LIMITATIONS
The screener will scan the symbols reversing trend on the current bar, and as such, there maybe some delays depending on the stock/etf/crypto you choose. Some exchanges require an additional subscription to get realtime data.
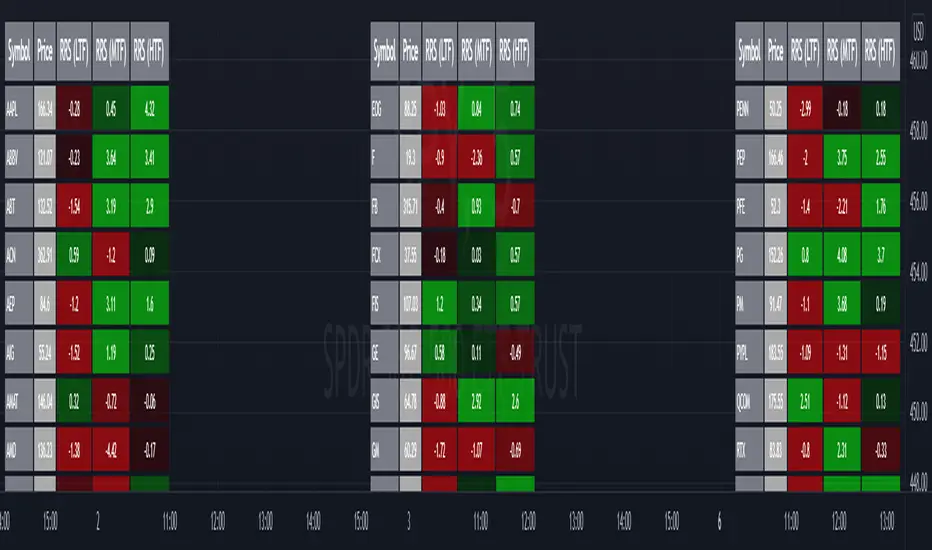
Relative Strength Screener V2 - Top 100 volume leadersNew and improved strength heatmap for the top 100 volume leaders in the S&P. Coded in a workaround to the 40 request.security limitation that currently exists in Pine. Added the ability to input the number of columns (time frames) you wish to display.
For 3 time frame analysis, add the indicator to your chart 3 times. Change the number of columns to 3 for each of these indicators. Specify the column and time frame for each one (example, 5 minute for column 1, 1 hour for column 2 and Daily chart for column 3). It will automatically resize the columns/tables to properly display the output. This provides a sort of "Strength Heatmap" for the top 100 stocks in the S&P. To achieve this, make a copy of the indicator and substitute lines 68-105 with the following premade watchlists :
Make a copy 1 - FIrst 38 volume leaders in the S&P
s01 = input.symbol('AAPL', group = 'Symbols', inline = 's01')
s02 = input.symbol('ABBV', group = 'Symbols', inline = 's02')
s03 = input.symbol('ABT', group = 'Symbols', inline = 's03')
s04 = input.symbol('ACN', group = 'Symbols', inline = 's04')
s05 = input.symbol('AEP', group = 'Symbols', inline = 's05')
s06 = input.symbol('AIG', group = 'Symbols', inline = 's06')
s07 = input.symbol('AMAT', group = 'Symbols', inline = 's07')
s08 = input.symbol('AMD', group = 'Symbols', inline = 's08')
s09 = input.symbol('APA', group = 'Symbols', inline = 's09')
s10 = input.symbol('ATVI', group = 'Symbols', inline = 's10')
s11 = input.symbol('AXP', group = 'Symbols', inline = 's11')
s12 = input.symbol('BA', group = 'Symbols', inline = 's12')
s13 = input.symbol('BBWI', group = 'Symbols', inline = 's13')
s14 = input.symbol('BBY', group = 'Symbols', inline = 's14')
s15 = input.symbol('BK', group = 'Symbols', inline = 's15')
s16 = input.symbol('BMY', group = 'Symbols', inline = 's16')
s17 = input.symbol('BRK.B', group = 'Symbols', inline = 's17')
s18 = input.symbol('C', group = 'Symbols', inline = 's18')
s19 = input.symbol('CAT', group = 'Symbols', inline = 's19')
s20 = input.symbol('CCL', group = 'Symbols', inline = 's20')
s21 = input.symbol('CFG', group = 'Symbols', inline = 's21')
s22 = input.symbol('CL', group = 'Symbols', inline = 's22')
s23 = input.symbol('CNC', group = 'Symbols', inline = 's23')
s24 = input.symbol('COF', group = 'Symbols', inline = 's24')
s25 = input.symbol('COP', group = 'Symbols', inline = 's25')
s26 = input.symbol('COST', group = 'Symbols', inline = 's26')
s27 = input.symbol('CRM', group = 'Symbols', inline = 's27')
s28 = input.symbol('CVS', group = 'Symbols', inline = 's28')
s29 = input.symbol('CVX', group = 'Symbols', inline = 's29')
s30 = input.symbol('DAL', group = 'Symbols', inline = 's30')
s31 = input.symbol('DIS', group = 'Symbols', inline = 's31')
s32 = input.symbol('DISCA', group = 'Symbols', inline = 's32')
s33 = input.symbol('DISCK', group = 'Symbols', inline = 's33')
s34 = input.symbol('DISH', group = 'Symbols', inline = 's34')
s35 = input.symbol('DLTR', group = 'Symbols', inline = 's35')
s36 = input.symbol('DOW', group = 'Symbols', inline = 's36')
s37 = input.symbol('DVN', group = 'Symbols', inline = 's37')
s38 = input.symbol('EBAY', group = 'Symbols', inline = 's38')
Make a copy 2 - Tickers 39 to 76
s01 = input.symbol('EOG', group = 'Symbols', inline = 's01')
s02 = input.symbol('F', group = 'Symbols', inline = 's02')
s03 = input.symbol('FB', group = 'Symbols', inline = 's03')
s04 = input.symbol('FCX', group = 'Symbols', inline = 's04')
s05 = input.symbol('FIS', group = 'Symbols', inline = 's05')
s06 = input.symbol('GE', group = 'Symbols', inline = 's06')
s07 = input.symbol('GIS', group = 'Symbols', inline = 's07')
s08 = input.symbol('GM', group = 'Symbols', inline = 's08')
s09 = input.symbol('GS', group = 'Symbols', inline = 's09')
s10 = input.symbol('HD', group = 'Symbols', inline = 's10')
s11 = input.symbol('IBM', group = 'Symbols', inline = 's11')
s12 = input.symbol('INTC', group = 'Symbols', inline = 's12')
s13 = input.symbol('JNJ', group = 'Symbols', inline = 's13')
s14 = input.symbol('JPM', group = 'Symbols', inline = 's14')
s15 = input.symbol('KR', group = 'Symbols', inline = 's15')
s16 = input.symbol('LUV', group = 'Symbols', inline = 's16')
s17 = input.symbol('LVS', group = 'Symbols', inline = 's17')
s18 = input.symbol('MA', group = 'Symbols', inline = 's18')
s19 = input.symbol('MCD', group = 'Symbols', inline = 's19')
s20 = input.symbol('MCHP', group = 'Symbols', inline = 's20')
s21 = input.symbol('MDT', group = 'Symbols', inline = 's21')
s22 = input.symbol('MET', group = 'Symbols', inline = 's22')
s23 = input.symbol('MGM', group = 'Symbols', inline = 's23')
s24 = input.symbol('MOS', group = 'Symbols', inline = 's24')
s25 = input.symbol('MPC', group = 'Symbols', inline = 's25')
s26 = input.symbol('MRK', group = 'Symbols', inline = 's26')
s27 = input.symbol('MRNA', group = 'Symbols', inline = 's27')
s28 = input.symbol('MS', group = 'Symbols', inline = 's28')
s29 = input.symbol('MSFT', group = 'Symbols', inline = 's29')
s30 = input.symbol('MU', group = 'Symbols', inline = 's30')
s31 = input.symbol('NCLH', group = 'Symbols', inline = 's31')
s32 = input.symbol('NEE', group = 'Symbols', inline = 's32')
s33 = input.symbol('NEM', group = 'Symbols', inline = 's33')
s34 = input.symbol('NFLX', group = 'Symbols', inline = 's34')
s35 = input.symbol('NKE', group = 'Symbols', inline = 's35')
s36 = input.symbol('NVDA', group = 'Symbols', inline = 's36')
s37 = input.symbol('ORCL', group = 'Symbols', inline = 's37')
s38 = input.symbol('OXY', group = 'Symbols', inline = 's38')
Make a copy 3 - tickers 77 to 114
s01 = input.symbol('PENN', group = 'Symbols', inline = 's01')
s02 = input.symbol('PEP', group = 'Symbols', inline = 's02')
s03 = input.symbol('PFE', group = 'Symbols', inline = 's03')
s04 = input.symbol('PG', group = 'Symbols', inline = 's04')
s05 = input.symbol('PM', group = 'Symbols', inline = 's05')
s06 = input.symbol('PYPL', group = 'Symbols', inline = 's06')
s07 = input.symbol('QCOM', group = 'Symbols', inline = 's07')
s08 = input.symbol('RTX', group = 'Symbols', inline = 's08')
s09 = input.symbol('SBUX', group = 'Symbols', inline = 's09')
s10 = input.symbol('SCHW', group = 'Symbols', inline = 's10')
s11 = input.symbol('SLB', group = 'Symbols', inline = 's11')
s12 = input.symbol('SYF', group = 'Symbols', inline = 's12')
s13 = input.symbol('T', group = 'Symbols', inline = 's13')
s14 = input.symbol('TFC', group = 'Symbols', inline = 's14')
s15 = input.symbol('TGT', group = 'Symbols', inline = 's15')
s16 = input.symbol('TJX', group = 'Symbols', inline = 's16')
s17 = input.symbol('TMUS', group = 'Symbols', inline = 's17')
s18 = input.symbol('TSLA', group = 'Symbols', inline = 's18')
s19 = input.symbol('TWTR', group = 'Symbols', inline = 's19')
s20 = input.symbol('TXN', group = 'Symbols', inline = 's20')
s21 = input.symbol('UAL', group = 'Symbols', inline = 's21')
s22 = input.symbol('UNH', group = 'Symbols', inline = 's22')
s23 = input.symbol('V', group = 'Symbols', inline = 's23')
s24 = input.symbol('VIAC', group = 'Symbols', inline = 's24')
s25 = input.symbol('WBA', group = 'Symbols', inline = 's25')
s26 = input.symbol('WFC', group = 'Symbols', inline = 's26')
s27 = input.symbol('WMT', group = 'Symbols', inline = 's27')
s28 = input.symbol('WYNN', group = 'Symbols', inline = 's28')
s29 = input.symbol('XOM', group = 'Symbols', inline = 's29')
s30 = input.symbol('SPY', group = 'Symbols', inline = 's30')
s31 = input.symbol('SPY', group = 'Symbols', inline = 's31')
s32 = input.symbol('SPY', group = 'Symbols', inline = 's32')
s33 = input.symbol('SPY', group = 'Symbols', inline = 's33')
s34 = input.symbol('SPY', group = 'Symbols', inline = 's34')
s35 = input.symbol('SPY', group = 'Symbols', inline = 's35')
s36 = input.symbol('SPY', group = 'Symbols', inline = 's36')
s37 = input.symbol('SPY', group = 'Symbols', inline = 's37')
s38 = input.symbol('SPY', group = 'Symbols', inline = 's38')
MTF Radar_vtMTF Radar is like your car dashboard for trading. It is your X-ray machine and, in one glance, you know what price is doing in all major time frames, from 5m to 1Q, without having to flip through multiple charts. Simple and visual!
The Sqz column indicates whether a stock is in consolidation(i.e. in squeeze) or in expansion (fired). Color denotes different compression levels: tight - black, medium - red, low - orange, green - fired.
T1 and T2 are two different trend systems:
T1 - green = bullish trend, red = bearish trend, gray = side ways, yellow - trend change
T2 - green = bullish trend, red = bearish trend, gray = side ways
T1 is a more sensitive system compared to T2.
Momo column shows squeeze momentum bars with matching color.
P+: momentum is positive and increasing. Light blue.
P-: momentum is positive and decreasing. Dark blue.
N+: momentum is negative and increasing. Yellow.
N-: momentum is negative and decreasing. Dark blue.
MTF Radar_vt is a light version of the full indicator and covers:
- most futures market
- 30 stocks in Dow Index
- Index and sector ETFs : SPY, QQQ, DIA, IWM, XLE, XLF, XLU, GDX, XLK, XLV, XLY, XLB, ITB, XRT, SMH, IBB, KRE, XLC, GDXJ, KBE
- Some key stocks: AAPL, AMZN, FB, GOOGL, TSLA, NVDA, NFLX
- Forex pairs: DXY,AUDCAD,AUDJPY,AUDNZD,AUDUSD,EURCAD,EURGBP,EURJPY,EURUSD,GBPJPY,GBPUSD,NZDUSD,USDCAD,USDJPY
Full version works on all stocks and assets. If you like this indicator and require the full version, please contact the author.
Credits:
-> John Carter - creator of TTM Squeeze and TTM Squeeze Pro
-> Lazybear's interpretation of the TTM Squeeze: Squeeze Momentum Indicator

Sectors ScreenerThis screener compares the corresponding market sectors in relation to the complete market.
If a sector rises or falls equal to the market, the value is on the dashed line.
If a sector rises faster or falls slower than the market, the sector's line is green and above the dashed line.
If a sector falls faster or rises slower than the market, the sector's line is red and below the dashed line.

Pivots High-Low Screener & AlertsHi fellow traders ,
Pleased to share a Pivot High - Low Screener.
The script uses the TV inbuilt Pivot function.
It Screens 25 tickers default set, these can be modified in the input dialog box.
All you need to do is attach to any chart and set the periodicity or the resolution of the chart to your desired alert() frequency requirement.
Now go to the input settings icon of the script and set your Pivot right and left parameters!
Set the alert from the menu as usual click - Any alert() function call and bingo you are done!!
Similarily change the chart periodicity to the next timeframe and set the next alert.
No more opening multiple charts and setting individual time consuming alerts().
You will get concatenated alerts or summary alerts for your tickers.
Track 25tickers with a single alert for each timeframe(Supports 40 tickers).
Happy trading with TV..
