SB Master Chart v5 (Public)SB Master Chart v5 is the latest progression of the SB Master Chart series of charts.
The original SB Master Chart and its successors was designed to be a visual aid for the savvy investor. The original concept was designed to provide valuable information so decisions could be made at a glance with utmost confidence.
As the chart progressed through versions, it has slowly shifted the responsibility of decision making from the trader to the indicator. In this version of the script, we have updated the backend decision code. The script has 3 distinct personalities coded to compliment each other, as well as keep the others in check..
The first personality is the buy algorithm. The buy personality is based on two conditions. The first algorithm first determines a trend, then it waits for a confirmation. The personality is comprised of the following indicators.
EMA 7
EMA 14
MACD
Stochastic
RSI
By default, the first personality has its visual settings disabled. Its still working, its just not displayed on the chart. It can be enabled in the settings. The background colors designate trend and confirmation.
The second personality is stubborn and its committed to making a profit. Its a hard line in the sand that configurable by you the user. Its the take profit/trailing take profit setting. It will not let other personalities sell for less than these configured values. The visual component of personality two is represented by black dots. This serves to showcase its minimum profit target when opening a trade and a trailing stop loss when the price exceeds the minimum profit target.
The third personality is the guy that does the dirty work that nobody wants to admit they do. This personality is based on the original SB Master Chart algorithm. This personality takes over when the first personality is unable to turn a profit. This personality goes to work finding appropriate places to dollar cost average. There are two settings that affect this personality.
DCA %
Risk Multiplier (use extreme caution, this could cause a margin call if used inappropriately).
DCA percent setting restricts this algorithm from buying when the price has not fallen below this threshold.
Risk Multiplier instructs this algorithm how much positions/qty to buy when it buys. At 2x, the algorithm will buy enough shares to double its current position, at 3x the algorithm will buy enough shares to triple its current position.
The visual representations of the third personality are that of red, orange, yellow and green. Red means overbought. When an orange appears just prior to a red, that orange means overbought with volume. Green means oversold and an orange preceding a green is an oversold with volume. Both the red and green represent an possible trend reversal and that's the signal to buy when its green.
This personality is comprised of the following indicators:
RSI
Stochastic
MACD
Bollinger
Volume
The code also features 3 modes. Altering the mode setting changes the way the personalities work together (or do not work together).
Normal
Aggressive
Buy the Dip
Mode Normal works exactly like described above. Each personality has its own duty and they do not interfere with each others work.
Aggressive mode adjusts the dynamic and both the first personality and the third personality share an equal part in opening starter positions.
Buy the Dip mode prevents personality one from buying. Since personality one only buys uptrends, you will never see it buying a dip. This mode puts personality 3 in the spotlight. All position are typically opened during a fast/quick market decline. Personality three is still bound by the rules of personality 2, but its responsible for buying and dollar cost averaging.
I have also included labels for every buy/sell. A green label is the script making its first purchase, yellow is points where it decided to dollar cost average and the red is where it chose to deleverage by closing out all its positions. Nothing prevents the algorithm from buying immediately after a sell, this is by design because we do not want to miss out on an uptrend, but we also do not want to be caught with too much leverage.
Also included vital statistics on the top right of the chart.
Open Positions
Cost Basis
Current Gain/Loss
Minimum Profit Target
Trailing Stop Loss
Total Trades to Date
Maximum Positions/Qty to Date
In the bottom right of the chart, I have the user configurable settings. This is important so a user can at a glance see the settings of the chart without having to open the options menu.
Together, all three personalities form a COMPLETE trading system. The system tracks purchase quantity, cost basis from the first buy, adjust with each new buy and calculates the running profit from the begining of the date set in the settings if it were to have bought and sold at every signal. The public version of the script requires the trader to use the script in real time watching for buy and sell opportunities. The private subscription version of the script has custom alerts that can be configured to alert the user on when to buy and sell and also gives the user appropriate trailing stop loss settings to automate the trading process.
I want to name the personalities at some point in time for the novelty factor, but I wanted to release the script as soon as possible for others to enjoy, so they are nameless at this point. If you have suggestions, please contact me with your suggestion. I will credit the person with the best personality with a free subscription to the private version of this indicator.
As always, understand the risks of trading and trade responsibly. Nothing in this script can predict the future. Past results do not guarantee future performance
Rsi_overbought

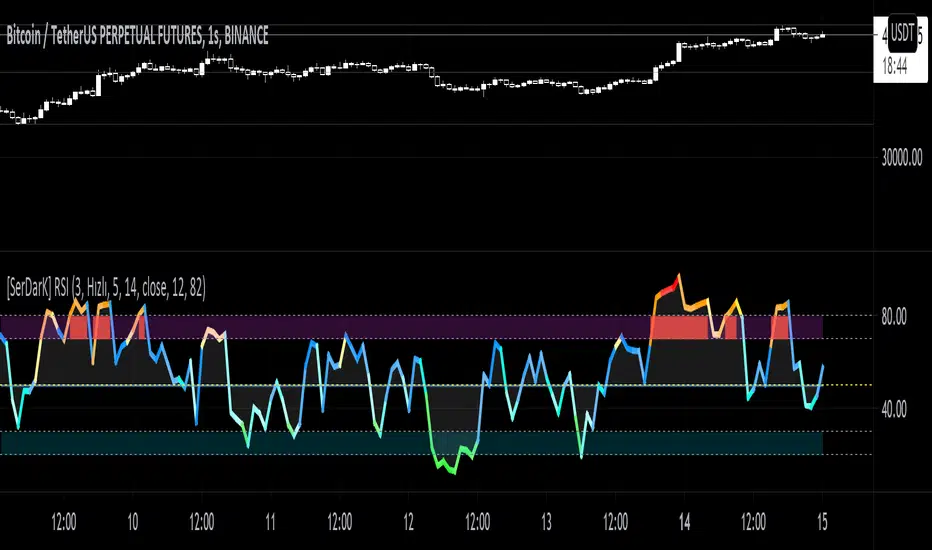
[SerDarK] RSI RSSEN: Coloring by levels, overbought, oversold, 50 level and RSS have been added to the classic RSI indicator. Two periods can be selected and almost all of the features can be adjusted from the settings.
TUR: Klasik RSI indikatörüne, seviyelere göre renklendirmeler, aşırı alım, aşırı satım, 50 seviyesi ve RSS eklenmiştir. İki periyotta seçim yapılabilmekte ve özelliklerin hemen hepsi ayarlardan düzenlenebilmektedir.
CCI/MFI/VZO/RSI - HEATMAPHeatmap I made/reverse engineered.
Currently tracks the 4 following oscillators:
- CCI (Channel Commodity Index)
- MFI (Money Flow Index)
- VZO (Volume Zone Oscillator)
- RSI (Relative Strength Index)
Any feedback or suggestions highly appreciated.
/* Inspiration taken from @ByzantineGeneral (TradingView profile: /u/ByzantineGeneral, indicator: /script/keAGdnWO-Byzantium-Oscillator-Heatmap) */

Blink RSI - SwingSwiss SuiteYOU ASKED FOR IT, WE MADE IT!
Blink RSI is life-saving. Literally.
Many of us use the RSI indicator daily.
Since I started trading, RSI has always been on my charts, but it is so frustrating not being able to see instantly what is happening on the other timeframes.
Blink RSI is here to solve this problem!
Choose up to 5 timeframes you want to monitor, and you are good to go. You will never have to switch from one timeframe to another to see how the RSI is behaving ever again.
The default configuration has a length of 14 and works on the usual 30-70 gap. Meaning that if a small square appears green, the RSI < 30 and it's a bullish sign while if the RSI > 70 it becomes red and might be bearish.
Very simple but super efficient!
Disclaimer:
Trading and investing in the financial markets involves substantial risk of loss and is not suitable for every investor.
All trading strategies are used at your own risk.
Trend Analyzer is part of the SwingSwiss Suite, contact me for more info

MACD, RSI, & RVOL Strategy
This strategy combines the use of MACD (12, 26, 9), RSI (14, 30, 70), and RVOL (14) to create Long Buy and Sell signals. This works well with many different time intervals but was developed with 15-minute intervals in mind.
Using MACD as a reference, the strategy identifies when the MACD line crosses over (a factor in a buy signal) and under (a factor in a Sell signal) the Signal line. This shows a shift in positive (cross over) and negative (cross under) of a security.
Using the Relative Strength Index ( RSI ) as an indicator, the strategy notices when the velocity and magnitude of the directional price movements cross over the Oversold signal (30) and crosses under the Overbought signal (70) as a factor in creating a Buy and Sell signal.
Using Relative Volume (RVOL) as an indicator, the strategy calculates when the current volume has crossed over the 2x average volume indicator over a given period and is then used as a factor in creating a Buy signal. RVOL is also used when the change in volume crosses under a set RVOL number (in this strategy, it is set to a RVOL of 5).
RVOL = Current Volume / Average Volume over a certain period
This strategy indicates a Buy signal when 2/3 conditions are met:
- RSI Cross Over the Over Sold signal (default 30)
- MACD Cross Over of Signal ( MACD > Signal)
- RVOL Cross Over of 2 (RVOL > 2)
This strategy indicates a Sell signal when 2/3 conditions are met:
- RSI Cross Under the Over Bought signal (default 70)
- MACD Cross Under of Signal ( MACD < Signal)
- RVOL Cross Under 5 (RVOL < 5)
Enjoy and leave feedback!

S73 Colored RSIS73 Colored RSI
Color change is based on above or below 50 mid line.
When RSI is red (below 50), I like to look for shorts, and when RSI is green (above 50), I like to look for longs.
Added extra bands for 10, 20, 80, and 90, so you can easily spot way oversold and way overbought conditions.
I look at taking profit in the overbought, oversold zones.
Hope you like it.
BTC tips - bc1q5eyfentq9mvxmnceh605yd8fted5se5rcta9j7
LTC tips - LXhWhvN86wbLNvacaZpEzhVEcefyMDPtcQ

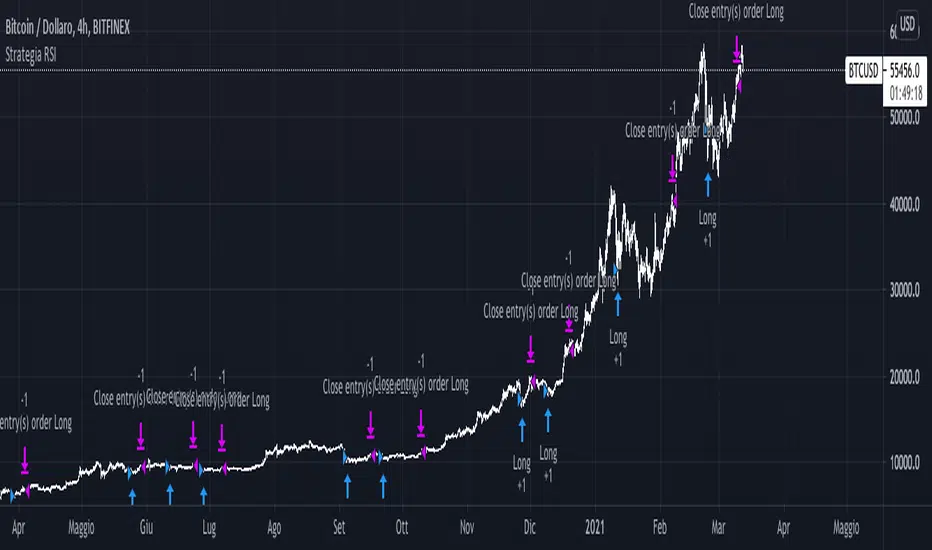
Strategia RSI sempliceQuesto semplice script sfrutta il RSI a 14 periodi per comprare (solo long) quando RSI crocia al rialzo i 30 (oversold line) e chiude l'operazione quando RSI crocia al ribasso i 70 (overbought line).
La strategia è stata progettata sul TimeFrame delle 4H (su BTC) e dimostra come una semplicissima strategia con un solo segnale poteva portare un 20% dal 2020 ad oggi su BTC/USD
RSI Classic Strategy (by Coinrule)One of the questions hobbyist traders more often ask is: what is the perfect trading indicator?
Every indicator is just a tool, so its efficiency is proportional to your ability to read its signals and translate them into an actionable trading strategy. The RSI is likely the most flexible and easy to use among the technical indicators.
This trading strategy tries to catch short-term swings on the coins of your choice with a simple yet profitable setup.
Buy when the RSI is lower than 30 (you can adjust it to 35 in times of steep uptrend).
Sell when the RSI is greater than 65 (the target may range between 60 and 75 depending on the volatility of the coin).
Note that the buy signal comes when the indicator crosses below 30 and not when it crosses above 30 as it happens on the built-in RSI strategy on Tradingview.
The present script overperforms the built-in strategy, even adding trading fees and using a lower amount of capital for each trade (30%). That means that the system can deliver higher net-profits with lower risk levels.
A typical example of market conditions where this strategy works perfectly is as follows.
The first initial breakout indicates that a new leg up in the trend may start. Bitcoin starts to trade within a range which you can identify when it reaches the point 3. That is the perfect time to start the rule because
- trading within a channel anticipates possible swings up and down
- the trend is on the upside, providing low downside risk in buying the dips.
This strategy works well with selected coins of your choice, and it's a great fit on leverage exchanges like Binance Futures.
If you prefer to run it across all available coins on the market, instead, you may choose an optimized version.

Stochastic RSI+Applies signal values to significant changes in momentum and can be used in conjunction with other indicators and analysis to improve trade timing.
Both "Signal Up" and "Signal Down" can be used for alerts.
The magnitude of the signal is the difference between K and D.
(See the code for the logic and implementation.)
Signal Up occurs when momentum is within the band and moving upward.
Signal Down occurs when momentum is within the band and moving downward.
Interpretation Note:
The Stochastic RSI is known for false signals, so it should never be used as a pure buy or sell signal. It is useful as a warning or to help with trade timing.
A good example of this is: If you are bullish on a stock, and the signal is negative (signal down), then it may be wise to not buy until the recent change in momentum has dissipated.

RSI Divergence Indicator (colorcoded and smoothed)This indicator uses a custom RSI algorithm which displays a modified RSI and stochastic RSI as a simple to read and color coded oscillator.
When RSI turns green it signals a bullish divergence and considers the asset as overbought.
When it turns red it signals a bearish divergence and considers the asset oversold.
Overbought levels at 80 and oversold levels at 20.
Displaying the RSI this way removes the hassle to manually spot for divergences in the chart.
Only use this indicator in confluence with other indicators to confirm an upcoming trend.
This indicator features alarms when the indicator turns green or red.

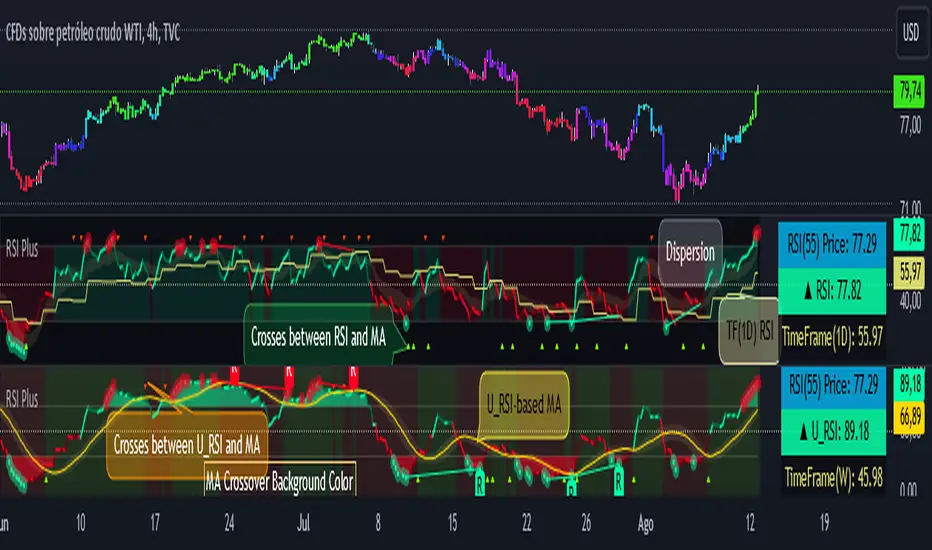
RSI PlusRSI Plus:
☑️ Show the divergences.
☑️ Shows the approximate price of an RSI level (by default it is level 55 but it can be changed for any other level).
☑️ Shows the bulls and bears zones, in green when crossing level 50 up and red when crossing down.
☑️ Circle the highest and lowest levels as possible purchases and sales.
☑️ Includes a smoothed RSI.
RSI Plus:
☑️ Muestra las divergencias.
☑️ Muestra el precio aproximado de un nivel del RSI (por defecto viene el nivel 55 pero se lo puede cambiar por cualquier otro nivel).
☑️ Muestra la zonas de toros y osos, en verde cuando cruza hacia arriba el nivel 50 y rojo cuando cruza hacia abajo.
☑️ Marca con un circulo los niveles mas alto y mas bajos como posibles compras y ventas.
☑️ Incluye un RSI suavizado.
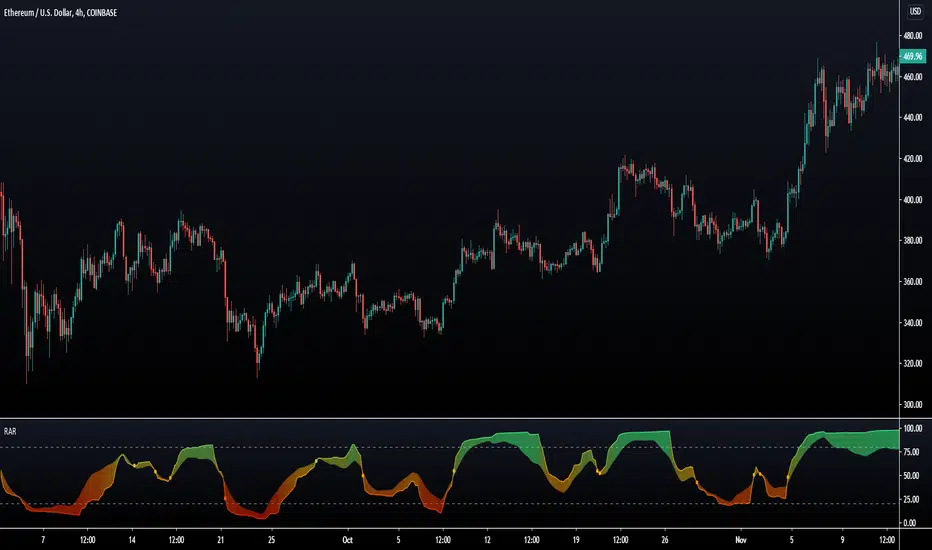
Rainbow Adaptive RSI [LuxAlgo]The following oscillator uses an adaptive moving average as an input for another RSI oscillator and aims to provide a way to minimize the impact of retracements over the oscillator output without introducing significant lag.
An additional trigger line is present in order to provide entry points from the crosses between the oscillator and the trigger line. More details are given below.
Settings
Length : period of the oscillator
Power : controls the sensitivity of the oscillator to retracements, with higher values minimizing the sensitivity to retracements.
Src : source input of the indicator
The indicator also includes the following graphical settings:
Gradient : Determines the color mode to use for the gradient, options include "Red To Green", "Red To Blue" and "None", with "None" displaying no gradient.
Color fill : Determines whether to fill the area between the oscillator and the trigger line or not, by default "On".
Circles : Determines whether to show circles highlighting the crosses between the oscillator and the trigger line.
Usage
The indicator can be used like any normalized oscillator, but unlike a classical RSI, it does not converge toward 50 with higher length values. This is caused by the RSI using a smooth input.
The power setting will minimize the impact of certain variations on the oscillator:
Here the oscillator at the bottom uses a power value of 1.5.
The trigger line is a smoothed RSI using an EMA as input, and it won't remain as near to 100 and 0 as the main oscillator. Using a moving average of the main oscillator as a trigger line would create faster crosses, but this approach allows us to have no crosses when a retracement is present.
Details
As previously discussed the main oscillator uses an adaptive moving average as input; this adaptive moving average is computed using a smoothing factor derived from an RSI oscillator, a similar adaptive moving average known as ARSI, but unlike ARSI which uses a classical RSI of the closing price for the calculation of the smoothing factor, our smoothing factor makes use of RSI on the adaptive moving average error, which provides a higher level of adaptiveness.
RSI_OverValue with Engulfing candleThis script detects potential trend reverse and Buy or Sell spots.
It works with finding overvalued RSI and Engulfing candle after that and plotting "Buy" or "Sell" signal on price chart.
* Users can change RSI values easily from setting.
Enjoy

RSI Support and Resistance Finder [JV] V1Hi Traders.
In my never ending obsession with Support and Resistance , I built an indicator to show the last Support and Resistance Lines based on RSI .
The indicator draws a new Support Line when RSI comes out of oversold and a new Resistance Line when RSI comes out of overbought.
It also shows a panel with the current Support and Resistance Levels.
It's a pretty decent indicator to detect Entry / Exit / Take Profit levels.
This indicator is not to be used as a stand-alone indicator. Add your favourite indicator to get confirmations.
RSI length and overbought / oversold levels can be adjusted in Settings.
Any suggestions or remarks are more than welcome!

RSI on VWAP Upgraded strategyFirst of all, the idea of apply RSI to VWAP was inspired by XaviZ; at least, that where I first saw that.
I simply applied the idea and searched for apply this on lower timeframe (M15) to increase the number of positions and improve the profit factor.
The conditions to enter are the same :
long : enter on RSI crossover oversold level
short : enter on RSI crossunder oversell level
To close position, I found a little change to apply :
long : close position when RSI(VWAP) went in overbought zone and crossunder the overbought level OR after being at least x bars in the overbought zone (parameter is 28 by default) => when the first condition happens
short : close position when RSI(VWAP) went in oversold zone and crossover the oversold level OR after being at least x bars in the oversell zone (parameter is 28 by default) => when the first condition happens
With this change, I got better results specially on BTCUSDTPERP (M15) where I reach a 6.8 profit factor with 119 trades closed. Not BAD !
The defaults parameters are the best found for BTCUSDTPERP (M15), but the strategy works fine for other pairs if you take time to find the rights combinations.
In this strategy you can change (with defaults in () ):
RSI length (28)
RSI overbought level (85)
RSI oversell level (30)
Number of bars before leaving as explain above (28)
The choice to take longs only, shorts only or both
The number of coin/token by position
The start date for backtesting
Please note that the script use a pyramiding parameter of 3 (can be changed in the first line of the script); that means that you can take up to 3 positions before closing. It lets you improve average enter price but increase the risk. 3 is the best I found to improve profit factor without expose myself too much.
This script would be better if automated because of the conditions of buy and sell.
It's only for educative purpose, not an advice to invest.
All my free scripts here : fr.tradingview.com
Leave a message and don't forget to follow me ;) !

PT RSx RSIVersion 1.0 of our RSx RSI indicator was developed initially as a scalper. It helps determine a possible top/bottom for a specified time frame. The indicator is a modified version of the original RSI . We added a second line to help give you a visual on a bull/bear cross.
Bull crosses at the bottom of the range indicate that the current trend is trying to reverse & vice versa.
We also added a series of Fibonacci levels that act as pivotal areas. We have two highlighted areas that offer volatility . Our Red zone (upper fibs) should prompt you to look for short entries & our Grey zone (mid fibs), which acts as a neutral/range area.
This Oscillator was built around our buy sell indicator & it is used on all time frames for swinging & scalping. It is included as part of the library. Just message us for access!

HM_RSI [By Nitish Sir]Concept by NITISH Sir;
Hilega Milega System;
LONG Entry when RSI is GREEN & Above "dash" line
SHORT Entry when RSI is RED & Below "dash" line
LONG Exit when RSI turns to RED from GREEN
SHORT Exit when RSI turns to GREEN from RED
SIDEWAYS movement when RSI line is BLACK; Wait for pullback or reversals here.
Use on Higher Timeframes only.

[Antipanic] RSI Relative Strength Index EnhancedRSI Enhanced Version
- Additional settings
- Middle line
- Bars coloring
- Overbought/oversold highlighting
- Divergence detection (SOON)
- Use it with other signals
RSI Length = 7 (twice faster than original indicator, change to 14 for default settings).
Simple signals
Blue: buy and don't sell.
Orange: sell and don't buy.
Gray: stay calm.
It is not an investment recommendation. Your use is at your own risk.
Cheers.
Share.
Like.
🤝

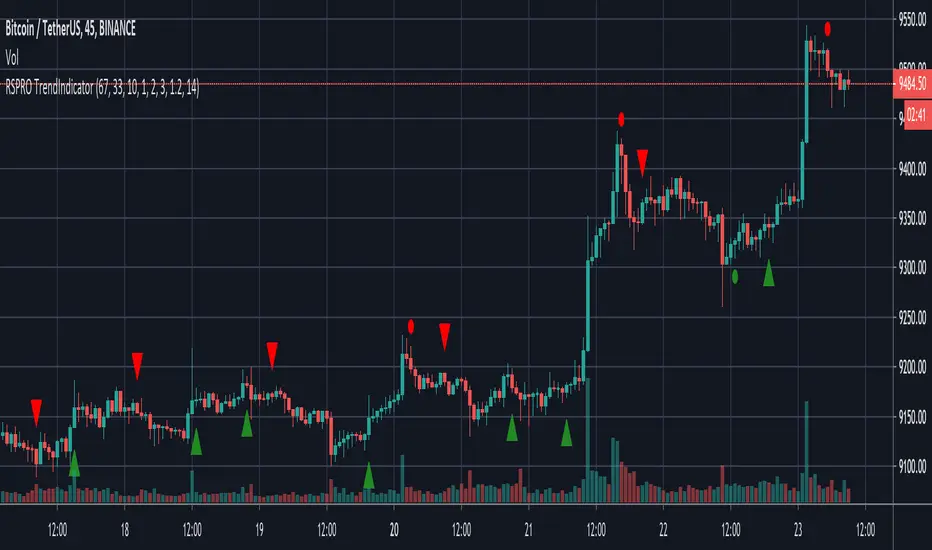
RSPRO TrendIndicatorBased on resistance/support and bollinger band fluctuations this indicator also has filter with x bars after RSI overbought/oversell zones from settings.
Indicator has alerts for LONG(BUY)/SHORT(SELL) signals with green/red squares/triangles. You can setup alerts to use different types of entries.
There are two types of entries and signals: early (usually before trend changes) and main (when trend started to reverse)
Fits for BTC and any altcoins. And any assets. Good for both scalping and position trading (depends on timeframe that you use)
Best use it with big timeframes: 45 and 90min, 2 and 4 hours for position trading.
For scalping 5-30min timeframes are good too.
In Script settings you can specify:
1) RSI period, 14 by default.
2) Show early entries (squares), enabled by defaults.
3) Show main entries (triangles), enabled by defaults.
4) Enable/Disable filter to show main entries only after RSI overbought/oversell regions
Disabled by defaults and RSI is 67 for upper zone and 33 for lower zone.
You can also specify how many bars back before current bar this filter must do. It's 10 by default, you can vary it up to 90.
You can also use only early entries (squares)
Or only main entries (triangles)
Or both (by defaults and i recommend)
This is invite only script. PM me if you want to test it.
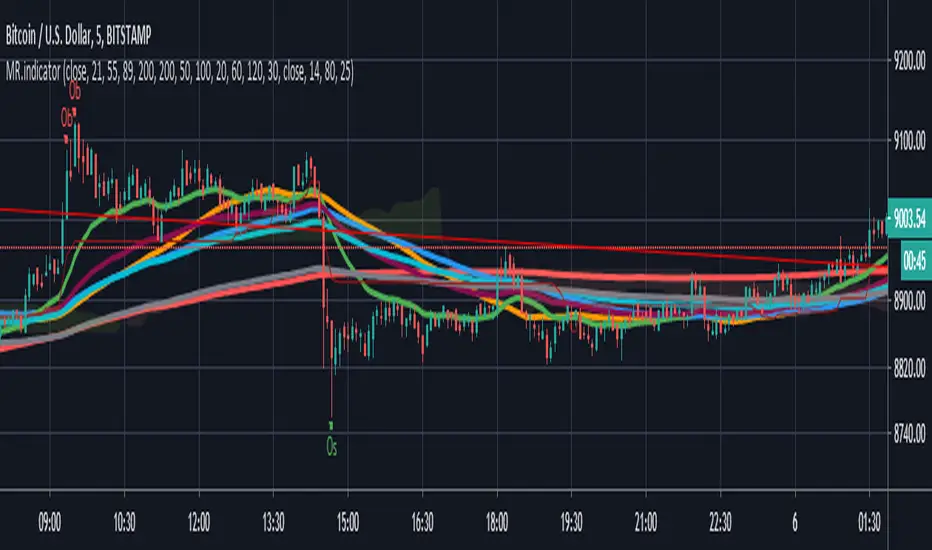
Horus RSI Stoch BTC - SPX EMA SpreadHello Traders,
Horus RSI Stoch BTC - SPX EMA Spread is an oscillator based on BITSTAMP:BTC and the SPX500USD EMA spread and may indicate Bitcoin oversold / overbought conditions compared to SPX. You can also setup an other time frame.
How it works?
- Like an RSI but only for BTC
- Setup any time frame you want
- Display Stochastic
- Display StochRSI
- Display Crosses for potential breakout / breakdown
If its indicated overbought, this does not mean it can't go higher. Same the other way around.
Use other indicators and PA for more confluence.
Wuuzzaa

VWAP Relative Strength Index [CC]This is a custom indicator of mine that uses the volume weighted average price instead of the close price as the source for calculations of the relative strength index. Buy when the indicator line is green and sell when it is red.
This was a custom request so let me know if there are any other scripts you would like to see me do or if you want something custom done!

Moving Average With Ichimoku and Rsi hey guys
i post this indicator for who like Ma-Wma-Ichi-Rsi
i used most important Ma on it .
you can see overbuy or oversold on Rsi with a Ob-Os alarm on candel
ichimoku cloud is based on crypto setup
Enjoy
Dont forget to leave a like
~~~~~~~~~~~~~~~~~~~~~~~~~~~~~~~~~~~~~~~~~~~~~~~~~~~~~~~~~~~~~~~~~~~~~
RSi :
Rsi Signals its based on Rsi oscillator that mean you can see when market is overbuy or oversell
note : its not Buy or Sell Signal indicator (please dont use it for finding entry or exit )
~~~~~~~~~~~~~~~~~~~~~~~~~~~~~~~~~~~~~~~~~~~~~~~~~~~~~~~~~~~~~~~~~~~~
Ema-Sma-Wma :
An exponential moving average (EMA) is a type of moving average (MA) that places a greater weight and significance on the most recent data points. The exponential moving average is also referred to as the exponentially weighted moving average. An exponentially weighted moving average reacts more significantly to recent price changes than a simple moving average (SMA), which applies an equal weight to all observations in the period.
~~~~~~~~~~~~~~~~~~~~~~~~~~~~~~~~~~~~~~~~~~~~~~~~~~~~~~~~~~~~~~~~~~~~~~
ichimoku cloud :
My setup on this is different with default setup . which mean i used best setup for crypto to allow you take best result from it .
note : default setup is 9-26-52-26 and my setup is 20-60-120-30
dont forget to follow me and like this post !
Double Smoothed Relative Strength IndexThe Double Smoothed RSI Indicator was created by William Blau (Stocks & Commodities V. 9:5 (202-205)) and is a variation of the classic RSI using his Momenta Indicator and his Momenta RSI formula. I have color coded everything to make it very easy to determine buy and sell signals.
Let me know if you would like to see me write scripts for other indicators!
