D-BoT Alpha ReversalsHello traders, today I'm going to share with you a strategy that I use very frequently. I wanted to share this strategy that I use in my manual trades by translating it into code. I'm sharing it with you with completely open source code.
RSI of ROC: The indicator initially calculates RSI (Relative Strength Index) on ROC (Rate of Change). This is a method that tracks the rate of price change (ROC) over a certain period and applies it to the RSI calculation.
Adaptive RSI: The code then calculates the RSI for all periods between the minimum and maximum RSI lengths. It takes the average of these calculations and names it as avg_rsi66. In addition, it checks whether each RSI value exceeds the determined overbought and oversold limits.
Signal Triggers: If both RSI of ROC and avg_rsi66 are above or below the specified overbought or oversold levels and the difference between these two values is less than the specified threshold value (Extremities Sensitivity), a signal is triggered. In addition, the color of the bar is also checked: An overbought (sell) signal is triggered for a red bar and an oversold (buy) signal is triggered for a green bar.
Signal Visualization: Signals are shown on the chart at appropriate places with "Sell" or "Buy" shapes. Also, each of these conditions is defined as an alert condition.
The general purpose of this indicator is to determine the turning points of the market. Overbought and oversold signals are based on the idea that the price may turn from these areas. That is, a "Sell" signal indicates a turning point where the price may start to fall, while a "Buy" signal indicates a turning point where the price may start to rise.
These types of indicators usually have some weak points:
False Signals: Like any kind of technical analysis indicator, this indicator can also give false signals. That is, you may get a "Buy" or "Sell" signal but the price may not move in the expected direction.
Market Conditions: This indicator may perform better under certain market conditions. For example, a trend-following indicator usually works well in trending markets, but can be misleading in range-bound markets. This indicator too can perform better or worse in a particular market situation.
Parameter Selection: The choice of the parameters of the indicator (ROC and RSI lengths, overbought/oversold levels, etc.) can significantly affect the quality of the indicator signals. Parameters should be optimized for various assets and time frames.
In conclusion, it would be better to use this indicator not as a standalone trading system, but in conjunction with other technical analysis tools or fundamental analysis. Also, it is always beneficial to test a new trading strategy on past data or on a demo account before trading with real money."
Stay tuned for more of my original strategies :)
Happy trading...
Reversaltrading

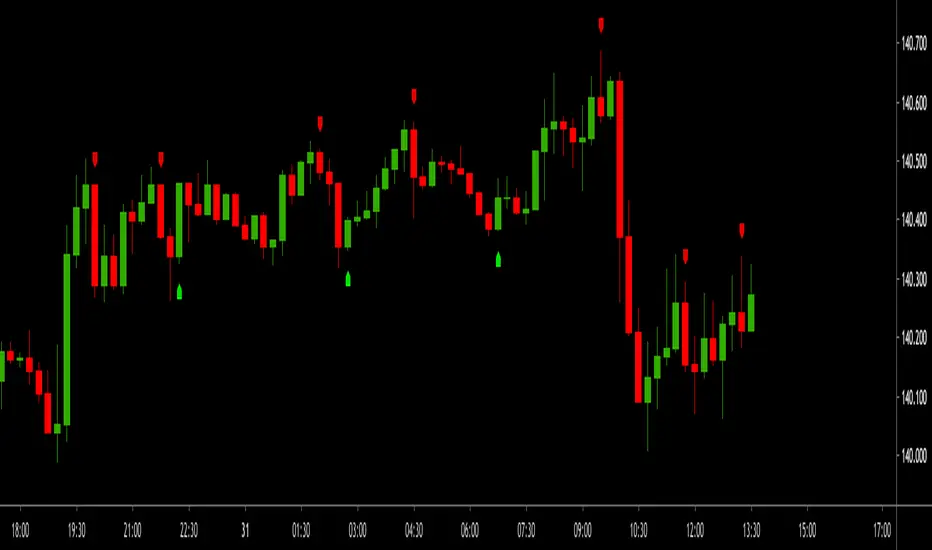
Reversal Points [CC]This original script was created based on a suggestion from @kerpiciwuasile. My original Reversal Points script was removed because I modeled it after an indicator by Demark, but this script will have no such issues. Reversal points are an exciting concept for me because it is such a useful tool when placing trades. This is my first attempt at a new overall layout for my script and I included a bunch of customization so let me know what you think.
My script works by finding lows that are surrounded by bars that have higher lows and highs that are surrounded by lower highs. I use this logic to find short term lows or highs and I use the same concept to find mid-term lows or highs but a mid-term high is a short term high surrounded by lower short term highs and a mid-term low is a short term low surrounded by higher short term lows. And of course this means that long term highs or lows use the same logic to find highs or lows that are surrounded by mid-term highs or lows. I would recommend to buy at the long term low points or sell at the long term high points.
Keep in mind of course that short term highs and lows are very common and reversal points will get rarer as you look for longer term reversal points. I would recommend to experiment and see which reversal points work best for you and of course, know that there is no magical formula to use for all stocks.
Also there are a few scenarios where you want to enable or disable the inside bar setting. You would want to ignore inside bars if the market is currently very volatile or if you are using this indicator on a crypto chart. This is not an exact science but more of a recommendation, so feel free to experiment with it.
Reversal points are crucial for traders as they signal a potential change in the market trend, providing opportunities for entry or exit.
In summary, this code snippet is a powerful tool for traders to detect and visualize reversal points on a trading chart, providing valuable insights into potential trend changes and facilitating more informed trading decisions.
Let me know if you would like me to publish other scripts or if you want me to do something custom for you!

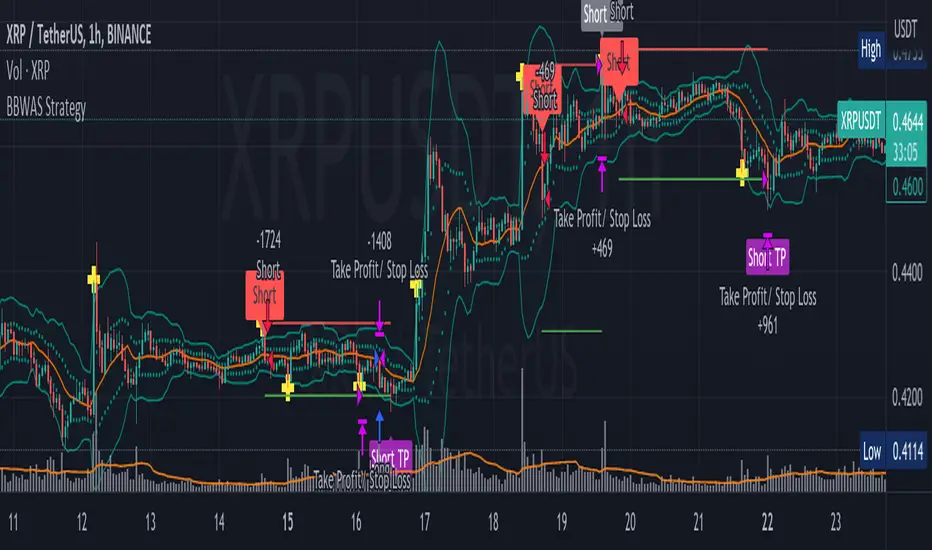
BBWAS StrategyA breakout in trading refers to a situation where the price of a security or asset moves beyond a defined level of support or resistance, which is typically indicated by technical analysis tools like Bollinger Bands . Bollinger Bands consist of three lines: the upper band, the lower band, and the middle band (or basis). The upper and lower bands are set at a specified number of standard deviations away from the middle band, and they help to define the range within which the price of an asset is expected to fluctuate.
When the price of the asset moves beyond the upper or lower band, it is said to have "broken out" of the range. If the price closes below the lower band, it is considered a bearish breakout, and if it closes above the upper band, it is considered a bullish breakout.
Once a breakout occurs, traders may look for a confirmation signal before entering a trade. In this case, crossing the middle line (or basis) after a breakout may signal a potential trend reversal and a good opportunity to enter a long or short trade, depending on the direction of the breakout.
Overall, this script provides a customizable and flexible system for traders to use Bollinger Bands to identify breakout trades, with additional features to incorporate volume and RSI divergence. The dynamic TPSL system also allows traders to manage their risk and reward by automatically setting take-profit and stop-loss levels based on the volatility of the market.
Dear traders, while we strive to provide you with the best trading tools and resources, we want to remind you to exercise caution and diligence in your investing decisions.
It is important to always do your own research and analysis before making any trades. Remember, the responsibility for your investments ultimately lies with you.
Happy trading!
Bellcurves (Zeiierman)█ Overview
Bellcurves (Zeiierman) models impulse-driven expansion and contraction in price using a pair of adaptive “Bellcurve” flows (positive/negative), momentum dots, a sensitivity/normalization layer, pre-alerts, decline detection, and a built-in divergence suite. Instead of treating every bar equally, it builds scale-aware impulse fields from a weighted price source, normalizes them into comparable magnitudes, and then highlights impulse clusters, pre-alerts (rising pressure), and impulse declines. These waves behave like impulse envelopes: when expansion persists, columns cluster and momentum dots fire; when pressure fades, decline signals and divergences appear.
Use it to spot the first thrust of a new leg, the final push before exhaustion, or quiet accumulation/distribution within ranges.
⚪ Why This One Is Unique
Bellcurves (Zeiierman) combines several adaptive mechanisms into a single, self-tuning framework that captures both momentum expansion and directional decay. Its dual Bellcurve core extracts directional strength through asymmetric smoothers and non-linear amplification, isolating genuine impulses from random volatility. A Quick-Response mode enhances sensitivity in fast markets, while the normalization layer preserves consistency across instruments and timeframes.
█ Main features
⚪ Bellcurves
The Positive and Negative Bellcurves form the foundation of the indicator, visualizing directional expansion in price. Each curve is derived from weighted price dynamics and transformed into an adaptive field that expands with trend acceleration and contracts during exhaustion. Displayed as column waves (or oscillator-style), they reveal the rhythm of market impulses; steady clustering denotes continuation, while isolated bursts or fading peaks hint at potential reversals.
Price Acceleration
Trend Acceleration
Note: To visualize trend acceleration and sustained high-momentum trends, increase the Bellcurve Trend Length parameter to 200. This setting emphasizes long-term directional strength and filters out short-term noise.
Reversals
⚪ Impulse Dots
Impulse Dots mark the first and last bursts within a momentum cluster. Detected through adaptive clustering logic, these dots appear as green (positive) or red (negative) signals that often coincide with early breakouts or terminal exhaustion zones. Traders can interpret the first dot as potential momentum ignition. Alerts are provided for each stage, enabling fast reaction to shifting impulse conditions.
⚪ Divergences
The built-in Divergence Engine automatically identifies regular bullish and bearish divergences between price and the Bellcurves. By analyzing the declining and rising segments of the curves, it detects subtle mismatches between price movements and underlying impulse strength.
█ How to Use
⚪ Trend Trading
The Bellcurves help visualize the rhythm of market trends through alternating Positive (green) and Negative (red) Bellcurves. These represent periods of directional expansion when momentum builds and contraction when momentum fades.
Tip: To enable the Trend Bellcurves, increase Bellcurve Trend Length to 100–200. To detect regime shifts earlier, consider enabling Quick Response to respond more quickly to emerging trends.
Positive Trend (Green Bellcurve): Indicates bullish control. Sustained green clusters show stable upward participation and consistent buying pressure.
Negative Trend (Red Bellcurve): Indicates bearish control. Sustained red clusters reveal dominant selling pressure and downside continuation.
Trend Transitions
Positive Trend is Strengthening: When the green Bellcurve expands and height increases, momentum is accelerating and bullish conviction is building.
Positive Trend is Weakening: When the green Bellcurve contracts or begins to shrink, upward pressure is fading and potential exhaustion is developing.
Negative Trend is Strengthening: Red columns expand and deepen below the midline, bearish momentum building, and downside pressure increasing.
Negative Trend is Weakening: When the red Bellcurve contracts or softens, it signals that bearish pressure is losing force, a possible early sign of reversal or accumulation.
⚪ Reversal Trading
Reversal trading with the Bellcurves is one of the most effective and visually intuitive strategies, especially when going long after a Negative Bellcurve. These events often occur quickly and sharply, and when combined with key price levels such as the previous day’s close, high, or low, they can provide high-probability entry opportunities.
To focus on only the most meaningful reversals, disable “Activate Sensitive Bellcurves”. This filters out minor impulses and displays only the most significant Bellcurves across the chart, helping you isolate genuine exhaustion or inflection points.
Note: Reversal trading is inherently more challenging due to the increased volatility and emotional intensity (fear and greed) surrounding turning points. Use the Bellcurves as a confirmation tool, not a standalone entry signal. Always consider the broader market context. In strong trending markets, Bellcurve peaks may reflect continued strength rather than reversal.
A Green Positive Bellcurve forming after a fast upward move and rejection from a resistance zone can indicate a potential bearish reversal.
A Red Negative Bellcurve appearing near a support level often acts as confirmation for a potential bullish reversal, suggesting downside exhaustion and renewed buying interest.
⚪ Momentum / Impulse Trading
Momentum (or Impulse) Trading is designed for traders looking to enter in the direction of a strong, ongoing move. The Bellcurves indicator helps identify significant impulses on a higher timeframe, moments where directional pressure expands decisively. Once those impulses are identified, traders can refine entries on a lower timeframe, using an opposite Bellcurve as a trigger signal. This multi-timeframe approach allows for precise entries within larger momentum phases.
Bullish Momentum Trading
Start by analyzing a higher timeframe, for example, the 15-minute chart.
Identify a Positive (Green) Bellcurve and mark the first impulse dot, signaling the beginning of upward momentum.
Drop down to a lower timeframe (such as the 1-minute chart).
Wait for a Negative (Red) Bellcurve to peak; this short-term counter-impulse serves as a pullback entry point.
Enter long as the lower timeframe Bellcurve fades, aligning your trade with the dominant bullish impulse seen on the higher timeframe.
This approach ensures that your long entries occur within an expanding bullish phase, rather than chasing late moves.
Bearish Momentum Trading
Begin on a higher timeframe, such as the 1-hour chart, and locate a Negative (Red) Bellcurve with a visible impulse dot, confirming strong bearish momentum.
Shift to a lower timeframe like the 15-minute chart.
Wait for a Positive (Green) Bellcurve to peak; this short-term upward counter-move acts as a setup for continuation.
Enter short as that green Bellcurve begins to decline, synchronizing with the dominant bearish impulse from the higher timeframe.
This ensures that short trades align with expanding downside momentum, entering at moments of retracement within a broader selling phase.
█ How It Works
⚪ Bellcurve Construction Framework
The indicator generates directional Bellcurves through an adaptive modeling process that measures price displacement and trend curvature over time. Each Bellcurve reflects the evolving balance between expansion and absorption in market flow, forming the characteristic “bell” structures that widen during directional acceleration and compress during consolidation.
Calculation: Employs a multi-layered smoothing and normalization process to enhance directional clarity while preserving overall balance within the signal field.
⚪ Momentum & Cluster Engine
Momentum dots are generated through a multi-stage transformation that identifies the initiation and termination points of impulse clusters. By scanning for statistically relevant minima and maxima within the Bellcurve stream, the system isolates bursts of meaningful directional activity.
Calculation: Applies recursive power mapping and localized clustering to detect temporal impulse boundaries and validate “first” and “last” bursts within each momentum sequence.
⚪ Divergence Module
The divergence framework maps relationships between price structure and Bellcurve dynamics to uncover weakening or strengthening flows beneath visible price action. It detects classical bullish and bearish divergences and projects them directly onto the chart as lines and markers.
Calculation: Uses anchored decline-state tracking, relative high–low comparison, and vector slope analysis to measure phase displacement between price and impulse flow, confirming divergence integrity without lag.
-----------------
Disclaimer
The content provided in my scripts, indicators, ideas, algorithms, and systems is for educational and informational purposes only. It does not constitute financial advice, investment recommendations, or a solicitation to buy or sell any financial instruments. I will not accept liability for any loss or damage, including without limitation any loss of profit, which may arise directly or indirectly from the use of or reliance on such information.
All investments involve risk, and the past performance of a security, industry, sector, market, financial product, trading strategy, backtest, or individual's trading does not guarantee future results or returns. Investors are fully responsible for any investment decisions they make. Such decisions should be based solely on an evaluation of their financial circumstances, investment objectives, risk tolerance, and liquidity needs.
Płatny skrypt

Triple RSI strategyThis strategy is commonly used both in forex and stock markets for reversal trading. when the rsi line reaches and crosses simultaneously at 3 rsi setups i.e at 7, 14, and 21, a signal is generated.
This strategy works best in 1-hour timeframe. It provides over 60 to 80 percent accuracy in 1-hour timeframe.
In the stock market, this strategy provides an excellent entry point, if one is seeking small profits.
One can expect to make around 10 to 50 pips in the forex market easily. However, I advise seeking support from price action from the lower timeframe in the forex market.
I hope you like it.
Follow for more strategies and scripts like this.

RSI MTF Ob+OsHello Traders,
This indicator use the same concept as my previous indicator "CCI MTF Ob+Os".
It is a simple "Relative Strength Index" ( RSI ) indicator with multi-timeframe (MTF) overbought and oversold level.
It can detect overbought and oversold level up to 5 timeframes, which help traders spot potential reversal point more easily.
There are options to select 1-5 timeframes to detect overbought and oversold.
Aqua Background is "Oversold" , looking for "Long".
Orange Background is "Overbought" , looking for "Short".
Have fun :)

CCI MTF Ob+OsHello Traders,
This is a simple Commodity Channel Index (CCI) indicator with multi-timeframe (MTF) overbought and oversold level.
It can detect overbought and oversold level up to 5 timeframes, which help traders spot potential reversal point more easily.
There are options to select 1-5 timeframes to detect overbought and oversold.
Green Background is "Oversold" , looking for "Long".
Red Background is "Overbought" , looking for "Short".
Have fun :)

Reversal zone finderThis script would find potential reversal price zones according to RSI over bought or sell condition and big reversal candle.
It works better in range markets and lower time frames like 5M and especially in Support/Resistance zones.
Suit for scalping in forex or crypto markets.
* Use it as a trade assistant not a trade signal!

Trend Bounce [racer8]I discovered this mechanical trading system titled "This Algo Strategy Has Only 3 rules and 62% Win Rate".
I coded the trading system on Tradingview...and now I am introducing it to you guys.
I modified the system so that it has both buy & sell signals.
I've tested it repeatedly in different markets on TV including stocks, currency pairs, bitcoin, and commodities...and it works!
A buy signal is generated whenever the current close is below the previous 7-day low and the current close is above the 200 period moving average.
A sell signal is generated whenever the current close is above the previous 7-day high and the current close is below the 200 period moving average.
The system also has a 2-ATR stop loss which I coded.
This system is unique in that it has both trend-following and reversal elements in it.
The system trades short-term reversals while obeying the long-term trend.
Essentially, you are buying the dips of bullish trends! & selling at the peaks of bearish trends!
Enjoy ♡

Sniper RSniper entry can be used on any time frame and is a continuous process of possible trend changing signals based on pure price action.
This script is a depiction of a change in trend and not a recommendation from the publisher. Do consult your financial advisor if you need to get into a trade. It is not a recommendation to trade and needs to be used as a reference along with other analysis that you may already be doing currently.
Sniper entry is a graphical expression in terms of a trend change based on price action only. You may want to combine this with other indicators to bring out best results as per need.
Sniper entry can be used on a multi time frame and is not limited to one trading day and can continue into the next day to depict a change in trend.
Note: This is not a recommendation of a buy or a sell but a study of most recent trends depending on time frame selected. Please do contact your financial advisor before placing the trade.
Trade smart, trade right.
DBT MoMo v.4 Candle Color VersionThis indicator is the older version of the DBT MoMo v.4 that colors candles instead of using shading.
For a full write up on this indicator please see:
For Access or Questions: Private message us. Thank you.

10X Trading System10X Trading System (Non Repaint)
TradingView Account Needed: Free
Not satisfied with your trading results so far? This may help:
The 10X Trading System helps you identify tops, bottoms and market direction — quickly and accurately.
The strategy behind its accuracy is the fact that it combines price action and multiple market timing algorithms to determine these significant turning points in the markets.
That way, you can be sure you have the best chance to get the best entry and exit points with perfect timing, and hopefully extract more profits from the markets than anybody else.
Once the 10X Trading system has spotted a possible top or bottom, it clearly displays these Buy or Sell alerts on your charts… showing you exactly where this may occur.
You can activate alerts to never miss a signal.
How to use the signals and alerts:
10X Trading System automatically analyze price action and multiple market timing algorithms to give you a signal when there's a good trade.
Works on all markets on all time frames so it's suitable for binary, scalping, day and swing trading.
10X Trading System allow you to get the best entry and exit points with perfect timing.
If you want more details, the link is in the signature.
Disclaimer:
Past performance is not indicative of future performance. No representation is being made that any results discussed within the service and its related media content will be achieved. All opinions, news, research, analyses, prices or other information is provided as general market commentary and not as investment advice. TradingWalk, their members, shareholders, employees, agents, representatives and resellers do not warrant the completeness, accuracy or timeliness of the information supplied, and they shall not be liable for any loss or damages, consequential or otherwise, which may arise from the use or reliance of the TradingWalk service and its content. © 2019 TradingWalk.
TradingWalk indicators are built for TradingView. TradingWalk is on no way a part of TradingView.