Liquidity Sentiment Profile | LUPENIndicator Guide: Liquidity Sentiment Profile (LSP).
What is the LSP?
The Liquidity Sentiment Profile (LSP) is a "Next-Generation" oscillator designed to look beyond simple price action. While standard indicators (like RSI or MACD) primarily focus on where a candle closes, the LSP analyzes the micro-structure of the entire candle—specifically the relationship between the candle's Body, its Wicks (Shadows), and the Volume.
The Core Philosophy:
Wicks tell the truth: A long lower wick indicates that sellers pushed the price down, but buyers aggressively absorbed that liquidity and pushed it back up.
That is hidden bullish strength.
Volume validates intent: A price move with low volume is noise. A price move (or wick rejection) with high volume is a commitment by institutional players.
The LSP calculates a "Sentiment Score" between -100 and +100 based on these factors.
How to Read the Visuals
The Colors (Intensity)
color: Light Green - Bullish Acceleration. Buyers are in control, and momentum is increasing. This is the ideal time to be in a Long trade.
color: Dark Green - Bullish Deceleration. Buyers are still in control (price is likely rising), but the momentum is fading. This is a warning sign to tighten stop-losses or take profits.
color: Light Red - Bearish Acceleration. Sellers are dominating, and panic is increasing. This is the ideal time to be Short.
color: Dark Red - Bearish Deceleration. Sellers are still in control, but the downward pressure is exhausted. Be careful with new short positions.
The Lines & Fills
The Main Line: The actual LSP sentiment value.
The Yellow Signal Line: A smoothed average of the sentiment.
The Core Fill: The colored area between the Main Line and the Signal Line. When this area "glows", the trend is strong. When it dims (Dark), the trend is weak. Bearish Deceleration. Sellers are still in control, but the downward pressure is exhausted. Be careful with new short positions.
The Lines & Fills
The Main Line: The actual LSP sentiment value.
The Yellow Signal Line: A smoothed average of the sentiment.
The Core Fill: The colored area between the Main Line and the Signal Line. When this area "glows" (Neon), the trend is strong. When it dims (Dark), the trend is weak.
How to Use It (Trading Strategies)
Strategy A: The "Power Cross" (Trend Entry)
Use this for entering trends when the market wakes up.
Long Entry: Wait for the LSP line to cross ABOVE the Yellow Signal Line.
Confirmation: The fill color must turn Neon Green.
Short Entry: Wait for the LSP line to cross BELOW the Yellow Signal Line.
Confirmation: The fill color must turn Neon Red.
Strategy B: The "Absorption" Play (Reversals)
This is where the LSP shines. It detects when liquidity is being absorbed before price turns.
Bullish Absorption: The Price makes a Lower Low, but the LSP makes a Higher Low. This happens because the LSP detects the Volume on the Lower Wicks (buyers absorbing selling pressure). This is a high-probability reversal signal.
Bearish Absorption: The Price makes a Higher High, but the LSP makes a Lower High. The volume on the Upper Wicks suggests sellers are absorbing the buy orders.
Strategy C: The "Dimming" Exit (Risk Management)
Don't wait for the price to crash to exit a trade.
If you are in a Long trade (Neon Green) and the color instantly shifts to Dark Green, it means the "fuel" is running out. Consider taking partial profits or moving your Stop Loss to break even.
Standard oscillators (like RSI) often give false signals during strong trends (showing "Overbought" while price keeps going up). The LSP avoids this because it weights Volume and Wicks. If price goes up and volume increases, the LSP stays Neon Green, telling you the move is genuine, not just overextended.
Relative Strength Index (RSI)

Take Profit XTake Profit X
Take Profit X solves the #1 problem in trading: knowing when to exit. Instead of guessing or using single indicators, it aggregates 8 technical signals to identify high-probability exit points through multi-confirmation consensus. This eliminates premature exits and emotional decision-making.
The indicator counts confirmations from your chosen technical tools:
Green dot = Multiple signals say "take profit on longs/exit shorts"
Red dot = Multiple signals say "take profit on shorts/exit longs"
Signals appear when you reach the minimum confirmations threshold you set.
Possible Settings:
Conservative (Swing Trading)
pine
Minimum Confirmations: 4
Use: RSI, MACD, CCI, Supertrend, Price Action
Disable: Stochastic, Bollinger Bands, EMA Cross
Look Back Bars: 10
Aggressive (Day Trading)
pine
Minimum Confirmations: 2
Use: All indicators ON
Look Back Bars: 3-5
RSI OB/OS: 75/25
Balanced (Most Markets)
pine
Minimum Confirmations: 3
Use: RSI, MACD, CCI, Supertrend
Price Action: ON
Look Back Bars: 5-7

Ultimate Adaptive RSIUltimate Adaptive RSI
RSI That Adapts to Any Market
This isn't your grandpa's RSI. It dynamically adjusts its sensitivity based on market conditions—smoother in trends, responsive in ranges.
Traditional RSI fails in strong trends and changing volatility. UA-RSI fixes both by adapting its sensitivity in real-time, giving you reliable signals whether the market is trending, ranging, or transitioning between regimes.
How It Adapts:
Smart Pre-Smoothing: Uses Efficiency Ratio to detect trend strength and automatically lengthens/shortens its smoothing window.
Dominant Cycle Detection: Matches its internal period to the market's actual rhythm.
Dynamic Bands: RMS-based overbought/oversold levels that expand/contract with volatility.
Smoothing Stack: ALMA pre-smoothing → Ultimate Smoother → Jurik filter creates the cleanest RSI you've ever seen.
Trade Signals:
Buy: RSI crosses above lower band or midline + price confirms
Sell: RSI crosses below upper band or midline + price confirms
Bands expand in high volatility → wait for deeper extremes
Bands contract in low volatility → take earlier signals
Signal line for crossover entries
Adaptive smoothing = fewer false signals in trends
Day trading: Use 1.0 band multiplier
Swing trading: Use 1.2-1.5 multiplier
Ranging markets: Lower multiplier to 0.8
Trending markets: Raise multiplier to 1.5+
Bands widen in volatility = wait for deeper extremes
Bands tighten in calm markets = take earlier signals
Never trade RSI alone - always wait for price confirmation

Dual Momentum Confluence Oscillator MACD + RSIThis indicator is built around the **simultaneous use of two complementary momentum perspectives**, designed to be read **together**, not in isolation.
### Core purpose
* Highlight moments where **momentum agreement** or **momentum imbalance** becomes visually evident.
* Help distinguish between **healthy movement**, **loss of strength**, and **potential transition phases**.
### Combined reading approach
* One component focuses on **momentum flow and acceleration**, showing how force develops or fades.
* The other evaluates **relative pressure within recent price action**, adding context to whether momentum is stretched or still balanced.
* Signals are meant to be interpreted when **both perspectives are considered at the same time**, reinforcing or filtering each other.
### Practical use
* Particularly useful as a **confirmation layer** for directional strategies.
* Helps avoid decisions based on a single momentum measure by requiring **contextual alignment**.
* Can also support timing refinement in both continuation and pullback scenarios.
### Visual structure
* Everything is displayed in **one compact pane**, allowing quick cross-market scanning without overloading the chart.
* Visual contrast makes changes in momentum state easy to spot at a glance.
### Best conditions
* Most effective in markets with **clear participation and readable momentum shifts**.
* Less informative during flat, low-energy phases.
*For educational and analytical purposes only. Always test across multiple markets and timeframes.*
---
Così è chiaro che **RSI e MACD lavorano insieme**, ma **nessuno può risalire a come**.

Trading Value RSI (NQ Tuned)The Trading Value RSI (NQ Tuned) is an indicator that applies the RSI calculation to trading value, defined as volume × close, rather than just price. It is specifically tuned for Nasdaq 100 futures (NQ), with a default RSI length of 24, overbought level at 75, and oversold level at 25 to filter out false signals from high volatility. The indicator visually colors the RSI line based on overbought (red), oversold (green), or neutral (blue) conditions. A horizontal midline at 50 helps identify potential trend direction changes or confirm ongoing momentum. This tool allows traders to monitor capital flow intensity, giving insight into when strong buying or selling pressure may drive short-term market moves.

SMA34 + Trend Strength Index Band + RSI50 (STRICT CLEAN)Provide Buy and sell signal basis TSI & RSI.
when TSI crosses 0 buy and sell.

OC Chain_ROC_RSI15-minute indicator that detects a 3-candle “inside” chain where each candle’s open & close remain within the previous candle’s open-close range. Plots horizontal Open/Close levels on candles when ROC(2) moves beyond a configurable ±threshold, and highlights candles when RSI is strong (>55) or weak (< user set level, e.g., 30–32). Adjustable ROC/RSI settings and line extension options.

RTSLThis script is designed to help traders trail stop-losses in a structured and disciplined manner. It adapts to price movement to protect open profits while allowing trades enough room to develop. By reducing emotional decision-making and manual intervention, the script improves trade management, enforces risk discipline, and helps traders stay aligned with their original trade logic across different market conditions.

MTF Trend DashboardThe Multi-Timeframe Trend Dashboard PRO is an advanced technical analysis tool that consolidates trend signals across six configurable timeframes into a single, intuitive heat-map dashboard. Designed for traders who need instant market clarity without switching between charts.
Core Features
🌊 Multi-Timeframe Analysis
Analyzes up to 6 customizable timeframes simultaneously (5m, 15m, 1H, 4H, Daily, Weekly)
Each timeframe independently evaluated for trend direction and strength
Weighted scoring system prioritizes higher timeframe signals
📈 Four-Pillar Technical Confluence
EMA Crossover (20/50) - Trend direction indicator (🟢 Bullish / 🔴 Bearish)
RSI (14) - Momentum analysis with exact values and overbought/oversold zones
MACD (12,26,9) - Momentum confirmation (🟢 Positive / 🔴 Negative)
Volume Analysis - Confirms move validity (🔥 High / ❄️ Low / ⚪ Normal)
🎯 Smart Signal System
🚀 STRONG BUY - All indicators strongly bullish (Score ≥2.5)
📈 BUY - Multiple bullish confirmations (Score 1.5-2.5)
🟢 Bullish - Mild uptrend (Score 0-1.5)
⚪ NEUTRAL - Sideways market (Score = 0)
🔴 Bearish - Mild downtrend (Score -1.5 to 0)
📉 SELL - Multiple bearish confirmations (Score -2.5 to -1.5)
💥 STRONG SELL - All indicators strongly bearish (Score ≤-2.5)
🎨 Heat-Map Color Coding
Bright Green = Strong uptrend with high conviction
Yellow = Neutral/Choppy conditions
Bright Red = Strong downtrend with high conviction
Color intensity reflects signal strength
💪 Strength Meter
Visual bar showing average trend strength across all timeframes (0-100%)
Helps identify powerful moves vs weak consolidations
🎯 Overall Bias
Weighted composite score emphasizing higher timeframes
Daily/Weekly signals carry 4-5x more weight than intraday
Provides "big picture" directional bias
🚨 Built-in Alert System
Strong Bullish/Bearish Confluence detected
Major trend changes across multiple timeframes
Customizable alert messages
How to Use
Trend Confirmation - Look for alignment (all rows showing same color = strong trend)
Divergence Detection - Lower timeframes differ from higher = potential reversal
Entry Timing - Wait for Overall Bias + multiple green signals with 🔥 volume
Risk Management - Avoid trades when Overall Bias shows ⚪ NEUTRAL
Customization
Adjustable EMA, RSI, MACD, Volume parameters
Flexible timeframe selection (enable/disable any TF)
Dark/Light theme support
Position and size controls
© | Built on TradingView
Precision tools for precision traders.

RSI Multi-TimeFrame [PACHI]This will show a Table with multiple time frames RSI levels.
> 68 the table cell will be red for given timeframe to indicate overbought
< 35 the table cell will be green for given timeframe to indicate oversold
there are few settings you can play with. if you have any suggestions, let me know.
// Pachi

Strategy with VWRSI and SAVE orders Long or Short or BothVWRSI is very powerful indicator coded by Algo Alpha and I Make Strategy of it
But there is no stop loss instate the Strategy is using Save orders to minimize the market manipulation
The best to used is side way market with long and short enable
The Strategy trigger long or short market order -
long - ta.crossover(rsi, 20)
short - ta.crossunder(rsi, 80)
And if is not take profit from the first trade start with the save trades until will do
the sum of the first order - base order and the save order can be adjust from the user
as well the deviation from the first order
IF some user have questions let me know

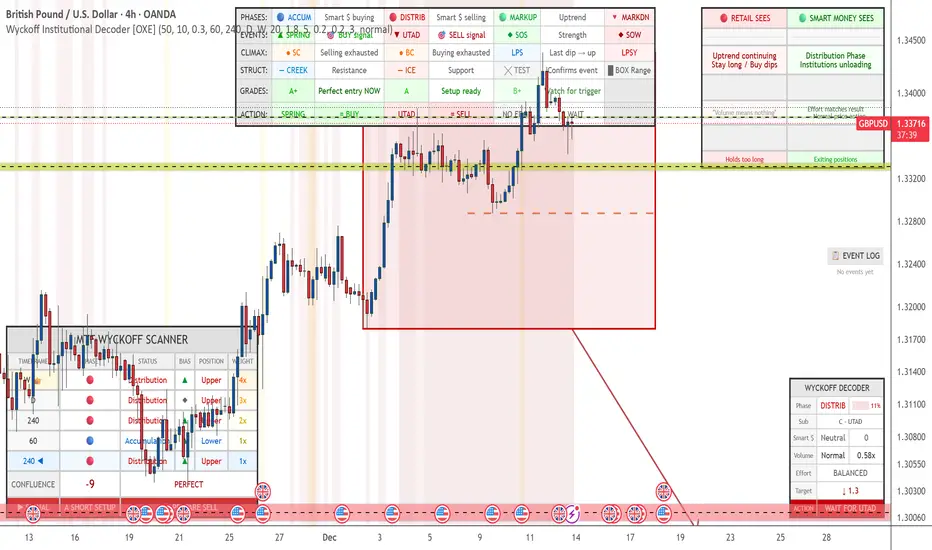
Wyckoff Institutional Decoder [OXE]4 Professional Dashboard Panels
Panel 1: RETAIL VS SMART MONEY INSIGHT (Top-Right)
This is the showstopper - side by side comparison:
🔴 RETAIL SEES🟢 SMART MONEY SEES"Support broke! 📉 SELL!""Spring trap complete ✓ Institutions buying""Breakout! 📈 BUY!""Upthrust trap complete ✓ Institutions selling""Downtrend continuing, Stay short""Accumulation Phase, Institutions loading""Just a pullback, Buy the dip!""Late Distribution, Breakdown approaching"
Plus:
Effort vs Result interpretation
Outcome prediction (Retail: "Gets stopped out 💀" vs Smart Money: "Enters at best price ✓")
Panel 2: MAIN WYCKOFF DASHBOARD (Bottom-Right)
MetricDisplayPhaseACCUMULATION / DISTRIBUTION / MARKUP / MARKDOWNStrength████ 85% (visual progress bar)Sub-PhaseA - Selling Climax, B - Building Cause, C - Spring, etc.Smart MoneySTRONG BUYING / Buying / Neutral / Selling / STRONG SELLINGVolume🔊 EXTREME / 🔉 High / 🔈 Low with ratio (2.3x)Effort/ResultABSORPTION / EASY MOVE / BALANCEDCause Built45 bars (45%) - shows target potentialTarget↑ 2,145.50 (projected price target)◆ ACTIONBUY THE SPRING / SELL THE UPTHRUST / WAIT & OBSERVE
Panel 3: EVENT LOG (Middle-Right)
Real-time chronological log of Wyckoff events:
📋 EVENT LOG
━━━━━━━━━━━━━━━━━
SPRING 🟢 | 3 bars
Test (Spring) | 8 bars
Sign of Strength | 15 bars
Selling Climax | 42 bars
Panel 4: LEGEND (Bottom-Left)
Quick reference for all chart markers:
▲ SPRING = Buy Signal
▼ UTAD = Sell Signal
◆ SOS = Strength Confirmed
◆ SOW = Weakness Confirmed
● SC/BC = Climax Volume
╳ T = Test Event
— — = Creek / Ice levels
📊 Chart Visualizations
Structure Elements
Trading Range Box - Color-coded by phase (blue=accumulation, red=distribution)
Creek Level - Dashed blue line (resistance within accumulation)
Ice Level - Dashed red line (support within distribution)
Target Projection - Arrow showing price target based on "cause"
Event Markers
SPRING ▲ - Green triangle below bar
UTAD (Upthrust) ▼ - Red triangle above bar
SOS ◆ - Green diamond (Sign of Strength)
SOW ◆ - Red diamond (Sign of Weakness)
SC/BC ● - Orange circles (Selling/Buying Climax)
Tests ╳ - Small X markers
LPS/LPSY - Labels for Last Point of Support/Supply
Volume Highlighting
Orange background = Ultra-high volume (institutional activity)
Yellow background = High volume
🧠 Smart Detection Engine
Phase Detection
Automatically identifies:
ACCUMULATION (Smart money buying)
Sub-phases: A (Selling Climax), B (Building Cause), C (Spring), D (SOS), E (Breakout)
DISTRIBUTION (Smart money selling)
Sub-phases: A (Buying Climax), B (Building Cause), C (UTAD), D (SOW), E (Breakdown)
MARKUP (Uptrend)
MARKDOWN (Downtrend)
Event Detection
Selling Climax (SC)
Automatic Rally (AR)
Secondary Test (ST)
Spring
Sign of Strength (SOS)
Last Point of Support (LPS)
Buying Climax (BC)
Upthrust After Distribution (UTAD)
Sign of Weakness (SOW)
Last Point of Supply (LPSY)
Tests (low volume confirmations)
Volume Analysis
Effort vs Result - Detects absorption (high volume, small move)
Stopping Volume - Climax with rejection wicks
No Demand/Supply - Low volume showing lack of interest
Smart Money Score - Composite Operator activity gauge (-10 to +10)
Price Targets
Cause & Effect calculation
Projects targets based on consolidation width
Shows when enough "cause" has built up
⚡ All Alerts Included
Spring detected
Upthrust detected
Sign of Strength
Sign of Weakness
Selling/Buying Climax
Spring/Upthrust Tests
LPS/LPSY
Phase changes (Accumulation → Markup, etc.)
🎨 Optimized for White Backgrounds
All colors carefully selected for:
High contrast on white charts
Easy readability
Professional appearance
No eye strain
Settings You Can Customize
Structure detection length
Pivot sensitivity
Volume spike thresholds
Spring/Upthrust sensitivity
Dashboard size (small/normal/large)
All colors
Toggle each panel on/off
Toggle each visualization element
Trade TableDisplays a trade table for a given account size and risk percentage for long or short trades along with a calculated stop loss and number of shares to purchase. An optional table showing the PSC calculations is also available.

Multi Timeframe Signal DashboardShows 10 indicators across 6 timeframes (5M, 15M, 30M, 1H, 4H, 1D):
EMA 50/100 crossover
RSI (with oversold/overbought highlighting)
MACD
DMI (DI+/DI-)
Stochastic (with extremes)
CCI
Bollinger Bands
VWAP
EMA 200 Trend
Momentum
Each cell shows ▲ (bullish/green) or ▼ (bearish/red), with scores per row and column, plus an overall BUY/SELL/HOLD signal.

Trend Change ScannerTrend Change Scanner
Focused on detecting trend reversals:
Shows reversal status: BULL REV, BEAR REV, BULL SETUP, BEAR SETUP, or Neutral
Displays: Trend direction, RSI, ADX, EMA Gap %, Bull/Bear scores
Yellow highlight when EMA gap < 0.5% (EMAs converging - potential cross)
Overall signal with action recommendation

RSI Divergence bsTzdThis indicator automatically detects bullish and bearish RSI divergences by comparing swing highs and lows in price against momentum shifts on the Relative Strength Index. It identifies both regular divergences, which signal potential trend reversals, and hidden divergences, which often confirm trend continuation.
All divergences are plotted directly on the chart using clean, non-repainting swing-point logic so signals only appear after pivots are confirmed.
The goal of the tool is to help traders quickly spot early momentum shifts that are otherwise difficult to see in real-time—especially during fast intraday moves. By combining price structure with RSI behavior, the indicator offers high-quality signals designed to improve entry timing, stop placement, and overall trend analysis.
Key Features
Automatic bullish & bearish regular divergences
Automatic bullish & bearish hidden divergences
Uses confirmed swing pivots to avoid repainting
Works on all assets and all timeframes
Clean visual markers for fast decision-making
Helps identify momentum exhaustion, trend continuation, and potential reversals
Useful for scalping, day trading, and swing trading setups

Dragon Flow Arrows (Smoothed LITE)🚀 DRAGON FLOW ARROWS — LITE | Smart Trend Engine + Clean Reversal Arrows
A lightweight but highly-optimized trend system designed for clean charts, powerful visual signals, and no-noise directional flow.
Built for traders who want simplicity, clarity, and professional-level momentum-filtered signals without over-complication.
🔥 Dragon Channel (Clean 3-Line Ribbon)
A smooth adaptive channel formed from ATR + EMA, giving you structural trend zones without clutter. No double bands, no messy overlaps just a clear upper/lower boundary.
✅ Dragon Flow Gradient
A horizontal, color-shifted flow:
🟢 Bull flow → green glow
🔴 Bear flow → red glow
Automatic blend based on trend direction
Smooth visual transitions (no vertical stripes)
✅ Momentum-Filtered Arrows (No Spam)
BUY/SELL arrows only print when:
Price breaks outside the Dragon Channel
Momentum confirms (RSI + MACD filters)
Trend flips → one clean arrow per direction
Text labels sit outside the channel for better readability.
✅ Smart Header Panel
At the top of your chart:
📌 Trend: Uptrend / Downtrend / Neutral
⚡ Impulse Strength: Weak / Normal / Strong
© FxShareRobots.com brand bar
Everything compact. Everything professional.
📊 How to Use
BUY Setup
Price moving above baseline
Dragon Flow turns bullish (cyan side)
Arrow appears below channel
SELL Setup
Price breaks below baseline
Dragon Flow turns bearish (magenta side)
Arrow pops above channel
Exit / Filter
Opposite arrow
Flow color shift
Trend panel flips
Works on Forex, Crypto, Stocks, Indices — all timeframes.
🆚 LITE vs PRO
Feature LITE PRO
Dragon Channel ✔ ✔ +Enhanced
Trend Panel ✔ ✔ +Multi-TF
Reversal Arrows ✔ ✔ + Confirmation
Momentum Filter ✔ ✔ +Expanded
Alerts ✖ ✔ +Full Suite
Reversal Zones ✖ ✔ +Predictive Map
Trade Strategy ✖ ✔ +Included + PDF
🔓 Upgrade to DRAGON FLOW — PRO
Unlock alerts, HTF confirmation, advanced momentum engine, and predictive reversal zones:
👉 fxsharerobots.com/itp/
❤️ If this helped your trading — please Like & Follow!
This supports future updates and keeps the LITE version source code free for the community.
Happy trading,
FxShareRobots Team

Gold Sniper V21: M15 Holding MasterGold Sniper Entry (Follow Trend to enter)
My Indicator :
- Clarify the M30 in Up/Down Trend
- Only entry the trade in M1/M5 Timeframe to make a Sniper Entry.
- Indicator will show when to TP before the Trend Change

RSI Median DeviationRSI Median Deviation – Adaptive Statistical RSI for High-Probability Extremes
The Relative Strength Index (RSI) is a momentum oscillator developed by J. Welles Wilder in 1978 to measure the magnitude of recent price changes and identify potential overbought or oversold conditions. It calculates the ratio of upward to downward price movements over a specified period, scaled to 0-100. However, standard RSI often relies on fixed thresholds like 70/30, which can produce unreliable signals in varying market regimes due to their lack of adaptability to the actual distribution of RSI values.
This indicator was developed because I needed a reliable tool for spotting intermediate high-probability bottoms and tops. Instead of arbitrary horizontal lines, it uses the RSI’s own historical median as a dynamic centerline and measures how far the current RSI deviates from that median over a chosen lookback period. The main signals are triggered only at 2 standard deviation (2σ) extremes — statistically rare events that occur roughly 5 % of the time under a normal distribution. I selected 2σ because it is extreme enough to be meaningful yet frequent enough for practical trading. For oversold signals I further require RSI to be below 42, a filter that significantly improved results in my mean-reversion tests (enter on oversold, exit on the first bar the condition is no longer true).
The combination of percentile median + standard deviation bands is deliberate: the median is far more robust to outliers than a simple average, while the SD bands automatically adjust to the current volatility of the RSI itself, producing adaptive envelopes that work equally well in ranging and trending markets.
Underlying Concepts and Calculations
Base RSI: RSI = 100 − (100 / (1 + RS)), RS = average gain / average loss (default length 10).
Percentile Median: 50th percentile of the last "N" RSI values (default 28 = 4 weeks)
→ dynamic, outlier-resistant centerline.
Standard Deviation Bands: rolling stdev of RSI (default length 27 = = 4 weeks (almost))
→ bands = median ± 1σ / 2σ.
Optional Dynamic MA Envelopes: user-selectable moving average (TEMA, WMA, etc., default WMA length 37) for additional momentum context.
Trend Bias Coloring
Independent of the statistical extremes, the RSI line itself is colored green when above the user-defined Long Threshold (default 60) and red when below the Short Threshold (default 47). This provides an instant bullish/bearish bias overlay similar to classic RSI usage, without interfering with the main 2σ extreme signals.
Extremes are highlighted with background color (green for oversold 2σ + RSI<42, magenta for overbought 2σ) and small diamond markers for ultra-extremes (RSI <25 or >85).
Originality and Development Rationale
The indicator was built and refined through extensive testing on dozens of assets including major cryptocurrencies:
(BTC, ETH, SOL, SUI, BNB, XRP, TRX, DOGE, LINK, PAXG, CVX, HYPE, VIRTUAL and many more),
the Magnificent 7 stocks,, QQQ, SPX, and gold.
Default parameters were chosen to deliver consistent profitability in simple mean-reversion setups while maximizing Sortino ratio and minimizing maximum drawdown across this broad universe — ensuring the settings are robust and not overfitted to any single instrument or timeframe.
How to Use It
Ideal for swing / position trading on the 1h to daily charts (the same defaults work).
Oversold (high-probability long): RSI crosses below lower 2σ band AND RSI < 42
→ green background
→ enter long, exit the first bar the condition disappears.
Overbought (high-probability short): RSI crosses above upper 2σ band
→ magenta background
→ enter short, exit on opposite signal or at median. (Shorts were not tested, it's only an idea)
Use the green/red RSI line coloring for quick trend context and to avoid fighting strong momentum.
Always confirm with price action and manage risk appropriately.
This indicator is not a standalone trading system.
Disclaimer: This is not financial advice. Backtests are based on past results and are not indicative of future performance.

Rahul Prakash's BUY/SELL signal for momentum tradeBuy or Sell signal with just on one confirmation candle.
Show a Buy singal then wait for the confirmation candle, is a strong Buy signal.
Show a Sell singal then wait for the confirmation candle, is a strong Sell signal.
You can use as a free version and earn money. Please are taking lots of price for this type of indicator.

VCAI RSI Divergence +VCAI RSI Divergence+ is an RSI that shows trend, momentum, and divergence using V-CoresAI colour logic instead of a single white line.
What it shows:
Yellow RSI line → bullish momentum (RSI above its MA; buy-side pressure in control)
Purple RSI line → bearish momentum (RSI below its MA; sell-side pressure in control)
Thin blue line → fast RSI moving average that drives the colour flips
Dashed 70/30 lines → classic OB/OS zones
Background bands → soft purple in OB, soft yellow in OS to mark exhaustion areas
How to read it:
Yellow & rising → momentum shifting bullish; pullbacks into yellow OS band can be accumulation zones
Purple & falling → momentum shifting bearish; pushes into purple OB band can be distribution/sell zones
Hard colour flips (yellow ↔ purple) mark trend regime changes, not minor RSI noise
Divergence mode (on/off)
The divergence engine scans RSI and price pivot structure:
Bullish divergence (yellow) → price lower low + RSI higher low
Bearish divergence (purple) → price higher high + RSI lower high
Lines and tags appear only where a meaningful disagreement between price and RSI exists, giving early context for potential reversals or fade setups.
Together, the momentum colours + optional divergence mapping give a far clearer market read than a standard RSI, with zero clutter and no guesswork.

StrategyScript77 Is a rule-based strategy built on top of an Ichimoku based engine.
Ichimoku concepts are used as the backbone for trend and momentum filtering, so the strategy tends to stay on the side of the dominant move instead of fighting it.
The name “Super77” comes from the behavior I consistently observed in testing because the win rate tends to hover around the 70–80% range, often clustering around ~77% when used as intended.
It’s not a promise or guarantee, but it reflects the core design philosophy: frequent, relatively small but steady wins, with controlled and manageable losses.
Trading Style – Built for Conservative Traders
Super77 is intentionally designed for traders who prefer a conservative and calm approach:
Entries only at bar close
The strategy waits for bar close confirmation before entering a position. No intrabar guessing, no chasing half-formed signals. If the signal is still valid at close, only then will it enter.
Exits automated on bar close
Exits are also managed on bar close, which makes the logic transparent, easy to review on the chart, and more robust in backtesting compared to tick-based or intrabar hacks.
Semi-auto friendly
If you like to keep some discretion, you can treat it as semi-automatic:
Let the strategy generate entry signals
Manually cancel or skip certain trades if market context changes (news, extreme volatility, etc.)
This combination makes Super77 suitable for traders who don’t want to stare at the screen all day but still want structure and automation.
How to Use
Works best with bar-close execution (avoid trying to simulate intrabar fills if you want consistent behavior).
Designed for conservative, trend-aligned trading, not for hyper-scalping or news gambling.
Can be used as:
Fully automated (let all entries/exits trigger on bar close), or
Semi-automated (use alerts/signals but manually cancel some entries).
Step-by-Step: Automation with Cornix (Webhook Setup)
You can automate Super77 using Cornix by connecting TradingView alerts to your Cornix group via webhook.
Note: Exact button names may differ slightly depending on Cornix / TradingView updates, but the flow is always the same:
Cornix group → get webhook URL & mapping → TradingView alerts → signals sent to Cornix.
(Optional) Map specific pairs / directions
If you use UUID / signal mapping per symbol and per side (long/short), set them up in Cornix according to your own template.
Super77 can be used either:
On a single pair (simple setup), or
On multiple pairs if your alert / webhook structure supports that. So you can pick many pairs with 1 script.
Final Notes & Disclaimer
Super77 is an educational and experimental trading tool, not financial advice.
Past performance in back tests does not guarantee future results.
Always:
Test on demo or paper first
Adjust risk to match your own profile
Accept that losses and drawdowns are a natural part of any strategy
If you’re looking for a strategy that reflects a conservative, confirmation-based trading style with a focus on steady win rate and smoother equity behavior, Super77 was built exactly with that mindset in mind.

Alloyz Traders_RSI by Sagar BRSI for Intraday purpose with moving average and volume weightage price added in RSI.
