Currency Strength Indicator by LukasA better way to trade major pairs.
Similar to RSI CSI, with less noise and real price action movement.
Some explanation. Set thickness of "Color 0" from each currency to know the strength.
Use on 30m timeframe and above to see the power of each currency.
Suggestion : Set timeframe 30m for 1h play (your timeframe : 2), so you can get early signal.
Always looking for upward movement from currency above 20 or 0
Vs. currency bellow 0 or -20.
--
Stay Profit.
Any feedback are welcome.
Porównanie względnych sił

Viral Trend TraderSimple indicator.
Chose ADX Length and Timeframe and it will show translucent black candles for downtrends and white candles for uptrends.
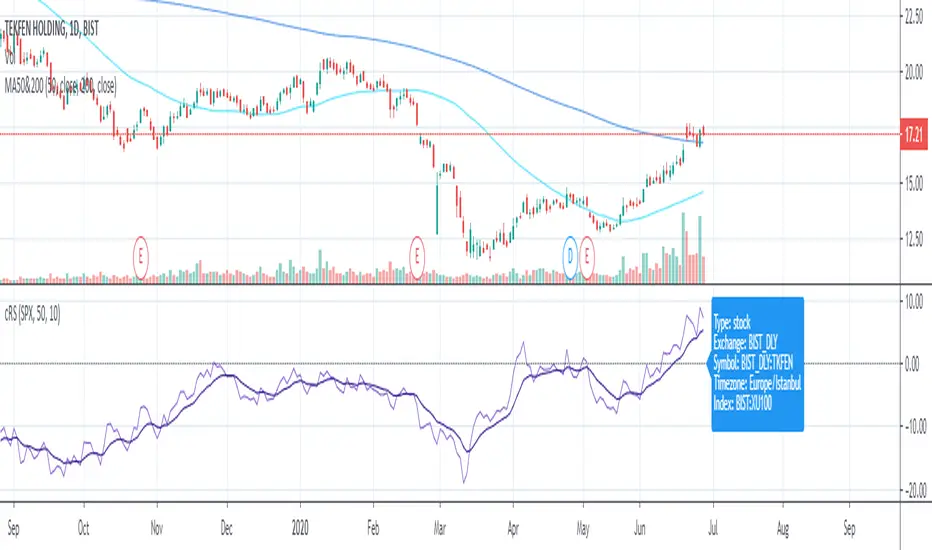
Relative Strength Auto ComparisonRelative Strength Comparison with automatic selection of relevant index
Added support for most european and north american exchanges.
SPY RelativeShows an instrument's sentiment in a day (or week) compared to the market (SPY default). The Red line shows bearish sentiment compared to the market and the green is bullish. Technically this works like a proxy for Alpha/Beta factor.

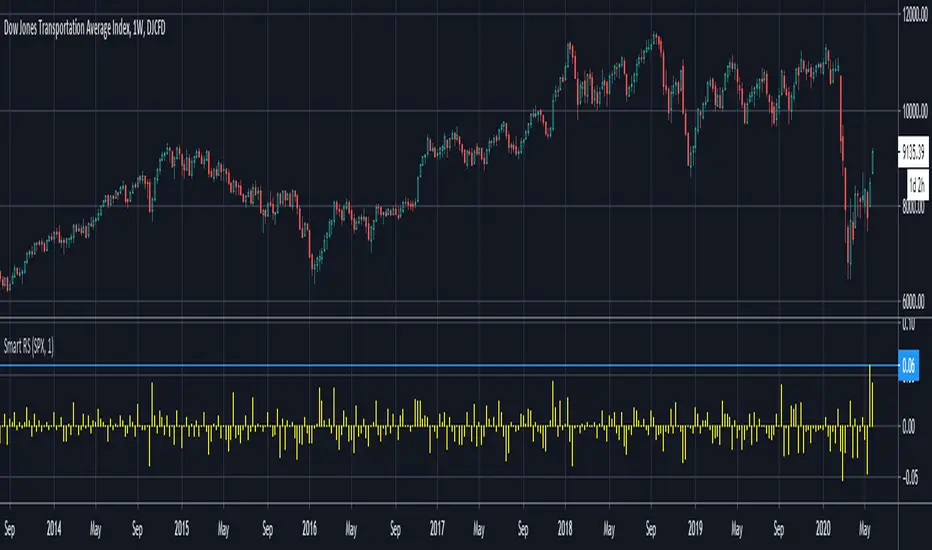
Smart Relative Strength Can Remove False SignalsRelative strength is one of the most useful indicators in the market, highlighting when stocks and sectors are outperforming or underperforming a broader index.
Traditional RS compares the percentage change of one symbol over a given time frame and subtracts the percentage change of the S&P 500 over the same period.
This is handy, but it can produce false signals at times of volatility. For example, when the broader market is crashing, certain sectors may “outperform” simply by falling less than the S&P 500.
Smart Relative Strength addresses this shortcoming by requiring that the symbol’s absolute AND relative returns both be positive. Otherwise a zero is returned.
This was useful last week on the Dow Jones Transportation Average . Using simple relative strength, it had its best one-week performance against the S&P 500 since October 2008. This was obviously a false signal because October 2008 was a time that everything else was crashing.
Smart Relative Strength showed that, excluding periods of overall decline, DJT had its best week since January 2008.
Note: This chart uses a 1-period interval, while the code defaults to 21 periods.
JSE Top 40 Comparative Relative Strength RSI OscillatorThis code is the result of an idea by @MarcoOlivano. The question was that if putting the comparative relative strength as an RSI oscillator would help in understanding the relative strength of the stock to the overall market? As we both trade the JSE I have made the JSE:J200 or Top 40 the basis for comparison. This can be changed in the settings dropdown if you want to compare with the All Share Index (JSE:J201) or other markets such as the S&P.
On the chart above I have included the Comparative Relative Strength as a reference together with the Comparative Relative Strength RSI.
If you use the indicator or adapt it please let me know if it works for you, how you use it and if it has any value.

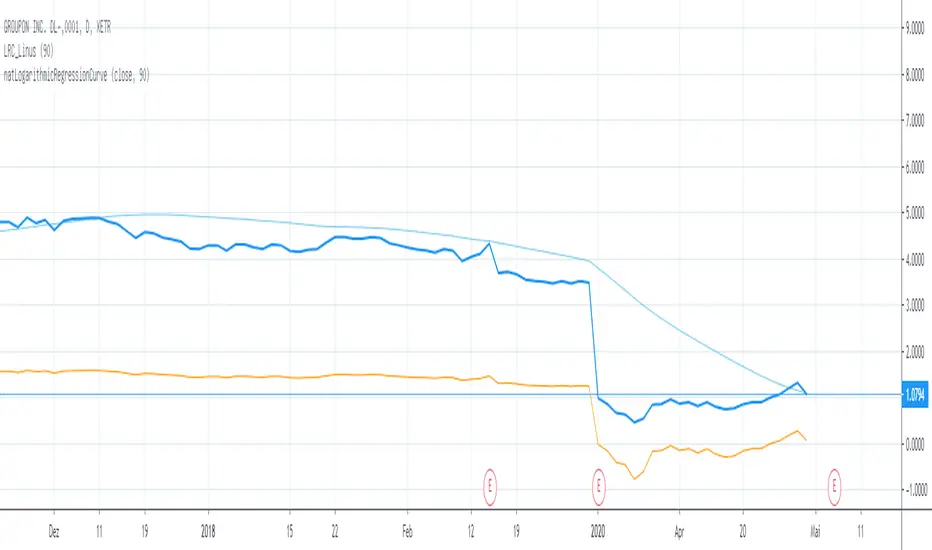
natLogarithmicRegressionCurveThis is my attempt to rebuild the Momentum Strategy as read in the book "Stocks on the move".
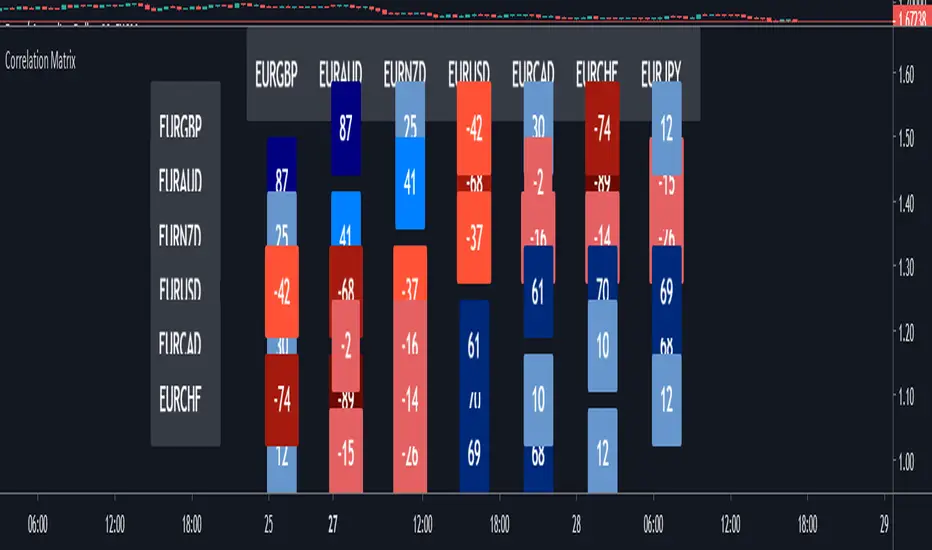
Correlation MatrixIn financial terms, 'correlation' is the numerical measure of the relationship between two variables (in this case, the variables are Forex pairs).
The range of the correlation coefficient is between -1 and +1. A correlation of +1 indicates that two currency pairs will flow in the same direction.
A correlation of -1 indicates that two currency pairs will move in the opposite direction.
Here, I multiplied correlation coefficient by 100 so that it is easier to read. Range between 100 and -100.
Color Coding:-
The darker the color, the higher the correlation positively or negatively.
Extra Light Blue (up to +29) : Weak correlation. Positions on these symbols will tend to move independently.
Light Blue (up to +49) : There may be similarity between positions on these symbols.
Medium Blue (up to +75) : Medium positive correlation.
Navy Blue (up to +100) : Strong positive correlation.
Extra Light Red (up to -30) : Weak correlation. Positions on these symbols will tend to move independently
Light Red (up to -49) : There may be similarity between positions on these symbols.
Dark Red: (up to -75) : Medium negative correlation.
Maroon: (up to -100) : Strong negative correlation.
FX Currency Strength IndicatorFX Currency strength indicator is a visual guide that demonstrates which currencies are currently strong, and which ones are weak.
FX Currency strength indicators include multiple calculation to choose from
1. Relative Strength Index (RSI)
2. True Strength Index (TSI)
3. Absolute Strength Index (ASI)
4. Linear Regression Slope (LRS)
5. Rate of Change (ROC)
6. Z-Score
Three display modes
1. Lines
2. Columns
3. Areas

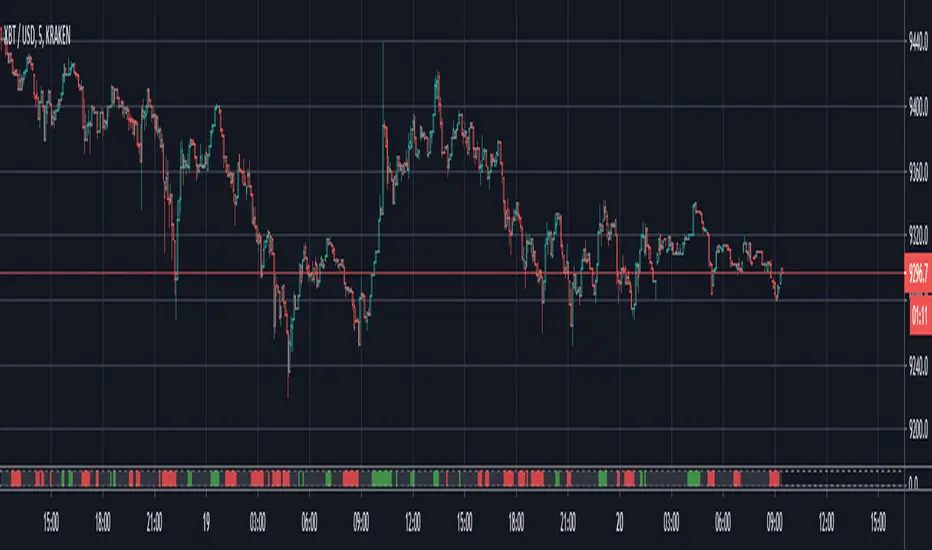
Chop & Trend===========
Chop & Trend
===========
A handy little indicator illustrating not only areas of Chop or "flat" market conditions, but also to indicate the start of a new trend and the new trend's direction.
-----------
Using just a few algorithms to indicate the aforementioned (RSI, Jurik Moving Average and Angle of MA) we've tried to keep it simple as we believe adding too many variables can only degrade a good indicator, and not enhance it, as many would lead you to believe.
There's a few settings to play with regarding Relative Strength, Jurik MA and the ability to set an angle to determine when chop/trend starts or ends.
Good Luck and Happy Trading!
-theCrypster
Relative Strength with NIFTYThis script checks the relative strength of a security with respect to NIFTY

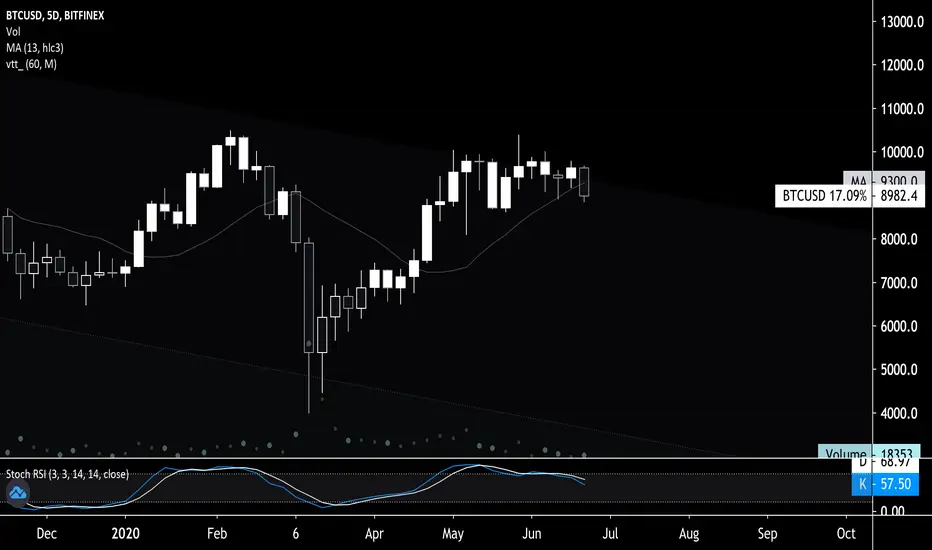
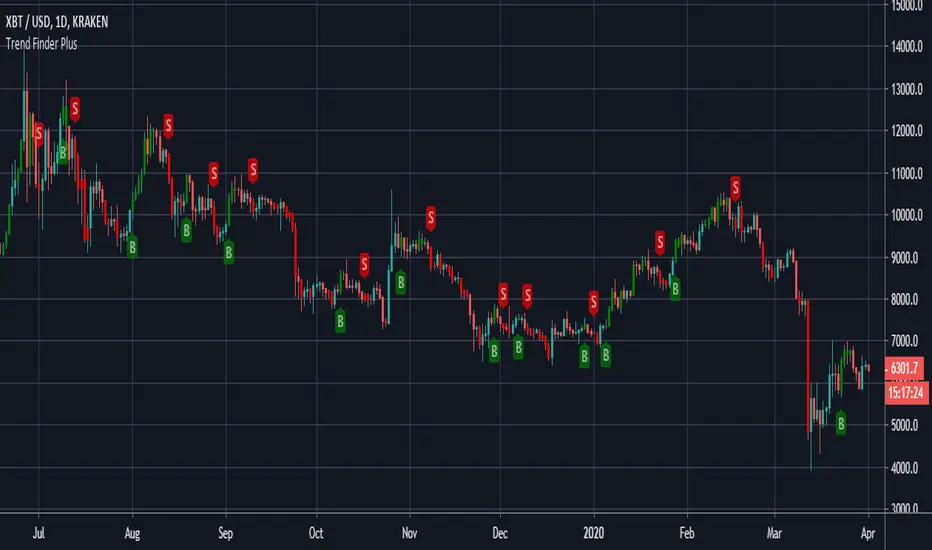
Trend Finder Plus - theCrypster===========
Trend Finder Plus
===========
A combination of various trend analysis techniques - MA's, pivotal breakouts, and Stochastics - Combined to make one super handy indicator!
-----------
Editable settings include a custom "Trend Finder" length and the usual settings for utilizing a "Stochastic RSI" .
This is a really useful tool for catching the very start of potentially bigger swings and movements - but it can get easily and display false signals during choppy periods - use with other indicators for a true sense of what can be achieved with this.
Good Luck and Happy Trading!
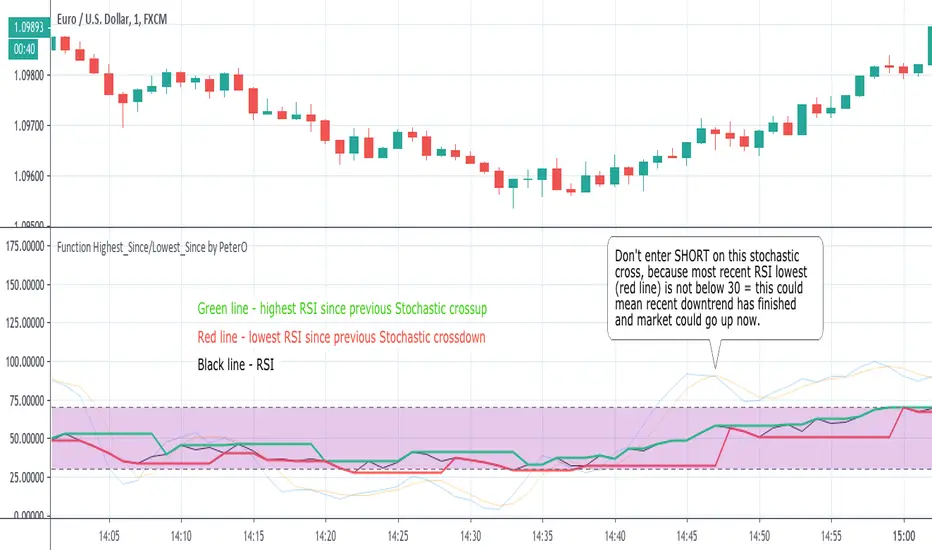
Function Highest/Lowest by PeterONo matter how much I like PineScript, there are still things missing in the language. One of the most annoying issues is that you cannot set dynamic length value for highest/lowest functions. This length must be fixed integer. But it doesn't make sense in a lot of cases, when you'd like to know what was the highest/lowest value of a series SINCE EVENT in the past, but you don't know WHEN this event exactly happened.
Us, coders would like to do this: `highest(series,barssince(...))`
But it is not working.
Numerous coders are using RicardoSantos' f_highest/f_lowest script (), probably the most often copy/pasted snippet of PineScript code out there. It is doing more-less what `highest(series,barssince(...))` would be doing, but with hardcoded max bars back.
Ricardo is my idol by the way, but that didn't stop me from creating my own version of Highest/Lowest functions. They are fast, simple, effective and very light for Pine engine.
Please treat this as an OPEN SOURCE snippet of code, which can be used in variety of ways.
I have implemented a simple use-case myself, to demonstrate what can be done. The example shows what was the highest/lowest value of RSI since the previous cross of Stochastic. So that you don't enter SHORT on Stochastic crossunder, if RSI didn't reach oversold (<30) since the previous Stochastic crossunder = aka maybe the downtrend has exhausted.
I'm sure you'll find plenty of use cases for it in your studies and strategies as well. If you create your own code using my Highest/Lowest functions, don't hesitate to put a link down here in comments.
P.S. This is not a strategy in any way, so don't ask me "does it backtest well?".
P.S.2 This code doesn't repaint as well ;)
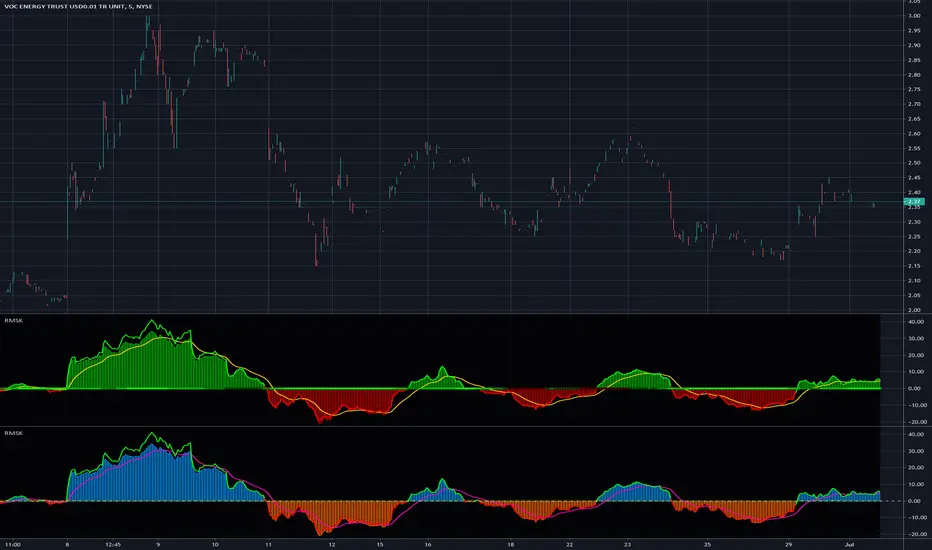
Relative Strength(RSMK) + Perks - Markos KatsanosIf you are desperately looking for a novel RSI, this isn't that. This is another lesser known novel species of indicator. Hot off the press, in multiple stunning color schemes, I present my version of "Relative Strength (RSMK)" employing PSv4.0, originally formulated by Markos Katsanos for TASC - March 2020 Traders Tips. This indicator is used to compare performance of an asset to a market index of your choosing. I included the S&P 500 index along side the Dow Jones and the NASDAQ indices selectively by an input() in "Settings". You may comparatively analyze other global market indices by adapting the code, if you are skilled enough in Pine to do so.
With this contribution to the Tradingview community, also included is MY twin algorithmic formulation of "Comparative Relative Strength" as a supplementary companion indicator. They are eerily similar, so I decided to include it. You may easily disable my algorithm within the indicator "Settings". I do hope you may find both of them useful. Configurations are displayed above in multiple scenarios that should be suitable for most traders.
As always, I have included advanced Pine programming techniques that conform to proper "Pine Etiquette". For those of you who are newcomers to Pine Script, this script may also help you understand advanced programming techniques in Pine and how they may be utilized in a most effective manner. Utilizing the "Power of Pine", I included the maximum amount of features I could surmise in an ultra small yet powerful package, being less than a 60 line implementation at initial release.
Unfortunately, there are so many Pine mastery techniques included, I don't have time to write about all of them. I will have to let you discover them for yourself, excluding the following Pine "Tricks and Tips" described next. Of notable mention with this release, I have "overwritten" the Pine built-in function ema(). You may overwrite other built-in functions too. If you weren't aware of this Pine capability, you now know! Just heed caution when doing so to ensure your replacement algorithms are 100% sound. My ema() will also accept a floating point number for the period having ultimate adjustability. Yep, you heard all of that properly. Pine is becoming more impressive than `impressive` was originally thought of...
Features List Includes:
Dark Background - Easily disabled in indicator Settings->Style for "Light" charts or with Pine commenting
AND much, much more... You have the source!
The comments section below is solely just for commenting and other remarks, ideas, compliments, etc... regarding only this indicator, not others. When available time provides itself, I will consider your inquiries, thoughts, and concepts presented below in the comments section, should you have any questions or comments regarding this indicator. When my indicators achieve more prevalent use by TV members, I may implement more ideas when they present themselves as worthy additions. As always, "Like" it if you simply just like it with a proper thumbs up, and also return to my scripts list occasionally for additional postings. Have a profitable future everyone!
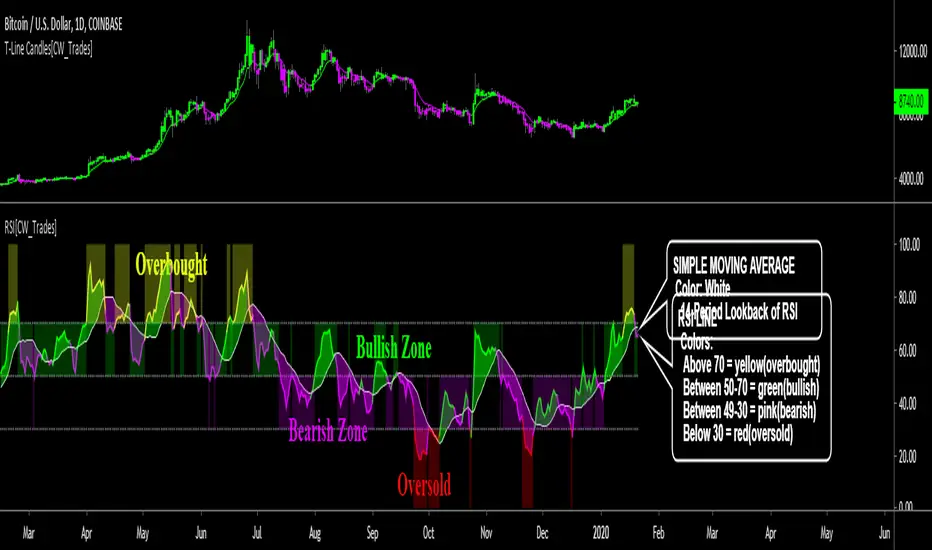
Relative Strength IndexThe relative strength index (RSI) is a momentum indicator that measures the magnitude of recent price changes to evaluate overbought or oversold conditions in the price of a stock or other asset. The RSI is displayed as an oscillator (a line graph that moves between two extremes) and can have a reading from 0 to 100. The indicator was originally developed by J. Welles Wilder Jr. and introduced in his seminal 1978 book, New Concepts in Technical Trading Systems.
Traditional interpretation and usage of the RSI are that values of 70 or above indicate that a security is becoming overbought or overvalued and may be primed for a trend reversal or corrective pullback in price. An RSI reading of 30 or below indicates an oversold or undervalued condition...more here .
-------------------------
*This indicator uses standard RSI settings of a 14-period lookback with a midline of 50, overbought level of 70 and oversold level of 30.
This RSI indicator has been modified to include a simple moving average of the RSI, adjustable overbought and oversold horizontal lines, a color-changing RSI line, color-filled RSI horizontal levels and color-filling the space between the RSI and simple moving average.
-This simple moving average(SMA) is set to a lookback period of 14 and is plotted as a white line. As the RSI moves above and below the SMA the color of the RSI changes; when above the SMA the RSI is lime, when below he SMA the RSI is pink. Lime indicates bullish momentum for RSI, pink indicates bearish momentum for RSI.
-When the RSI line is above 70 the RSI and background both turn yellow, this indicates overbought conditions.
-When the RSI line is below 30 the RSI and background both turn red, this indicates oversold conditions.
-The backgrounds fill the levels the RSI is trading between and can be turned on/off.
-The space between the RSI and SMA is filled and can be turned on/off.
-The RSI line can be set to solid or multi-color.
-The horizontal lines can be adjusted and turned on/off.
-The SMA can be adjusted.
For crypto or volatile markets, overbought and oversold levels of 80 and 20 are recommended.
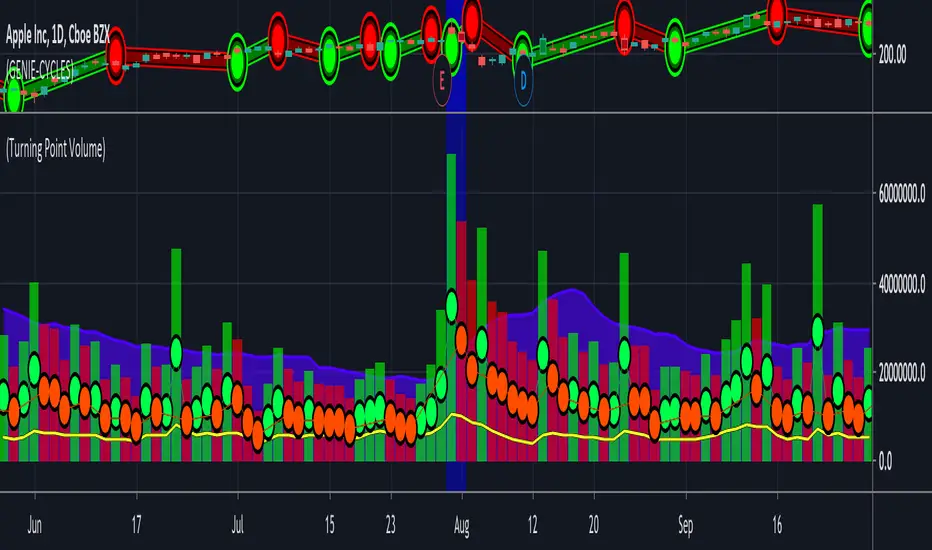
(14) Turning Point Volume VS-332Although dramatic increases in volume can accurately reflect the sentiment of changes in price, small changes do as well. Think of it this way. Every share sold or purchased is a vote for or against the current price action. If the price has gone up today and the volume also went up, compared to the previous days volume, the votes of the majority of the traders that produced this volume agreed with the sentiment that this price change represented. If the volume was suppressed on this price increase, that sentiment was not confirmed. This provides you with a very good window into the collective minds of traders allowing you to judge every candle, every indicator and every price action in a much more initiative and accurate way. The SDG Turning Point Volume indicator again utilizes a dot system to easily allow you to see in a glance if the volume is confirming the price action sentiment (green dot) or if it is discounting the price action (red dot.)
There are many situations where volume alone can indicate important inflection points in an equities direction. It may not even reverse direction, but an abrupt change in the rate of change, can be a very profitable entry point – if you can see it coming and act in advance of some or most of the traders making this market.
Access this Genie indicator for your Tradingview account, through our web site. (Links Below) This will provide you with additional educational information and reference articles, videos, input and setting options and trading strategies this indicator excels in.
[RSM] Relative Strength Momentum v1.0 [pvt]This indicator was designed to compare relative price momentum across multiple related/unrelated symbols, maximum of 6.
Each symbol's momentum/trend is determined by price movement and custom weighted moving averages.
You can use this indicator to determine changing trends by looking at correlated leading symbols.
Description of Input Parameters:
Dark theme: Turn on this checkbox if you are using the dark theme in Tradingview.
MA Type: Default is preferred, but allows you to choose different Moving Averages to determine momentum.
MA Period: Ideal period is 200 for a Chart TF of 15 minutes to 1 Hour for most symbols I've tested. (US/Euro Indexes CFD and Futures)
Symbol 1-6: Enter a valid Symbol in Tradingview otherwise indicator will return an error.
Display Symbol1-6: Checkbox to turn on/off corresponding symbol's plot.
Access to Script:
Please contact me privately on Tradingview, user id: a.tesla2018
Alternatively, use the links below for method of payment/access to this indicator.

CPR WidthThe indicator shows the width of the Central Pivot Range. Frank Ochoa call it It Pivot Range Histogram in his book.
Use it in conjunction with the Central Pivot Range indicator.
Below is the interpretation of the reading.
CPR Width > 0.5 - Sideways or Trading Range Day,
CPR Width > 0.75 - increases the likelihood of sideways trading behavior,
CPR Width < 0.5 - Trending type of day,
CPR Width < 0.25 - increases the likelihood of a trending market.
The above reading only increases the likely-hood of the possibility and not always right.

|-ML-| Banana Split | RSI & MFI Divergence OscillatorsMFI and RSI moving average divergence oscillators.
Bullish:
More Yellow underneath curling up.
Higher Low on blue oscillator.
'MFI Trend' (red and green line) red at the top.
Bearish:
More orange at the top curling down.
Lower high on blue oscillator.
'MFI Trend' green at the bottom.
This is a great compliment to the C4 indicator.
()

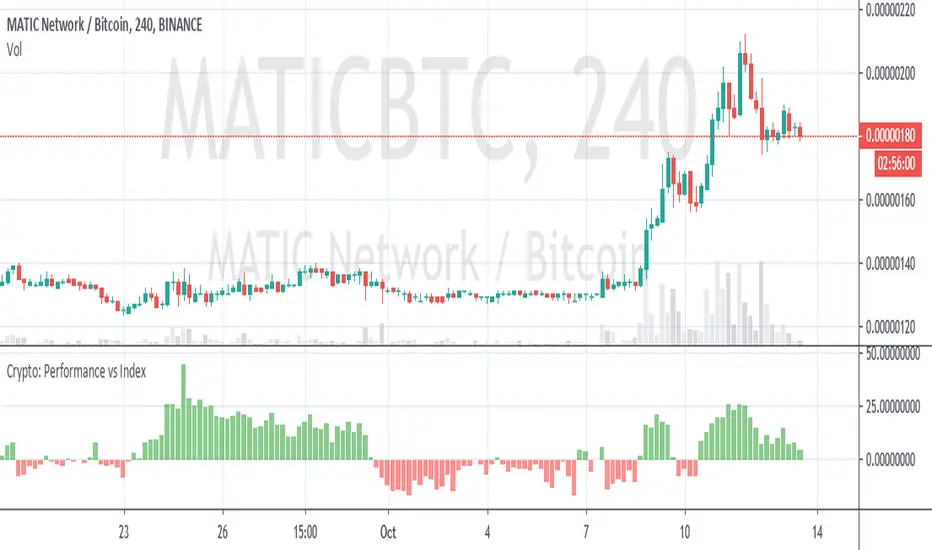
Crypto Performance vs IndexQuickly shows you if an altcoin is outperforming or underperforming it's peers. You can compare again indexes of high cap, mid cap and low cap indexes, which are provided by FTX.com. I intend to add some more features but am currently a bit busy so wanted to get it published as I've been finding it useful
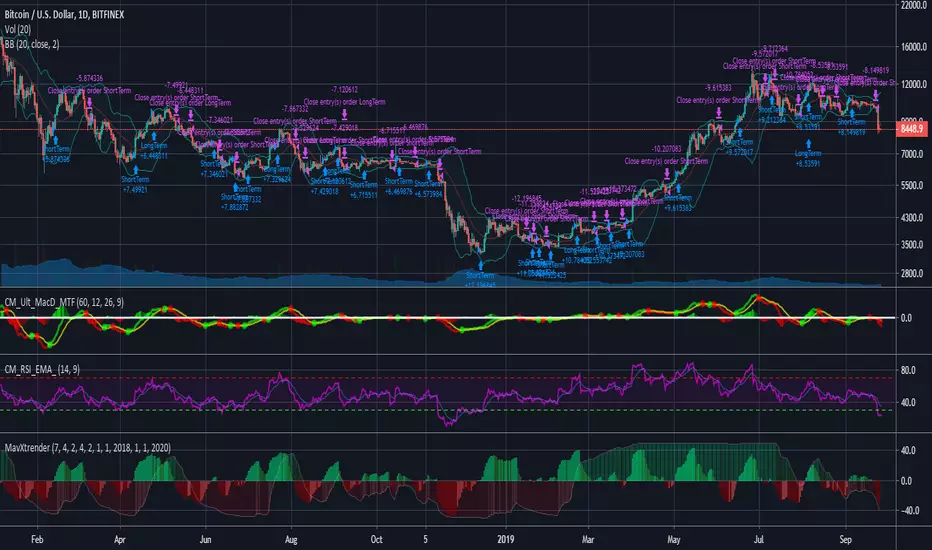
MavXtrenderConverted the B-Xtrender script from Puppytherapy into a strategy script.
B-Xtrender was created by Bharat Jhunjhunwal and published in this IFTA Journal .
I've added the following features:
Ability to use factors instead of individual values for each parameter. This will allow you to quickly check different averages (5 vs 7 for example).
Defaults adjusted for crypto trading (7 days/week).
Switches to use either the short or long term indicator, or both.
Time window
BUY SELL Signal based on BB over RSI 14I have applied Bollinger Bands over Relative strength Index ( RSI 14). based on crossovers, i am applying buy or sell. Also, exit indicator for buy/sell position. Please let me know your thoughts on this.
Declaimer: This is completely based on my knowledge and observations only. NOT A TRADING STRATEGY SUGGESTION. Please consider my post as just educational purpose only.

Relative Strength RankRelative Strength Rank Indicator
( ( Long Term Price Change + Short Term Price Change ) / 2 ) / 10 Day ATR
