Overlay Mini Plot(s) of Correlated Asset(s)Overlay a small plot of a correlated asset of your choosing. Shrink/expand, Set vertical and horizontal position, plot multiple mini-plots via duplicate indicators with varied settings.
Plots the last X bars of any asset; including the live candle currently painting
Useful for low time frame trading when you want to see correlated asset price movement right alongside the price movement you're watching.
Useful for quick and simple comparisons; when you don't want the clutter of split screen or multi-pane view.
Useful for backtesting.
Price scale agnostic; just plots the shape of the recent price action, with several optional labels: Asset+timeframe | Live Price | Highest price over X bars | Lowest price over X bars.
Works fine with all the assets i've tested it on.
~~User inputs~~
-number of bars to paint.
-horizontal offset: plot to right X bars or to left X bars
-vertical offset: shift up or down, shrink or expand; by using 2 'spacer' inputs
-color/transparancy of candles and price labels.
-width (pixels) of candle bodies.
-choose to display price labels or not
-choose to display asset label or not
~~Tips~~
--Add several of these indicators; changing the vertical 'Shift/Shrink' settings on each to visually separate them.
--In the above chart or EurUsd, there are three indicators =>> three mini-plots overlaid: DXY, EurGbp and GbpUsd. Using the following settings for Space Above:Space Below: DXY- 0.1:4.5 | EurGbp- 1.8:1.8 | GbpUsd- 4.5:0.1
--the more you add, the more you'll have to vertically shrink the plots
© twingall
Relativestrength

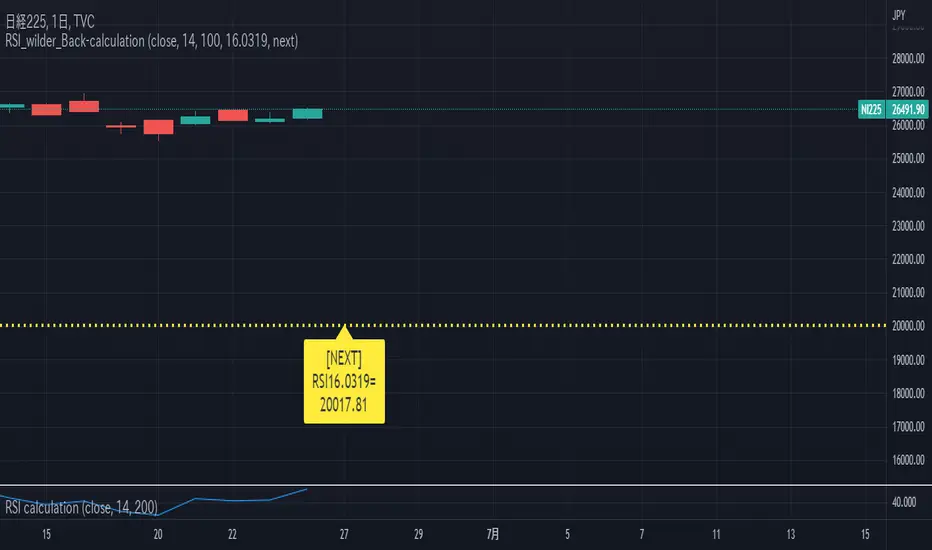
WILDER's RSI Back-calculation■Purpose of this script
Back-calculate the stock price based on WILDER's RSI* formula.
*Relative Strength Index
■Logic Overview
This time, RSI calculation formula by WILDER is adopted. WILDER's formula is generally used.
Unlike Cutler's RSI, which is calculated from the ratio of the simple sum of price increases and decreases, this formula uses a modified moving average.
Therefore, more weight is placed on recent stock price.
This script back-calculates future stock prices from past stock price data and set RSI values.
Therefore, you can receive the offer of the buy price in the oversold phase and the offer of the sell price in the overbought phase with reference to the RSI index.
■How to use
Enter the following on the parameters input screen
Sauce (usually close)
Reference period(14 is optimal by J.W. Wilder)
Base Date(usually 100)
RSI target value (Generally, buy below 30 and sell above 70)
When to ask for stock price (After the latest bar closing price is decided: next. The latest bar is moving: current.)
For example, when selecting a daily chart, before trading hours: , during trading hours:
when selecting a weekly chart, the closing price is not fixed, for example on Wednesday:
Return & Drawdown
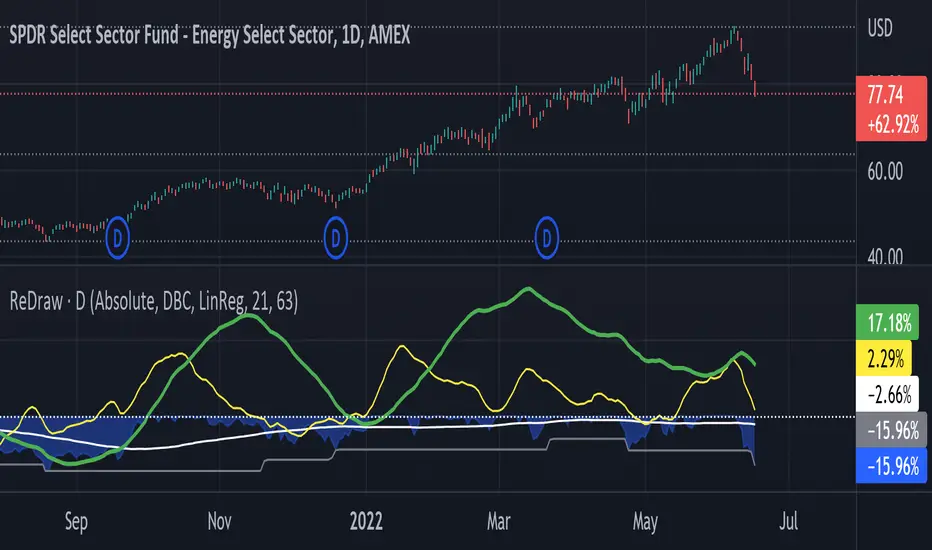
ReDraw script calculates the historical returns and drawdown for the given periods.
By default, the return of the linear regression trends is displayed (can be turned off in settings). In this mode, two linear regression trends are being computed for both long and short periods, and the percent value indicates the "return of the trend" for the corresponding period. Observing the dynamic of the linear regression trends can give a great hint if the trend is slowing down.
When the smoothing method is set to "none" or WMA3/5, the real asset return is shown for both periods, using the formula (LastPrice-FirstPrice)/FirstPrice
The script calculates the maximum drawdown for the long period using the formula (max(Price) - LastPrice) / max(Price).
The white line under the zero is the average maximum drawdown over the long period.
When the mode is set to Compare, ReDraw will display the difference in metrics between the current and selected symbol (SPY by default).
Adaptive, Relative Strength EMA (RSEMA) [Loxx]TASC's May 2022 edition Traders' Tipsl includes the "Relative Strength Moving Averages" article authored by Vitali Apirine. This is the code implementing the Relative Strength Exponential Moving Average (RS EMA) indicator introduced in this publication.
This indicator adds onto Vitali Apirine's work by including three different types of momentum used to calculate RSEMA as well as fixed and adaptive cycle calculations to be used as dynamic inputs to calculate momentum. The purpose of these additional calculation methods is to attempt to filter out noice and track trends by using different methods and inputs to calculation momentum.
Momentum methods
-Wilder relative strength
-Chande momentum
-Momentum component of Jurik's RSX RSI
Cycle calculation methods
-Fixed
-Vertical horizontal filter
-Ehlers' Autocorrelation Dominant Cycle
What is Wilder relative strength?
The Relative Strength Index (RSI), developed by J. Welles Wilder, is a momentum oscillator that measures the speed and change of price movements. The RSI oscillates between zero and 100. Traditionally the RSI is considered overbought when above 70 and oversold when below 30.
What is Chande momentum?
Chande Momentum was designed specifically to track the movement and momentum of a security. It calculates the difference between the sum of both recent gains and recent losses, then dividing the result by the sum of all price movement over the same period.
What is the momentum component of Jurik's RSX RSI?
RSI is a very popular technical indicator, because it takes into consideration market speed, direction and trend uniformity. However, the its widely criticized drawback is its noisy (jittery) appearance. The Jurk RSX retains all the useful features of RSI , but with one important exception: the noise is gone with no added lag. For our purposes here, we derive momentum minus the lag.
Vertical horizontal filter?
Vertical Horizontal Filter (VHF) was created by Adam White to identify trending and ranging markets. VHF measures the level of trend activity, similar to ADX in the Directional Movement System. Trend indicators can then be employed in trending markets and momentum indicators in ranging markets.
What is autocorrelation?
Ehlers Autocorrelation is used in the calculation of dominant cycle length to be injected into standard technical analysis tools to improve TA accuracy. Its main purpose is to eliminate noise from the price data, reduce effects of the “spectral dilation” phenomenon, and reveal dominant cycle periods.
As the first step, Autocorrelation uses Mr. Ehlers’s previous installment, Ehlers Roofing Filter, in order to enhance the signal-to-noise ratio and neutralize the spectral dilation. This filter is based on aerospace analog filters and when applied to market data, it attempts to only pass spectral components whose periods are between 10 and 48 bars.
Autocorrelation is then applied to the filtered data: as its name implies, this function correlates the data with itself a certain period back. As with other correlation techniques, the value of +1 would signify the perfect correlation and -1, the perfect anti-correlation.
Happy trading!

RSI Scalping & Swing Signals With AlertsThis RSI indicator shows a green or red ribbon when the smoothed RSI is bullish or bearish. It also includes a long moving average for overall trend confirmation. Wait until the ribbon holds above or below the long moving average and take positions in that direction.
To get an easier to read RSI indicator, I smoothed the RSI out and paired it next to a short term RMA. These two together form the ribbon that will show you early reversals and trend direction. The long moving average is used as an overall trend detector and confirmation for longer term trends.
***HOW TO USE***
Scalping: Enter longs when the ribbon turns green and enter shorts when the ribbon turns red. Exit positions when the ribbon turns the opposite color or crosses the long moving average.
Swing Trading: When the ribbon holds above the long moving average or breaks out and retests it, look for long positions and exit when the ribbon turns red or crosses the long moving average. When the ribbon holds below the long moving average or breaks down and retests it, look for short positions and exit when the ribbon turns green or crosses the long moving average.
***DETAILS***
This indicator gives early reversal signals very well and waiting for the RSI ribbon to cross the long moving average helps to get you into positions when the market is ready to really move while filtering out some of the noise.
The ribbon and background will change to green or red depending on whether it is currently bullish or bearish.
There is also a label that changes colors and tells you if RSI is bullish or bearish and also whether the RSI ribbon is above or below the long moving average.
Green or red circles will appear on the indicator when there is a bullish or bearish cross of the RSI ribbon and the long moving average.
It also has alerts that trigger when RSI is turning bullish/bearish or when the RSI ribbon is crossing the long moving average.
***CUSTOMIZATION***
Each piece of this indicator can be customized to suit your preferences including the RSI source, length, smoothing length, short moving average length and long moving average length. You can also turn off the labels, signals and long moving average. All of these settings can be managed within the indicator settings input tab.
***MARKETS***
This indicator can be used as a signal on all markets, including stocks, crypto, futures and forex.
***TIMEFRAMES***
This RSI Scalping & Swing Signals indicator can be used on all timeframes.
***TIPS***
Try using numerous indicators of ours on your chart so you can instantly see the bullish or bearish trend of multiple indicators in real time without having to analyze the data. Some of our favorites are Trend Friend Scalp & Swing Trade Signals, Volume Spike Scanner, Buy & Sell Pressure Volume Profile, and Momentum Scalper in combination with this RSI indicator. They all have real time Bullish and Bearish labels as well so you can immediately understand each indicator's trend.

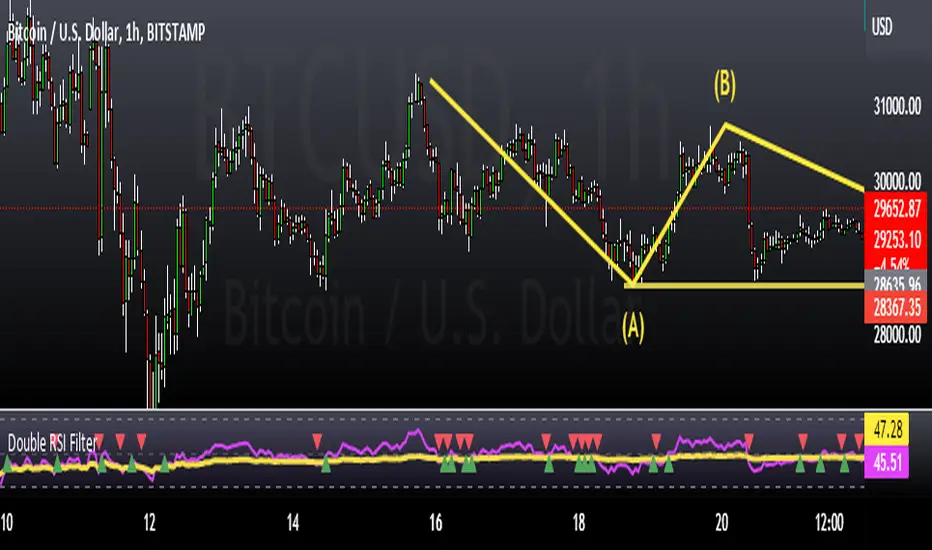
Double RSI FilterI've seen several youtubers using 2 RSI's on top of one another to filter trades for their strategies. I figured I would just code it up as an all-in-one indicator for people who have the basic package. This way they have an extra slot for another indicator if they need one and also for convenience.
Longs only when RSI 1 is above RSI 2 and shorts only when opposite. The arrows show where crosses of the RSI's occur.
Let me know if there is something else like this where it would just be very convenient to have 2 indicators on one window or other such things and I'll see if I can do something for you guys in my spare time. I'm just an amateur coder, but learning as I do more of these for people.
Thank you!
Hope this helps someone! :)
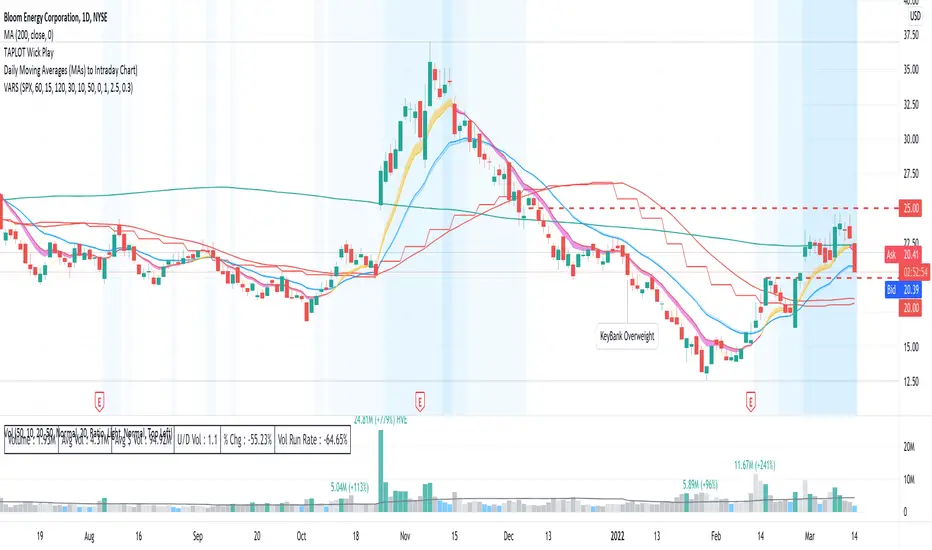
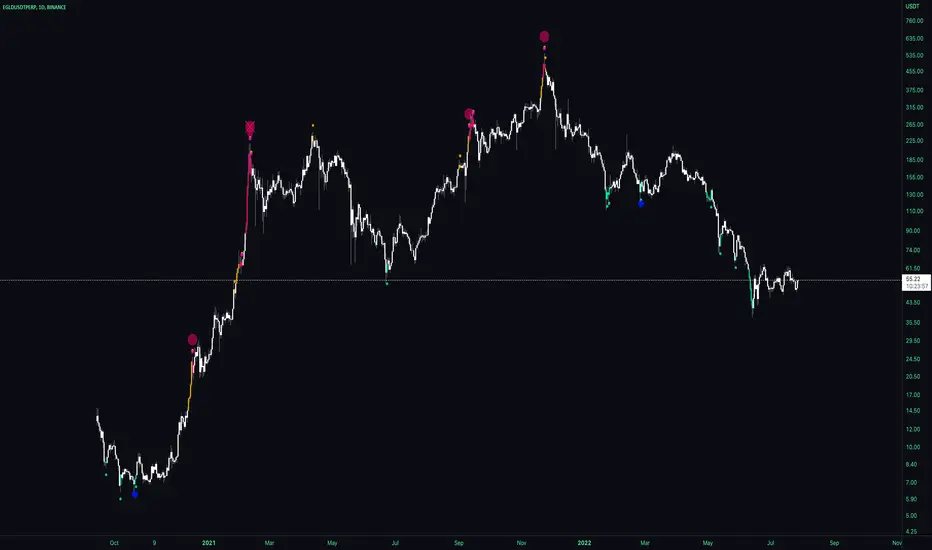
TAPLOT Relative Strength New High Multi LookbackThis indicator will compare your Stock or ETF to any other security of your choice. The indicator a stock's price action to that of the S&P 500. A rising line tells you the stock is outperforming the benchmark index. When looking for stocks to swing trade, I like to build my watchlist from stocks that are showing a rising/strong Relative Strength line.
What differentiates this indicator from others that are available out there is:
Ability to choose any benchmark index to compare to (from ticker pick field in settings)
Plotting Relative Strength New High (Relative Strength NH) and Relative Strength New High Before Price (RS NHBP) on the Relative Strength line by looking back at 3 different lookback periods (3 months, 6 months, and 12 months)
Plotting all history occurrences of RS NH and RS NHBP
By being able to plot NHs from all 3 lookback periods gives you an early heads up on stocks that started to outperform the market early on (3 months RS NHs). The indicator then switches to 6 months plotting Crosses for NHs and then to 12 month lookback when 12 month Relative Strength New Highs are present.
The Relative Strength line itself will be plot on all of your chart timeframes however the RS NH and RS NHBP are only plotted on Daily and Weekly charts.
The indictor is very customizable - you are able to adjust:
Benchmark to compare to
Lookback period (default to Multi/All)
Change the width of Relative Strength line and color
Change the size of Dashes, Crosses, and Circles plotted on RS line
Change the color of NH and NHBP plots
Force Relative Strength NH/NHBP shapes to Circles for all lookback periods
This is version 1.0 and initial release. Please report any bugs in the comments section below. Hope you find this useful.
Here is an example of $NFE showing early signs of strength from late Feb 2022 with 3 month Dashed signals then 6 month outperformance with Crosses and finally 12 months outperformance with Circles.

[VC] Effort & Result Index V1.0V.C. Effort & Result Index draws the Price change, Volume, Delta & Delta % as a histogram. On the positive side of the histogram, it marks the price change & on the negative side of the histogram, it marks volume, delta & delta %. And the best part of the indicator is that it allows you to see all the mentioned data types simultaneously.
See the below chart for a comprehensive understanding.
Before moving further, understand the below analogy first.
Volume & Delta = Fule or Effort
Price Movement = Result
Think of Volume & Delta as FULE or EFFORT and Price Movement as Result.
If the price travels a significant distance with less fule & effort, it indicates that no barriers or inverse forces are stopping the price movement.
On the other hand, if the price is travelling a less distance & consuming comparatively more fule & effort, it indicates some barriers or inverse forces stopping the price movement.
V.C. Effort & Result Index empowers you to read, compare & analyse Volume, Delta & Price effortlessly. It helps to measure the relative price change in different combinations. Such as, you can compare the price change with total volume, delta volume & delta percentage.
See the below relative comparison analysis by using Price Change, Volume Change & Delta Change.
In the above example, you can see that on candle A, there is a very significant price move with a small volume & delta. But on the next candle B, there is a minor price move compared to the previous candle A, but the volume is relatively high & delta is almost the same. In simple words, the same effort was applied to candle B but got fewer results than candle A. It indicates that buyers applied the same effort but failed to get the same results. It reveals that sellers are taking control, leading to a trend reversal.
This comparative analysis method & approach can add an extra edge to your analysis spacially on key levels & breakouts.
V.C Effort & Result Index Settings & Inputs
Price Change:
Allow you to show/hide the price change bars on the positive side of the histogram.
Volume:
Allow you to show/hide the total volume on the negative side of the histogram.
Delta%:
Allow you to show/hide the delta % on the negative side of the histogram.
Delta:
Allow you to show/hide the delta on the negative side of the histogram.
Style Settings
The Style section allows you to change the colors & the view format of all data types.
Disclaimer Note:
V.C Effort & Result Index is not a BUY/SELL signal based indicator or a holy grail trading system.
It is purely Volume, Delta, Demand & Supply imbalance and comparative analysis based tool kit. Before applying this indicator to your analysis, you should know about Volume, Delta & Spread, and Demand & Supply.
Some basic understanding of Sir Richerd Wyckoff's Theory can also be helpful.

Custom Multi-Timeframe IndicatorIt's a pretty simple example of a nice custom screener you can run for multiple timeframes. This is an RSI screener, but you can easily change the function for your own Indicator.
Screener displays:
Last value of the instrument
RSI value for up to 10 instruments / 4 timeframes.
In Parameters you can change:
4 timeframes
10 instruments
Parameters for RSI
Styling parameters for table
If the selected timeframe will be lower than the current one you will receive a warning message in a table.
Thanks to @MUQWISHI to help me code it.
Disclaimer
Please remember that past performance may not be indicative of future results.
Due to various factors, including changing market conditions, the strategy may no longer perform as well as in historical backtesting.
This post and the script don’t provide any financial advice.

Oversold RSI with tight SL Strategy (by Coinrule)This is one of the best strategies that can be used to get familiar with technical indicators and start to include them in your trading bot rules.
ENTRY
1. This trading system uses the RSI ( Relative Strength Index ) to anticipate good points to enter positions. RSI is a technical indicator frequently used in trading. It works by measuring the speed and change of price movements to determine whether a coin is oversold (indicating a good entry point) or overbought (indicating a point of exit/entry for a short position). The RSI oscillates between 0 and 100 and is traditionally considered overbought when over 70 and oversold when below 30.
2. To pick the right moment to buy, the strategy enters a trade when the RSI falls below 30 indicating the coin is oversold and primed for a trend reversal.
EXIT
The strategy then exits the position when the price appreciates 7% from the point of entry. The position also maintains a tight stop-loss and closes the position if the price depreciates 1% from the entry price. The idea behind this is to cut your losing trades fast and let your winners ride.
The best time frame for this strategy based on our backtesting data is the daily. Shorter time frames can also work well on certain coins, however in our experience, the daily works best. Feel free to experiment with this script and test it on a variety of your coins! With our backtesting data a trading fee of 0.1% is taken into account. The fee is aligned to the base fee applied on Binance, which is the largest cryptocurrency exchange by volume. In the example shown, this strategy made a handsome net profit of 39.31% on Chainlink with 61.54% of trades being profitable.

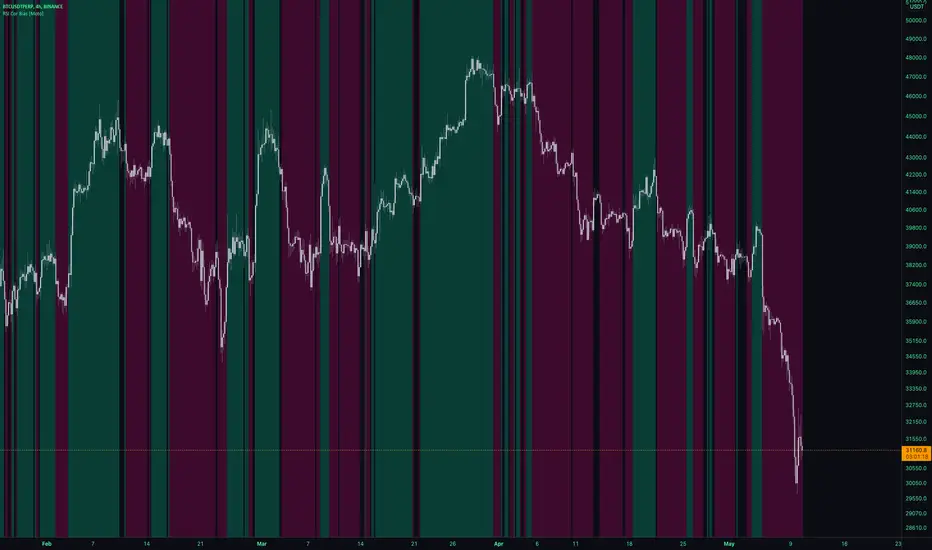
RSI Cor Bias [Moto]Hello traders,
This is a pretty simple script. It gives a background directional bias color respective to RSI levels from input thresholds in the settings. Users can choose the upper and lower thresholds and the symbol that the RSI is from.
For example, by default, the upper threshold is 52 and the lower 48. If Bitcoins RSi is above 52, the background color will be green, below 48 it's pink, between and no color will be applied.
Generally, buying should be occurring in pink to green transition or in green, and conversely selling should be occurring in green to pink transition or in pink.
Thanks,
Moto
MTF Dots BTC-Pair [Auto] [Moto]Hello traders,
Rsi is pretty commonly used and for some good reasons. When I'm trading, I don't always want to use the USDT/USDTPERP rsi, I want to see the correlated BTC pair Rsi of that asset
This script is similar to my MTF Dots and MTF Dots Cor scripts, but with an important and crucial distinction.
This shows user input oversold and overbought RSI metrics for multiple simultaneous timeframes comparatively to a perpetual futures contracts respective BTC pair automatically.
IMPORTANT: As of posting, the script will only show relevant information if the observed chart is a Binance perp chart. Any other chart and the script will not show data.
For example, if a user is on the BINANCE:SOLUSDTPERP chart, the script will show oversold and overbought Rsi data points for BINANCE:SOLBTC. If observing the BINANCE:ZRXUSDTPERP chart, it will give metrics for BINANCE:ZRXBTC Rsi.
There are six time frames, set to "Chart" resolution by default, which have individual period, overbought and oversold levels of strength.
DM for access,
Thanks
Oversold RSI with Tight Stop-Loss Strategy (by Coinrule)KRAKEN:LINKUSD
This is one of the best strategies that can be used to get familiar with technical indicators and start to include them in your rules on Coinrule .
ENTRY
1. This trading system uses the RSI (Relative Strength Index) to anticipate good points to enter positions. RSI is a technical indicator frequently used in trading. It works by measuring the speed and change of price movements to determine whether a coin is oversold (indicating a good entry point) or overbought (indicating a point of exit/entry for a short position). The RSI oscillates between 0 and 100 and is traditionally considered overbought when over 70 and oversold when below 30.
2. To pick the right moment to buy, the strategy enters a trade when the RSI falls below 30 indicating the coin is oversold and primed for a trend reversal.
EXIT
The strategy then exits the position when the price appreciates 7% from the point of entry. The position also maintains a tight stop-loss and closes the position if the price depreciates 1% from the entry price. The idea behind this is to cut your losing trades fast and let your winners ride.
The best time frame for this strategy based on our back testing data is the daily. Shorter time frames can also work well on certain coins, however in our experience, the daily works best. Feel free to experiment with this script and test it on a variety of your coins! With our back testing data a trading fee of 0.1% is taken into account. The fee is aligned to the base fee applied on Binance, which is the largest cryptocurrency exchange by volume. In the example shown, this strategy made a handsome net profit of 52.6% on Chainlink with 66.67% of trades being profitable.
You can execute this strategy on your favorite exchanges with Coinrule .

Stochastic RSI HeatmapStochastic RSI presented as a heatmap starting from the oversold (20) / overbought (80) levels respectively. The more oversold / overbought the price, the more intense the color (blue / fuchsia).

RSI correlation with cryptoindices [strategy version]Dear TV'ers,
Hereby the strategy script where the RSI of an altcoin can be compared to one of the selected cryptocap indices. Included are:
-total market cap
-total market cap minus bitcoin
-total market cap others
-total market cap usdt
-cix100 index
-btc dominance
-btc total cap
If the signal crosses over 1, then the altcoin is undervalued compared to the crypto index (and considered a buying signal here). If the signal crosses under 1, then the altcoin is overvalued compared to the selected crypto-index and a short signal is produced.
!!Please note that the selected timeframe for the reference pair should be a higher time of the chart in order to prevent repainting!!!

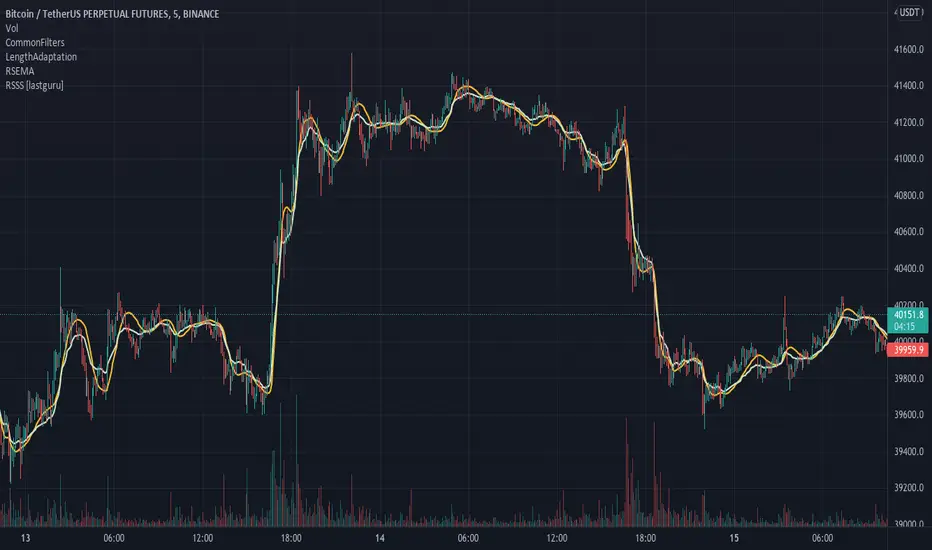
Relative Strength Super Smoother by lastguruA better version of Apirine's RS EMA by using a superior MA: Ehlers Super Smoother.
In January 2022 edition of TASC Vitaly Apirine introduced his Relative Strength Exponential Moving Average. A concept not entirely new, as Tushar Chande used a similar calculation for his VIDYA moving average. Both are based on the idea to change EMA length depending on the absolute RSI value, so the moving average would speed up then RSI is going up or down from the center value (when there is a significant directional price movement), and slow down when RSI returns to the center value (when there is a neutral or sideways movement). That way EMA responsiveness would increase where it matters most, but decrease where there is a high probability of whipsaw.
There are only two main differences between VIDYA and RS EMA:
RSI internal smoothing - VIDYA uses SMA, as Chande's CMO is an RSI with SMA; RS EMA uses EMA
Change direction - VIDYA sets the fastest length; RS EMA sets the slowest length
Both algorithms use EMA as the base of their calculation. As John F. Ehlers has shown in his article "Predictive and Successful Indicators" (January 2014 issue of TASC), EMA is not a very efficient filter, as it introduces a significant lag if sufficient smoothing is required. He describes a new smoothing filter called SuperSmoother, "that sharply attenuates aliasing noise while minimizing filtering lag." In other words, it provides better smoothing with lower lag than EMA.
In this script, I try to get the best of all these approaches and present to you Relative Strength Super Smoother. It uses RS EMA algorithm to calculate the SuperSmoother length. Unlike the original RS EMA algorithm, that has an abstract "multiplier" setting to scale the period variance (without this parameter, RSI would only allow it to speed up twice; Vitaly Apirine sets the multiplier to 10 by default), my implementation has explicit lower bound setting, so you can specify the exact range of calculated length.
Settings:
Lower Bound - fastest SuperSmoother length (when RSI is +100 or -100)
Upper Bound - slowest SuperSmoother length (when RSI is 0)
RSI Length - underlying RSI length. Unlike the original RSI that uses RMA as an internal smoothing algorithm, Vitaly Apirine uses EMA, which is approximately twice as fast (that is needed because he uses a generally long RSI length and RMA would be too slow for this). It is the same as the Upper Bound by default (0), as in the original implementation
The original RS EMA is also shown on the chart for comparison. The default multiplier of 10 for RS EMA means that the fastest EMA period is around 4. I use the fastest period of 8 by default. It does not introduce too much of a lag in comparison, but the curve is much smoother.
This script is just an interface for my public libraries. Check them out for more information.
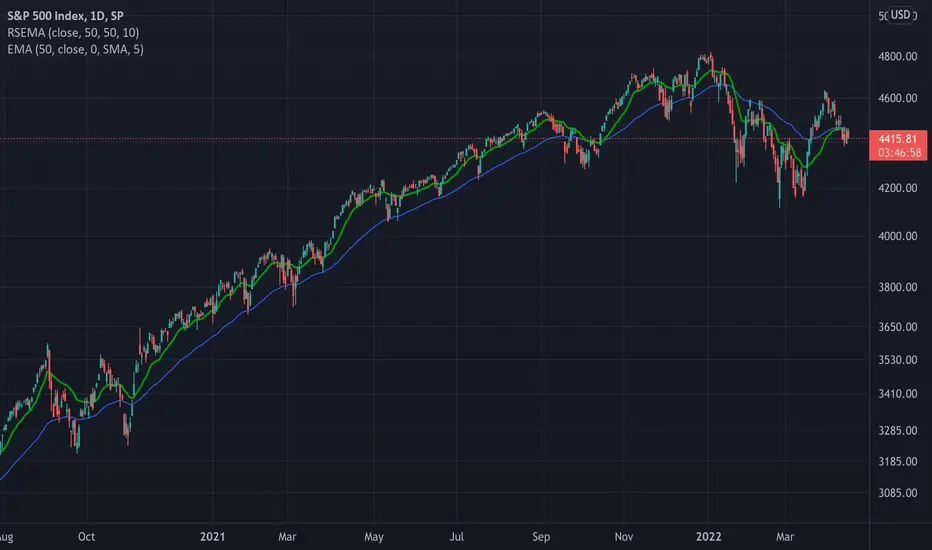
TASC 2022.05 Relative Strength Exponential Moving Average█ OVERVIEW
TASC's May 2022 edition Traders' Tips includes the "Relative Strength Moving Averages" article authored by Vitali Apirine. This is the code implementing the Relative Strength Exponential Moving Average (RS EMA) indicator introduced in this publication.
█ CONCEPTS
RS EMA is an adaptive trend-following indicator with reduced lag characteristics. By design, this was made possible by harnessing the relative strength of price. It operates in a similar fashion to a traditional EMA, but it has an improved response to price fluctuations. In a trading strategy, RS EMA can be used in conjunction with an EMA of the same length to identify the overall trend (see the preview chart). Alternatively, RS EMAs with different lengths can define turning points and filter price movements.
RS EMA is an adaptive trend-following indicator with reduced lag characteristics. By design, this was made possible by harnessing the relative strength of price. It operates in a similar fashion to a traditional EMA, but it has an improved response to price fluctuations.
█ CALCULATIONS
The following steps are used in the calculation process:
• Calculate the relative strength (RS) of a given length.
• Multiply RS by a chosen coefficient (multiplier) to adapt the EMA filtering the original time series. Calculate the EMA of the resulting time series.
The author recommends RS EMA(10,10,10) as typical settings, where the first parameter is the EMA length, the second parameter is the RS length, and the third parameter is the RS multiplier. Other values may be substituted depending on your trading style and goals.
The Brain Trust Presets Strategies [BTC / ETH] [PrismBot] [Lite]This strategy contains 9 different timeframe strategies (2 strategy types with pre-adjusted filter options for the different timeframes) tailored to BTC ( Bitcoin ) and ETH ( Ethereum ) on Binance. While I've listed these prebuilt strategies for specific timeframes, they are versatile enough to be checked and tested on other timeframes, and exchanges as well. I have been careful to avoid any curvefitting or overfitting. Included is useful default order settings, but we wanted to ensure you, the user, has control over the order settings for your own equity and trading.
These strategies are created, tailored, tested, and actively used by me.
It is up to you to do your own due diligence when testing these strategies on your exchange, and for your use, and PrismBot bears no responsibility for losses from the use of these strategies.
These strategies employ a variety of methods. Notable inclusions are other live strategies of mine including but not limited to:
ADX + MACD
RSI
Consolidations
Bull Bear Power
Volume Calculations
Open Interest Data
All of these setups include trend trading methods intended to maximize profitability in strong trending markets, and filters deployed to prevent failures in consolidation, though nothing is failproof.
You can control your leverage, quantity calculations, and other order settings. However, all other strategy input parameters are controlled by the strategy selectors.
Some strategies use 1.5 to 1 Risk to Reward ratio while others use 1:1.
How we execute trades for each strategy:
For 10m and 45m
we use a variety of settings for a Normalized MACD and ADX indicator. The thesis is we detect Normalized MACD crossovers at specific values and only allow trading of the strategy when the ADX is above a specific value.
For 15m, 1H, and 45m
we utilize the RSI crossovers of overbought and oversold and use the RSI moving average to filter trades. The thesis is we detect overbought for long and oversold for short.
For each strategy we use additional filters such as Bull Bear Power, Volume Flow, and Open Interest calculations to simply validate a trade.
Automatic Mode
In automatic mode, we detect your timeframe and current coin chart to decide one of the strategies from our database. If you want to manually select a different strategy or try the strategies on different cryptocurrencies, you can disable automatic mode entirely.

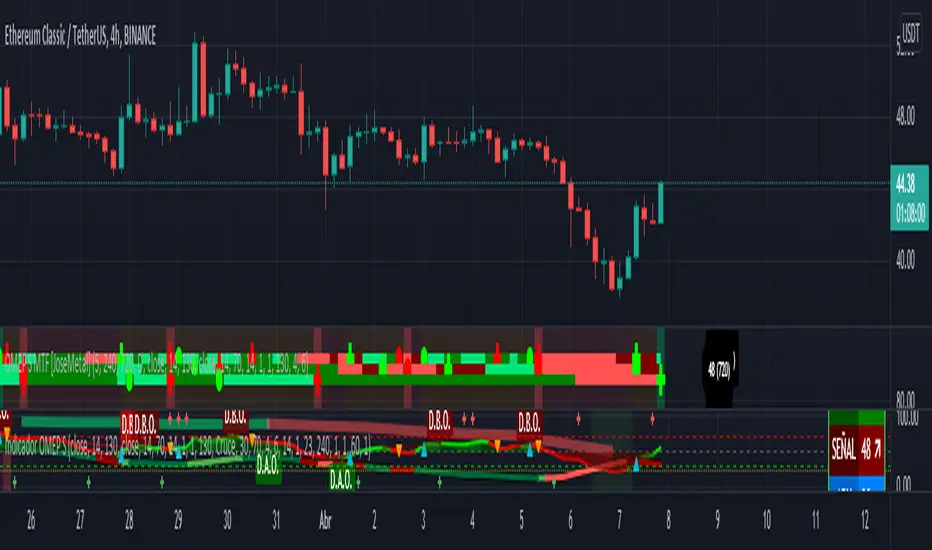
OMEP S MTF [JoseMetal]PERFECT LONG EXAMPLE:
imgur.com
PERFECT SHORT EXAMPLE:
imgur.com
============
ENGLISH
============
- Description:
This indicator is based in one of my indicators (check my profile to test it), the OMEP S, which is a mix of RSI, MFI and Stochastic in order to take advantage of the best of each indicator and fix their weaknesses.
The purpose of this indicator is to create a multiple time frame oracle with 3 different timeframes, which allows you to see the overall status at a glance and find the perfect trigger for an entry.
- Visual:
Colors are THE SAME as the main indicator (again, the "OMEP S") to prevent confusion.
DOTS: crossover/under of the OMEP with its signal line.
CROSSES: the same, BUT stronger signal because the crossover occurs in the upper/lower area, meaning better entry.
A tag showing the current OMEP value of all timeframes appears at the end (right) of the indicator.
- Usage and recommendations:
For 1H you can set timeframes to 1H, 3H, and 8H, for 4H you can use 4H, 12H and D.
Whenever you get 3 crosses and you get the highlighted color (green/red) matching with the crosses = perfect entry.
Getting (for example) 1H cross, 3H cross but 8h is still different color is usually just a bounce or change of trend, is recommended to trade with the trend.
- Customization:
Everything you can customize in the OMEP S is also here, RSI, MFI and Stochastic periods, relevance in the calculations.
You can customize 3 timeframes to be shown at the same time.
Also, the margin for the tags showing OMEP value.
============
ESPAÑOL
============
- Descripción:
Este indicador está basado en uno de mis indicadores (revisa mi perfil para probarlo), el OMEP S, que es una mezcla de RSI, MFI y Estocástico con el fin de aprovechar lo mejor de cada indicador y mejorar o eliminar sus debilidades.
El propósito de este indicador es crear un oráculo de 3 marcos de tiempo simultáneos, lo que le permite ver el estado general de un vistazo y encontrar el gatillo perfecto para una entrada.
- Visual:
Los colores son LOS MISMOS que los del indicador principal (de nuevo, el "OMEP S") para evitar confusiones.
PUNTOS: cruces del OMEP con su línea de señal.
CRUCE: lo mismo, PERO una señal más fuerte porque el cruce se produce en la zona superior/inferior, lo que significa una mejor entrada.
Al final (a la derecha) del indicador aparece una etiqueta con el valor actual del OMEP en todos los marcos de tiempo.
- Uso y recomendaciones:
Para 1H se recomienda las temporalidades de 1H, 3H y 8H, para 4H se recomienda utilizar 4H, 12H y D.
Siempre que obtenga 3 cruces y obtenga el color destacado (verde/rojo) que coincida con los cruces = entrada perfecta.
Si se suceden 3 cruces sin que ninguna cambie de estado se mostrará el fondo de color, destacando una entrada perfecta.
Obtener (por ejemplo) 1H cruz, 3H cruz pero 8h sigue siendo de color diferente suele ser solo un rebote o cambio de tendencia, se recomienda operar con la tendencia y evitar esos casos o no optar por un take profit muy alejado.
- Personalización:
Todo lo que se puede personalizar en el OMEP S también está aquí, RSI, MFI y periodos estocásticos, relevancia en los cálculos.
Se pueden personalizar 3 marcos de tiempo para que se muestren al mismo tiempo.
También, se puede configurar el margen de las etiquetas en las que se muestra el valor del OMEP para cada temporalidad.
Spot [Moto]Hello traders,
This indicator was primarily designed to show the dominating influence of the underlying spot asset while trading perpetual futures, specifically on Binance.
IMPORTANT: In order for this indicator to work properly/accurately you must be observing a Binance Perpetual future chart. The indicator detects which perpetual future symbol you're observing and changes its comparative metrics accordingly. If you're observing some other chart family, it will either be inaccurate or default to Binance spot BTC vs Binance perp BTC.
In my opinion spot price and metrics are more important to observe than derivatives. If I'm looking for entries or exits I want to know that spot is leading the way, and with evidential conviction. This indicator/signal is designed to be used in context and not to be the sole metrics observed. By comparing the spot chart metrics and the respective spot chart metrics, one is able to ascertain which candles are predominantly 'lead' or dominant via spot price action or conversely derivative lead. Generally, I've found, derivative lead moves have a highly likelihood of reverting
1) Spot engulfing - When spot has exerted control successfully on the current candlestick
This and other plot shapes contain plot shape sizing options and are optionally filtered via the cycled Rsi in the inputs
Smaller plot shapes (auto-sized) show when the candle is spot influenced, but not engulfing.
2) Spot Candle reversals - "E" and "e" plot shapes
These signals are sequential engulfing and opposing candles. "E" being when sequential engulfing candles print, "e" forms when spot candles are sequential, opposing, but not engulfing.
3) HTF Spot engulfing - Same as above but these are on a high time frame reference which have repainting on by default (optional in input).
These will indicate on lower time frame candles if that higher time frame is being spot influences + engulfing. These are hard set to daily, 3 day, and weekly references.
4) Bear / Bull Sequences: "Strong" / "Weak" plot shapes
These signals are looking for a Rsi mid-line (50) 'bounce' among the last four candles on the observed time frame. For example, this will give a signal when the rsi is above, below, below, and back above the 50 on the cycled Rsi.
5) "Prox" plot shapes - "P" and "Prox"
These plot shapes are purely based on Rsi and the confluence between two time frames. Signals occur when the low time frame and high time frame are near the 50 line of their respective Rsi but on opposing sides. There are two sets of these, comprising two different (optional) times frames each. Essentially these signals are to point out potential places of cascade in either direction. If however the market decides to "save" price, action can continue or perhaps violently push in the opposite direction. Consider them warnings to either follow or take advantage of. "P" plots indicate the lower time frame set, while "Prox" indicate the higher time frame signals. These signals can be optionally filtered by Rsi-Vwap directional bias, i.e above or below its "normal" range.
6) Simultaneous Rsi signals - "S"
These signals (optionally shown) print when two Rsi of two different time frame are simultaneously above their 50 mid-line but within a certain distance from the 50, with the candle in the preferred direction, and filtered via Rsi-Vwap. Time frame resolutions can be changes in the settings.
7) Reversion signals (Work in progress) - "R" plot shapes
These signals indicate via a set price difference when candles are of a certain size ($) and are derivative lead. Users can change the dollar change threshold in the settings.
8) Bar-coloring is provided on the more important signals
9) Alerts for almost all of the aforementioned metrics are included
Thanks,
DM for access

Bogdan Ciocoiu - LitigatorDescription
The Litigator is an indicator that encapsulates the value delivered by the Relative Strength Index, Ultimate Oscillator, Stochastic and Money Flow Index algorithms to produce signals enabling users to enter positions in ideal market conditions. The Litigator integrates the value delivered by the above four algorithms into one script.
This indicator is handy when trading continuation/reversal divergence strategies in conjunction with price action.
Uniqueness
The Litigator's uniqueness stands from integrating the above algorithms into the same visual area and leveraging preconfigured parameters suitable for short term scalping (1-5 minutes).
In addition, the Litigator allows configuring the above four algorithms in such a way to coordinate signals by colour-coding or shape thickness to aid the user with identifying any emerging patterns quicker.
Furthermore, Moonshot's uniqueness is also reflected in the way it has standardised the outputs of each algorithm to look and feel the same, and in doing so, enabling users to plug them in/out as needed. This also includes ensuring the ratios of the shapes are similar (applicable to the same scale).
Open-source
The indicator uses the following open-source scripts/algorithms:
www.tradingview.com
www.tradingview.com
www.tradingview.com
www.tradingview.com

Screener for 40+ instrumentsAs you probably know in TradingView there is a limit of 40 instruments in one custom screener.
I created a script that will allow you to scan more symbols.
The idea of it is pretty simple. You have to add a screener a few times on your screen with a different set of symbols. Then select column width (as % of your chart width) and # of the screener right to left.
Script will plot #1 screener next to the right border. For #2 and all next tables, the script will compute the needed offset and will draw it on the left. This way it will look like one table and not a few separate indicators.
I created a script with an RSI screener, but you can create more complicated examples with it.
Off course, that's not a silver bullet solution but might work for some of you.
Disclaimer
Please remember that past performance may not be indicative of future results.
Due to various factors, including changing market conditions, the strategy may no longer perform as well as in historical backtesting.
This post and the script don’t provide any financial advice.

Volatility Adapted Relative StrengthVARS uses a stock's ALPHA in comparison to the SPX to determine whether there is RS on an volatility adjusted basis.