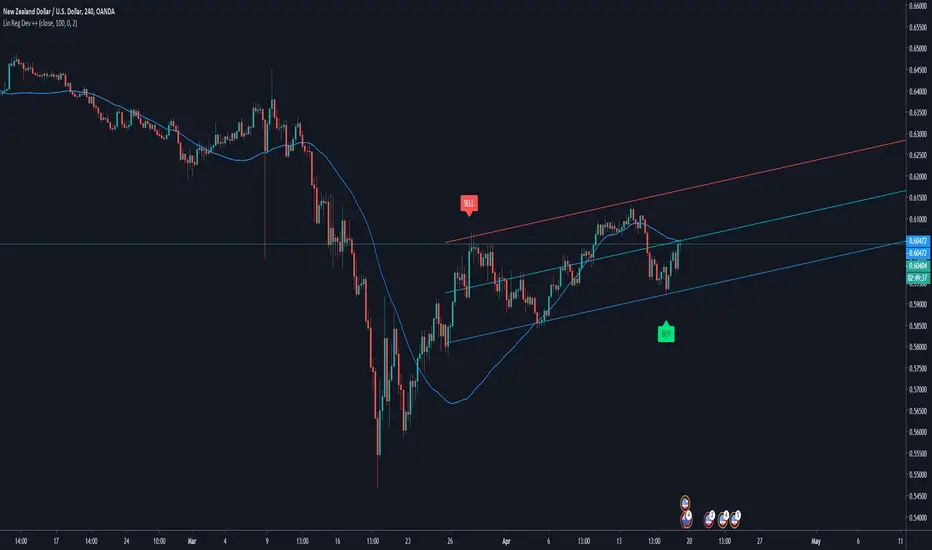
Linear Regression ChannelHello Traders,
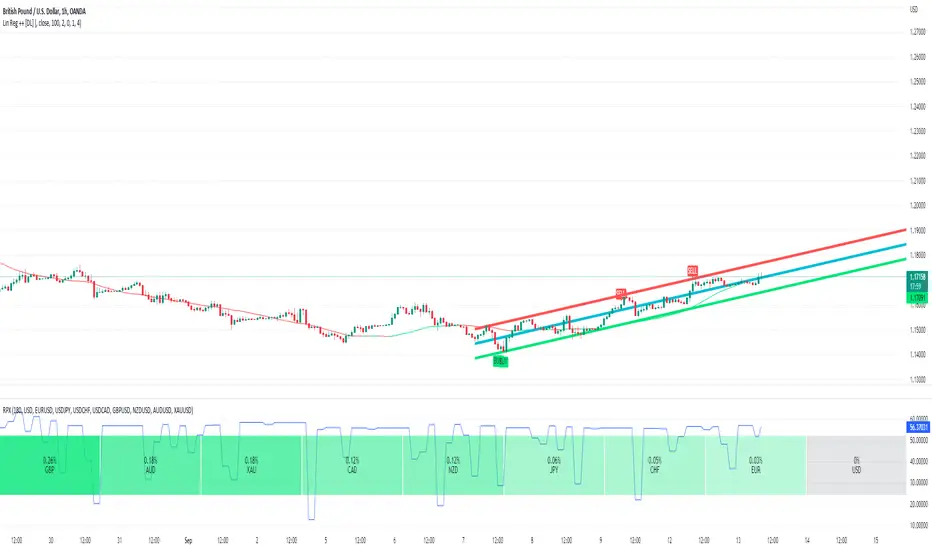
There are several nice Linear Regression Channel scripts in the Public Library. and I tried to make one with some extra features too. This one can check if the Price breaks the channel and it shows where is was broken. Also it checks the momentum of the channel and shows it's increasing/decreasing/equal in a label, shape of the label also changes. The line colors change according to direction.
using the options, you can;
- Set the Source (Close, HL2 etc)
- Set the Channel length
- Set Deviation
- Change Up/Down Line colors
- Show/hide broken channels
- Change line width
meaning of arrows:
⇑ : Uptrend and moment incresing
⇗ : Uptrend and moment decreasing
⇓ : Downtrend and moment incresing
⇘ : Downtrend and moment decreasing
⇒ : No trend
An example for how color of lines, arrow direction and shape of label change.
Enjoy!
Regression

Diff to MeanSimple tool to find when to buy in bull market, and when to sell when bull ended.
26 EMA on weekly seems to be a decent combination for 2017 bull market.
Use it and find your combination, and hope it guide you through current bull market.

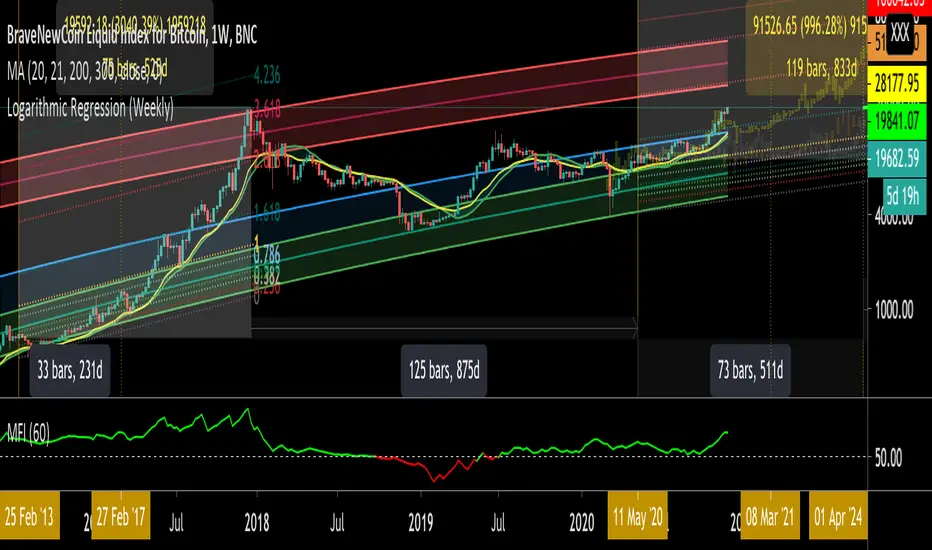
Logarithmic Regression (Weekly)This script is a combination of different logarithmic regression fits on weekly BTC data. It is meant to be used only on the weekly timeframe and on the BLX chart for bitcoin. The "fair value" line is still subjective, as it is only a regression and does not take into account other metrics.
Auto Linear Regression ChannelA Linear Regression Channel gives more objective potential buy and sell signals based on price volatility. It consists of three parts:
Linear Regression Line: A Linear Regression Line is a straight line that best fits the prices between a starting price point and an ending price point. A "best fit" means that a line is constructed where there is the least amount of space between the price points and the actual Linear Regression Line. The Linear Regression Line is mainly used to determine trend direction.
Traders usually view the Linear Regression Line as the fair value price for the stocks. When prices deviate above or below, traders may expect prices to go back towards the Linear Regression Line. As a consequence, when prices are below the Linear Regression Line, this could be viewed by some traders as a good time to buy, and when prices are above the Linear Regression Line, a trader might sell. Of course other technical indicators would be used to confirm these inexact buy and sell signals.
Upper Channel Line: A line that runs parallel to the Linear Regression Line and is usually one to two standard deviations above the Linear Regression Line.
Lower Channel Line: This line runs parallel to the Linear Regression Line and is usually one to two standard deviations below the Linear Regression Line.
The upper and lower channel lines contain between themselves either 68% of all prices (if 1 standard deviation is used) or 95% of all prices (if 2 standard deviations are used). When prices break outside of the channels, either: Buy or sell opportunities are present. Or the prior trend could be ending.
Linear Regression Channel Possible Buy Signal
When price falls below the lower channel line, and a trader expects a continuation of the trend, then a trader might consider it as a buy signal.
Linear Regression Channel Possible Sell Signal
An opportunity for selling might occur when prices break above the upper channel line, but a continuation of the trend is expected by the trader. Other confirmation signs like prices closing back inside the linear regression channel might be used to initiate potential buy or sell orders. Also, other technical indicators might be used to confirm.
Trend Reversals
When price closes outside of the Linear Regression Channel for long periods of time, this is often interpreted as an early signal that the past price trend may be breaking and a significant reversal might be near. Linear Regression Channels are quite useful technical analysis charting tools. In addition to identifying trends and trend direction, the use of standard deviation gives traders ideas as to when prices are becoming overbought or oversold relative to the long term trend.
Default Parameters:
Period: (100) The number of bars to use in the calculation.
This Linear Regression Channel Has 1st, 2nd, and 3rd Deviation lines also the MId Deviation Lines are added for 1.5 and 2.5 area.
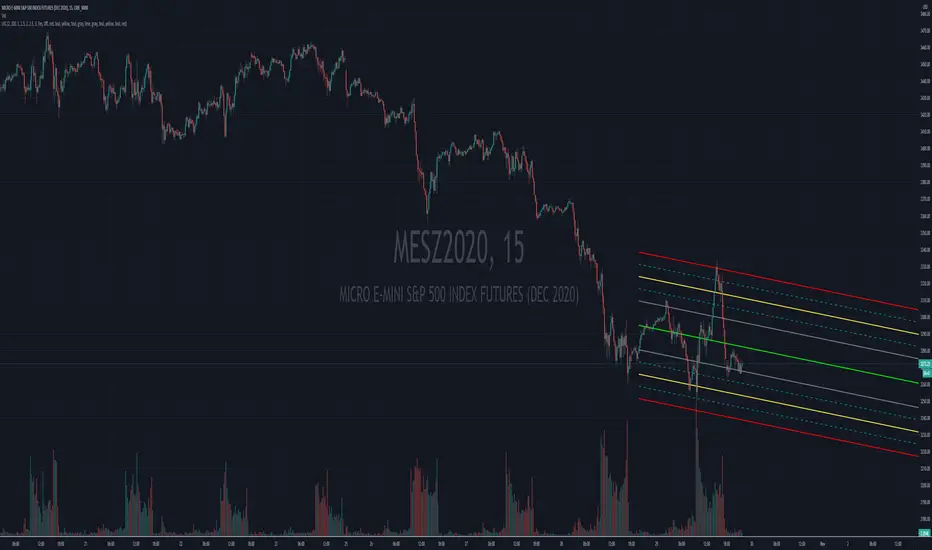
GAURs Polynomial Regression ChannelsThanks to The Sweet Lord , here is the Gaur's Polynomial Regression Channel.
Its a Polynomial Regression Channel but applied a little differently. Wont go into technical details much. Overview of options is as follows-
- - - - - - - - - - - - - - - - - - - - - - - - - - - - - - - - - - - - - - - - - - - - - - - - - - - - - - - - - - - - - - - - - - - - - - - - - - - - - - - - - - - - - - - - - - - - - - - -
Channel Options
- - - - - - - - - - - - - - - - - - - - - - - - - - - - - - - - - - - - - - - - - - - - - - - - - - - - - - - - - - - - - - - - - - - - - - - - - - - - - - - - - - - - - - - - - - - - - - - -
1. Degree of Polynomial: 1/2/3
Default = 3
Defines the degree of polynomials - 1,2,3. Note here, degree 1 will not be a straight line since its applied differently.
Try different degrees for different fits and market conditions.
2. Channel Length:
Default 30 (candles)
You can go beyond 100 or 200 candle lengths but smaller is the usual preference of Poly-Reg-channel traders. It all depends on market conditions and your style of trading. Do your research. I am usually comfortable with a range of 20-50 (in crypto markets).
3. Basis of Channel height/boundries: ATR/Manual
Default: ATR
ATR provides a dynamically adjusted entry/exit bounds of the channels. As ATR changes, the channel bounds also changes its height. It can also be fixed manually. Manual heights wont change automatically.
4. Basis of Y-Value: open/close/ sma / ema / wma /hilow
Default: close
Y- value is the y value of the (x,y) coordinates used while calculating the regression coefficients. Dont worry about it, its nothing serious.
5. Apply channel smoothning using sma?: Yes/No
Default: Yes
Without smoothning, the channel does not "look" good.
6. Shaded Area Height Percentage:
Its the extra margin for the channel. Its in percentage of the total height (defined 3 above) of channels. The shaded area provides an extra allowance for your entries or exits beyond the ATR or manual heights.
7. Plot RSI?: Yes/No
Default: Yes
Plots RSI (orange line in between the channel - its different from the dotted center line) considering the downbound of channels as 0 (oversold) and upbound of channels as 100 (overbought)
8. Plot 200 sma?: Yes/No
Default: Yes
It plots a 200 period fast (green) and 225 period slow (red) sma . I usually use two MAs. Its visually very easy to understand.
- - - - - - - - - - - - - - - - - - - - - - - - - - - - - - - - - - - - - - - - - - - - - - - - - - - - - - - - - - - - - - - - - - - - - - - - - - - - - - - - - - - - - - - - - - - - - - - -
Sample Strategy
- - - - - - - - - - - - - - - - - - - - - - - - - - - - - - - - - - - - - - - - - - - - - - - - - - - - - - - - - - - - - - - - - - - - - - - - - - - - - - - - - - - - - - - - - - - - - - - -
You can develop your own strategy with the channels. But following is just one of the ways you can trade.
Best Application: Ranging markets. But can be happily used in volatile conditions, with a little experience.
1. SMA: -- (this condition is optional really)
If green (200) is above red (225) go only long. If red is above green go only short. Defines long term trend of the market.
2. Channel slope: -- (this stuff needs practice/experience)
Depending on the channel slope, like if its tending to go up or down, you can choose to take only short or long trades. It defines short term momentum of the market.
3. ATR based heights:
Since its ATR based, the channel height are our natural entry and exit points.
Long:
When price touches lower shaded area, consider possible long entry. Exit on price entering the upper shaded area.
Short:
Enter on upper bound shaded area, exit on lower.
4. RSI:
For additional conformations. Again note, the RSI considers the lower bound of channel as 0 and upper as 100. But since, the channel moves up and down, the RSI will also move not only as RSI but also with the channel. Meaning, say if the RSI is valued at 50, then it will be near the center of the channel but since the center changes as time and price changes, the RSI valued at 50 at different times will not be at the same horizontal level respect to the graph, although it will be at the same level (center) respect to the channel.
5. PRC Channel Percentage label:
This label is at the lower side a bit ahead of the current candle. Provides you info on what is the channel percentage. This is especially helpful in crypto markets to gauge your possible percentage profit where profits can be much higher than forex or other instruments. It can also helps you select a suitable market/instrument if the channels are based on ATR.
6. Extra indicators:
I usually use stochastic along with this setup for extra conformations.
- - - - - - - - - - - - - - - - - - - - - - - - - - - - - - - - - - - - - - - - - - - - - - - - - - - - - - - - - - - - - - - - - - - - - - - - - - - - - - - - - - - - - - - - - - - - - - - -
Donate
- - - - - - - - - - - - - - - - - - - - - - - - - - - - - - - - - - - - - - - - - - - - - - - - - - - - - - - - - - - - - - - - - - - - - - - - - - - - - - - - - - - - - - - - - - - - - - - -
Use freely and donate generously if you find value. Your help will really help.
I had earlier provided BTC addresses for donations but it seems to violate TV House rules.
Hope they make TV coins redeemable in future.
- Pranav Joshi
- - - - - - - - - - - - - - - - - - - - - - - - - - - - - - - - - - - - - - - - - - - - - - - - - - - - - - - - - - - - - - - - - - - - - - - - - - - - - - - - - - - - - - - - - - - - - - - -
Extra Info
- - - - - - - - - - - - - - - - - - - - - - - - - - - - - - - - - - - - - - - - - - - - - - - - - - - - - - - - - - - - - - - - - - - - - - - - - - - - - - - - - - - - - - - - - - - - - - - -
// © cpranavjoshi
// special thanks to the "Trading View" people for providing this great platform for free
// ------------------------
// MATH
// ------------------------
// special thanks to an article on the web that provided layman friendly explanation of the maths
// unfortunately i wont be able to provide the link to that article owing to TV restrictions, though i sincerely would have liked to credit the author.
// Google search this phrase, and you should be able to get it in one of the first results - "polynomialregression Mathematics of Polynomial Regression"
// my regression math calculation is a further resolution upon the generalized matrix formula given in the that article.
// the generalized matrix looks scary but in fact its much simpler than one may assume
// the summation sign things are just float numbers that can be easily found out
// so we get a matrix with number of equations equal to the number of unknowns.
// e.g. if its a 3rd degree poly, it has 4 unknowns (c0,c1,c2,c3) with 4 equations as in the generalized matrix
// it can be resolved by simple algebra
// Note: the results have been verified with excel using same input data points.
// pine was difficult for me so i coded it in python first to verify
// ------------------------
// WHY
// ------------------------
// this script was coded because Pranav badly needed Polynomial channels (had used them in mt4 earlier)
// and at the time of this coding, i could not find any readily available script in the trading view public library ( tnx public)
// the complex math was probably the hurdle
// i m not good in maths, but by the Will of the Lord, i could resolve the issue with simple algebra and logic
// ------------------------
// PINE
// ------------------------
// i am just an average (even poor probably) programmer and pine script is not my language
// this is a humble attempt to write my first pine with whatever i could do quickly
// experts - feel free to develop if needed. have used some workarounds in drawings/plottings. rectify them if possible
//
//
// - Pranav Joshi

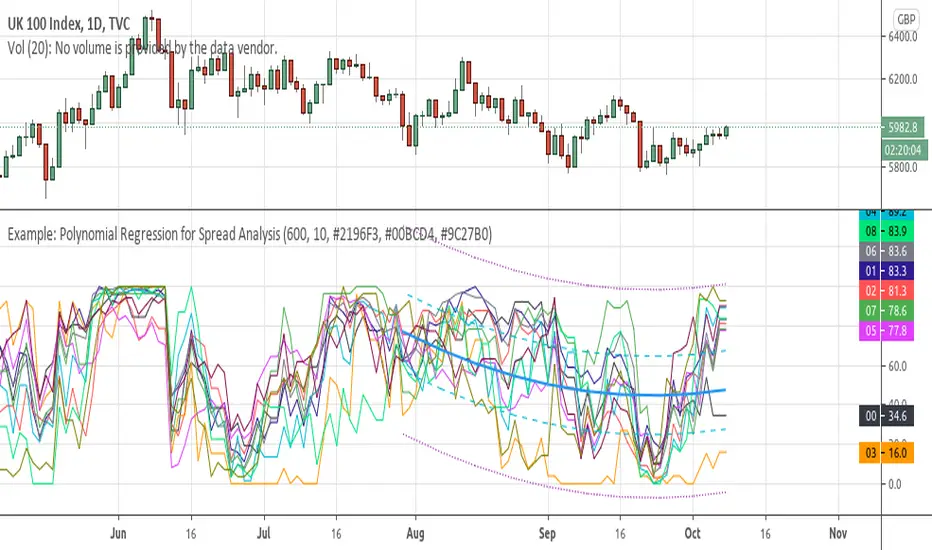
Example: Polynomial Regression for Spread AnalysisExample of applying polynomial regression channel to spreads or hedges between 2 assets.
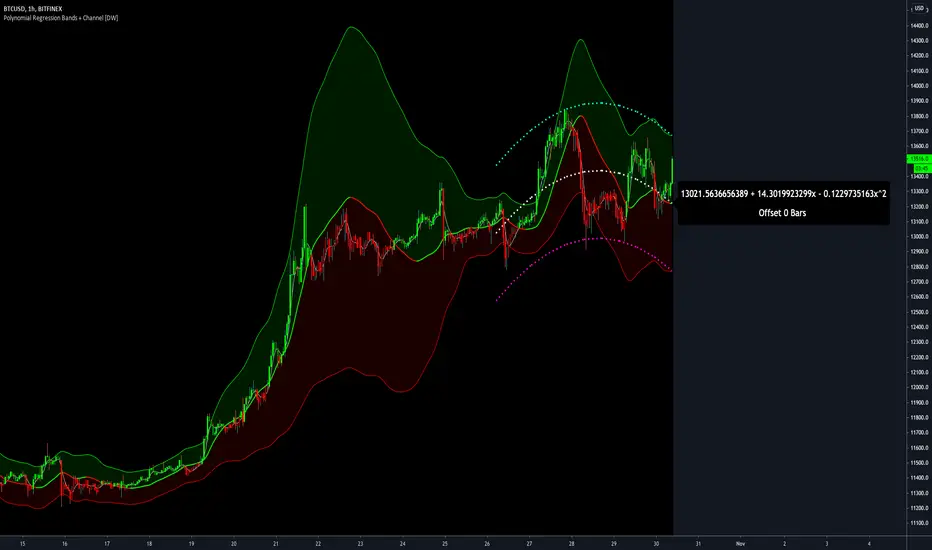
Polynomial Regression Bands + Channel [DW]This is an experimental study designed to calculate polynomial regression for any order polynomial that TV is able to support.
This study aims to educate users on polynomial curve fitting, and the derivation process of Least Squares Moving Averages (LSMAs).
I also designed this study with the intent of showcasing some of the capabilities and potential applications of TV's fantastic new array functions.
Polynomial regression is a form of regression analysis in which the relationship between the independent variable x and the dependent variable y is modeled as a polynomial of nth degree (order).
For clarification, linear regression can also be described as a first order polynomial regression. The process of deriving linear, quadratic, cubic, and higher order polynomial relationships is all the same.
In addition, although deriving a polynomial regression equation results in a nonlinear output, the process of solving for polynomials by least squares is actually a special case of multiple linear regression.
So, just like in multiple linear regression, polynomial regression can be solved in essentially the same way through a system of linear equations.
In this study, you are first given the option to smooth the input data using the 2 pole Super Smoother Filter from John Ehlers.
I chose this specific filter because I find it provides superior smoothing with low lag and fairly clean cutoff. You can, of course, implement your own filter functions to see how they compare if you feel like experimenting.
Filtering noise prior to regression calculation can be useful for providing a more stable estimation since least squares regression can be rather sensitive to noise.
This is especially true on lower sampling lengths and higher degree polynomials since the regression output becomes more "overfit" to the sample data.
Next, data arrays are populated for the x-axis and y-axis values. These are the main datasets utilized in the rest of the calculations.
To keep the calculations more numerically stable for higher periods and orders, the x array is filled with integers 1 through the sampling period rather than using current bar numbers.
This process can be thought of as shifting the origin of the x-axis as new data emerges.
This keeps the axis values significantly lower than the 10k+ bar values, thus maintaining more numerical stability at higher orders and sample lengths.
The data arrays are then used to create a pseudo 2D matrix of x power sums, and a vector of x power*y sums.
These matrices are a representation the system of equations that need to be solved in order to find the regression coefficients.
Below, you'll see some examples of the pattern of equations used to solve for our coefficients represented in augmented matrix form.
For example, the augmented matrix for the system equations required to solve a second order (quadratic) polynomial regression by least squares is formed like this:
(∑x^0 ∑x^1 ∑x^2 | ∑(x^0)y)
(∑x^1 ∑x^2 ∑x^3 | ∑(x^1)y)
(∑x^2 ∑x^3 ∑x^4 | ∑(x^2)y)
The augmented matrix for the third order (cubic) system is formed like this:
(∑x^0 ∑x^1 ∑x^2 ∑x^3 | ∑(x^0)y)
(∑x^1 ∑x^2 ∑x^3 ∑x^4 | ∑(x^1)y)
(∑x^2 ∑x^3 ∑x^4 ∑x^5 | ∑(x^2)y)
(∑x^3 ∑x^4 ∑x^5 ∑x^6 | ∑(x^3)y)
This pattern continues for any n ordered polynomial regression, in which the coefficient matrix is a n + 1 wide square matrix with the last term being ∑x^2n, and the last term of the result vector being ∑(x^n)y.
Thanks to this pattern, it's rather convenient to solve the for our regression coefficients of any nth degree polynomial by a number of different methods.
In this script, I utilize a process known as LU Decomposition to solve for the regression coefficients.
Lower-upper (LU) Decomposition is a neat form of matrix manipulation that expresses a 2D matrix as the product of lower and upper triangular matrices.
This decomposition method is incredibly handy for solving systems of equations, calculating determinants, and inverting matrices.
For a linear system Ax=b, where A is our coefficient matrix, x is our vector of unknowns, and b is our vector of results, LU Decomposition turns our system into LUx=b.
We can then factor this into two separate matrix equations and solve the system using these two simple steps:
1. Solve Ly=b for y, where y is a new vector of unknowns that satisfies the equation, using forward substitution.
2. Solve Ux=y for x using backward substitution. This gives us the values of our original unknowns - in this case, the coefficients for our regression equation.
After solving for the regression coefficients, the values are then plugged into our regression equation:
Y = a0 + a1*x + a1*x^2 + ... + an*x^n, where a() is the ()th coefficient in ascending order and n is the polynomial degree.
From here, an array of curve values for the period based on the current equation is populated, and standard deviation is added to and subtracted from the equation to calculate the channel high and low levels.
The calculated curve values can also be shifted to the left or right using the "Regression Offset" input
Changing the offset parameter will move the curve left for negative values, and right for positive values.
This offset parameter shifts the curve points within our window while using the same equation, allowing you to use offset datapoints on the regression curve to calculate the LSMA and bands.
The curve and channel's appearance is optionally approximated using Pine's v4 line tools to draw segments.
Since there is a limitation on how many lines can be displayed per script, each curve consists of 10 segments with lengths determined by a user defined step size. In total, there are 30 lines displayed at once when active.
By default, the step size is 10, meaning each segment is 10 bars long. This is because the default sampling period is 100, so this step size will show the approximate curve for the entire period.
When adjusting your sampling period, be sure to adjust your step size accordingly when curve drawing is active if you want to see the full approximate curve for the period.
Note that when you have a larger step size, you will see more seemingly "sharp" turning points on the polynomial curve, especially on higher degree polynomials.
The polynomial functions that are calculated are continuous and differentiable across all points. The perceived sharpness is simply due to our limitation on available lines to draw them.
The approximate channel drawings also come equipped with style inputs, so you can control the type, color, and width of the regression, channel high, and channel low curves.
I also included an input to determine if the curves are updated continuously, or only upon the closing of a bar for reduced runtime demands. More about why this is important in the notes below.
For additional reference, I also included the option to display the current regression equation.
This allows you to easily track the polynomial function you're using, and to confirm that the polynomial is properly supported within Pine.
There are some cases that aren't supported properly due to Pine's limitations. More about this in the notes on the bottom.
In addition, I included a line of text beneath the equation to indicate how many bars left or right the calculated curve data is currently shifted.
The display label comes equipped with style editing inputs, so you can control the size, background color, and text color of the equation display.
The Polynomial LSMA, high band, and low band in this script are generated by tracking the current endpoints of the regression, channel high, and channel low curves respectively.
The output of these bands is similar in nature to Bollinger Bands, but with an obviously different derivation process.
By displaying the LSMA and bands in tandem with the polynomial channel, it's easy to visualize how LSMAs are derived, and how the process that goes into them is drastically different from a typical moving average.
The main difference between LSMA and other MAs is that LSMA is showing the value of the regression curve on the current bar, which is the result of a modelled relationship between x and the expected value of y.
With other MA / filter types, they are typically just averaging or frequency filtering the samples. This is an important distinction in interpretation. However, both can be applied similarly when trading.
An important distinction with the LSMA in this script is that since we can model higher degree polynomial relationships, the LSMA here is not limited to only linear as it is in TV's built in LSMA.
Bar colors are also included in this script. The color scheme is based on disparity between source and the LSMA.
This script is a great study for educating yourself on the process that goes into polynomial regression, as well as one of the many processes computers utilize to solve systems of equations.
Also, the Polynomial LSMA and bands are great components to try implementing into your own analysis setup.
I hope you all enjoy it!
--------------------------------------------------------
NOTES:
- Even though the algorithm used in this script can be implemented to find any order polynomial relationship, TV has a limit on the significant figures for its floating point outputs.
This means that as you increase your sampling period and / or polynomial order, some higher order coefficients will be output as 0 due to floating point round-off.
There is currently no viable workaround for this issue since there isn't a way to calculate more significant figures than the limit.
However, in my humble opinion, fitting a polynomial higher than cubic to most time series data is "overkill" due to bias-variance tradeoff.
Although, this tradeoff is also dependent on the sampling period. Keep that in mind. A good rule of thumb is to aim for a nice "middle ground" between bias and variance.
If TV ever chooses to expand its significant figure limits, then it will be possible to accurately calculate even higher order polynomials and periods if you feel the desire to do so.
To test if your polynomial is properly supported within Pine's constraints, check the equation label.
If you see a coefficient value of 0 in front of any of the x values, reduce your period and / or polynomial order.
- Although this algorithm has less computational complexity than most other linear system solving methods, this script itself can still be rather demanding on runtime resources - especially when drawing the curves.
In the event you find your current configuration is throwing back an error saying that the calculation takes too long, there are a few things you can try:
-> Refresh your chart or hide and unhide the indicator.
The runtime environment on TV is very dynamic and the allocation of available memory varies with collective server usage.
By refreshing, you can often get it to process since you're basically just waiting for your allotment to increase. This method works well in a lot of cases.
-> Change the curve update frequency to "Close Only".
If you've tried refreshing multiple times and still have the error, your configuration may simply be too demanding of resources.
v4 drawing objects, most notably lines, can be highly taxing on the servers. That's why Pine has a limit on how many can be displayed in the first place.
By limiting the curve updates to only bar closes, this will significantly reduce the runtime needs of the lines since they will only be calculated once per bar.
Note that doing this will only limit the visual output of the curve segments. It has no impact on regression calculation, equation display, or LSMA and band displays.
-> Uncheck the display boxes for the drawing objects.
If you still have troubles after trying the above options, then simply stop displaying the curve - unless it's important to you.
As I mentioned, v4 drawing objects can be rather resource intensive. So a simple fix that often works when other things fail is to just stop them from being displayed.
-> Reduce sampling period, polynomial order, or curve drawing step size.
If you're having runtime errors and don't want to sacrifice the curve drawings, then you'll need to reduce the calculation complexity.
If you're using a large sampling period, or high order polynomial, the operational complexity becomes significantly higher than lower periods and orders.
When you have larger step sizes, more historical referencing is used for x-axis locations, which does have an impact as well.
By reducing these parameters, the runtime issue will often be solved.
Another important detail to note with this is that you may have configurations that work just fine in real time, but struggle to load properly in replay mode.
This is because the replay framework also requires its own allotment of runtime, so that must be taken into consideration as well.
- Please note that the line and label objects are reprinted as new data emerges. That's simply the nature of drawing objects vs standard plots.
I do not recommend or endorse basing your trading decisions based on the drawn curve. That component is merely to serve as a visual reference of the current polynomial relationship.
No repainting occurs with the Polynomial LSMA and bands though. Once the bar is closed, that bar's calculated values are set.
So when using the LSMA and bands for trading purposes, you can rest easy knowing that history won't change on you when you come back to view them.
- For those who intend on utilizing or modifying the functions and calculations in this script for their own scripts, I included debug dialogues in the script for all of the arrays to make the process easier.
To use the debugs, see the "Debugs" section at the bottom. All dialogues are commented out by default.
The debugs are displayed using label objects. By default, I have them all located to the right of current price.
If you wish to display multiple debugs at once, it will be up to you to decide on display locations at your leisure.
When using the debugs, I recommend commenting out the other drawing objects (or even all plots) in the script to prevent runtime issues and overlapping displays.
My BTC log curveLogarithmic regression of the USD price of Bitcoin , calculated according to the equation:
y=A*exp(beta*x^lambda + c) + m*x + b
where x is the number of days since the genesis block. All parameters are editable in the script options.

Function Polynomial RegressionDescription:
A function that returns a polynomial regression and deviation information for a data set.
Inputs:
_X: Array containing x data points.
_Y: Array containing y data points.
Outputs:
_predictions: Array with adjusted _Y values.
_max_dev: Max deviation from the mean.
_min_dev: Min deviation from the mean.
_stdev/_sizeX: Average deviation from the mean.
Resources:
en.wikipedia.org
rosettacode.org

Function - Linear RegressionDescription:
A Function that returns a linear regression channel using (X,Y) vector points.
Inputs:
_X: Array containing x data points.¹
_Y: Array containing y data points.¹
Note:
¹: _X and _Y size must match.
Outputs:
_predictions: Array with adjusted _Y values at _X.
_max_dev: Max deviation from the mean.
_min_dev: Min deviation from the mean.
_stdev/_sizeX: Average deviation from the mean.
Resources:
www.statisticshowto.com
en.wikipedia.org

Trend Following with Moving AveragesHello Traders,
With the info "Trend is Your Friend ", you should not take position against the trend. This script checks multipte moving averages if they are above/below the closing price and try to find trend. The moving averages with the length 8, 13, 21, 34, 55, 89, 144, 233, 377 used. these are fibonacci numbers, but optionally you can change the lengths of each moving averages. while it's green you better take long positions, while it's red you better take short positions according to other indcators or tools.
Optionally you have "smoothing" option to get rid of whipsaws. it's enabled by default.
You have option to use following moving average types: EMA, SMA, RMA, WMA, VWMA. by default it's EMA
Also the script has "Resolution" option. with this option you can get the trend for other time frames, in following example 1h was set as for higher time frame on 15m chart:
This should not be used as buy/sell signal indicators as it's tries to find trend but not entry points, you should use other indicators (such RSI, Momentum) or other tools to find buy/sell signals.
Enjoy!

Optimized Linear Regression ChannelReturn a linear regression channel with a window size within the range (min, max) such that the R-squared is maximized, this allows a better estimate of an underlying linear trend, a better detection of significant historical supports and resistance points, and avoid finding a good window size manually.
Settings
Min : Minimum window size value
Max : Maximum window size value
Mult : Multiplicative factor for the rmse, control the channel width.
Src : Source input of the indicator
Details
The indicator displays the specific window size that maximizes the R-squared at the bottom of the lower channel.
When optimizing we want to find parameters such that they maximize or minimize a certain function, here the r-squared. The R-squared is given by 1 minus the ratio between the sum of squares (SSE) of the linear regression and the sum of squares of the mean. We know that the mean will always produce an SSE greater or equal to the one of the linear regression, so the R-squared will always be in a (0,1) range. In the case our data has a linear trend, the linear regression will have a better fit, thus having a lower SSE than the SSE of the mean, has such the ratio between the linear regression SSE and the mean SSE will be low, 1 minus this ratio will return a greater result. A lower R-squared will tell you that your linear regression produces a fit similar to the one produced by the mean. The R-squared is also given by the square of the correlation coefficient between the dependent and independent variables.
In pinescript optimization can be done by running a function inside a loop, we run the function for each setting and keep the one that produces the maximum or minimum result, however, it is not possible to do that with most built-in functions, including the function of interest, correlation , as such we must recreate a rolling correlation function that can be used inside loops, such functions are generally loops-free, this means that they are not computed using a loop in the first place, fortunately, the rolling correlation function is simply based on moving averages and standard deviations, both can be computed without using a loop by using cumulative sums, this is what is done in the code.
Note that because the R-squared is based on the SSE of the linear regression, maximizing the R-squared also minimizes the linear regression SSE, another thing that is minimized is the horizontality of the fit.
In the example above we have a total window size of 27, the script will try to find the setting that maximizes the R-squared, we must avoid every data points before the volatile bearish candle, using any of these data points will produce a poor fit, we see that the script avoid it, thus running as expected. Another interesting thing is that the best R-squared is not always associated to the lowest window size.
Note that optimization does not fix core problems in a model, with the linear regression we assume that our data set posses a linear trend, if it's not the case, then no matter how many settings you use you will still have a model that is not adapted to your data.

Linear Regression (All Data)The tool plots a linear regression line using the entire history of an instrument on chart. There are may be issues on intraday timeframes less then 1h. On daily, weekly and monthly charts it works without problem.
If an instrument has a lot of data points, you may not see the line (this is TV feature):
To fix that you need to scroll your chart to the left and find the starting point of the line:
And then do an auto-scroll to the last bar:

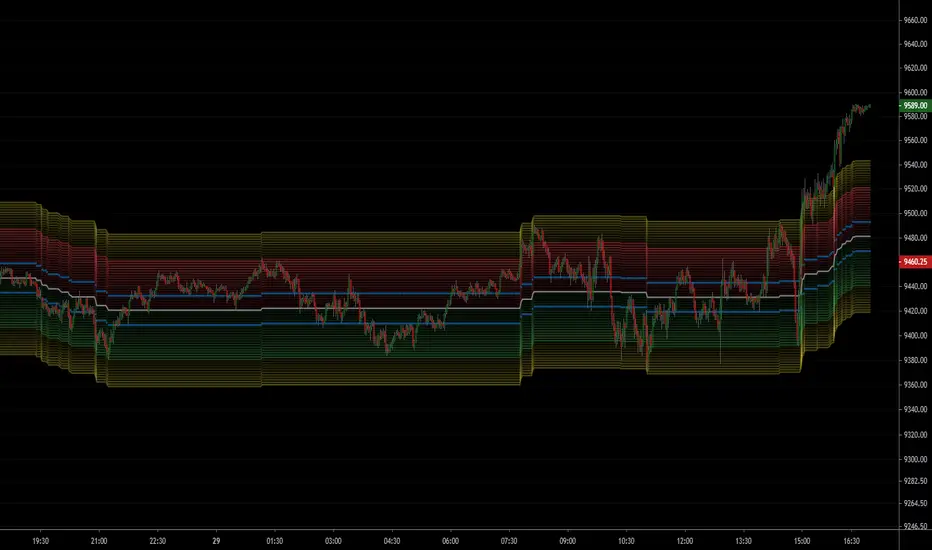
Dynamic Regression Bandings (Base10)Dynamic Regression Bandings (Base10) is designed to provide a statistical range of outlier pricing within an established trend. Instead of calculations being performed on a linear scale, spot price is adjusted logarithmically, allowing for regression to be performed over longer periods without compound movement creating abnormal behaviour.
The range is set through user input of a minimum and maximum values; from which the script identifies the backward length (candle count) with the greatest correlation to price. This process is performed for each candle, so the regression length may change dynamically across time. By doing this, we are able to look at the current candle for its probability of being an outlier compared to the mean of the regression. If the spot price is outside the range of the expected deviation (e.g. +/- 2 standard deviations from the mean); a buy or sell signal is triggered.
IMPORTANT: This does not aim to validate the volatility of a trend, so the user must identify the historical fit. It is recommended to use the replay functionality to make these adjustments with historical data in order to avoid over fitting the model to the data; which will create long term issues with performance.
When a trend is found in the specified range; it is assumed that the white noise (movement +/- to the trend) happens in a normal & unbiased way. In a fair market; the buyers and sells should balance themselves out in such a way that there is no inherent bias outside of the trend. As such, we can assume that almost all movement within the trend will be within +/- 3 standard deviations. So if the selected deviation range is greater than that; it is likely that the model is being over fit to account for extreme volatility.
Below are examples of the indicator on different charts:
USDAUD
BTCUSD
AMZN
A2M

Trend Lines ProHello Traders!
We need to make things better & better to solve the puzzle and I try to do my best on this way. now I am here with my new Trend Lines Pro script.
As you know, Trend Lines is very subjective and many people (even professionals) draw different Trend Lines on the same chart. This is confusing and there must be an automation to make the life easer. with this tool I tried to automate it.
The idea in this script is different from my previous trend lines scripts. In this, I use channel idea so it can check number of pivot points it contains, it checks H/L/C in the channels as well. it also checks the angle while choosing trend lines. then we get stronger and useful Trend Lines automatically.
There are some option in the script, let see one by one:
Pivot Period: The Length to calculate Pivot Highs/Lows
Source : Option to use "High/Low" or "Close" as the source for Pivot Points
Threshold Rate : This rate is used for channel width. it you give bigger numbers then you get bigger channels. it's 4 by default
Minimum Angle Rate for new Trendline: if there are different trend lines, there must be an angle between them to choose best trend lines. you can set the angle with this option.
Minimum Strength: there can be many trend lines but we need to choose/use stronger ones. with this option you can set the number of pivot points a trend channel have to contains.
Maximum Loopback Length: by default the script can check 40 pivot highs and 40 pivot lows but to make the script faster and useful I needed to add a limitation for the number of bars that the script can go back.
Show Trendlines as: you can see trend lines as "Trendline", "Channel", "Trend Channel". you can see examples below.
Enable Weak Trend Lines: if there is no trend lines strong enough (as defined in "Minimum Strength" option) you have option to see a weak trend line. that is useful sometimes. if you enable this option weak lines are shown as dotted lines.
Show Price Labels on Trendlines: the script can show the price levels to break trend lines. the examples are below
Line Style: trend lines can be Solid or Dashed as you wish
Color theme: colors of the Up/Down Trend lines can be set. 'Red', Lime, Blue, White, Black, Olive, Gray
you can see the Trend Lines as channels:
you can see Trend Channels to see the big picture.also there is dotted trend line as weak trend line defined above.
you can set color/width of trend lines as you wish.
the script is fast enough to run on 1sec chart:
you can use this script on any chart, fx pairs, stocks, indices etc
I made a short video to explain how to use it and some options:
Please PM for access.
Enjoy!
DISCLAIMER: No sharing, copying, reselling, modifying, or any other forms of use are authorized for our documents, script / strategy, and the information published with them. This informational planning script / strategy is strictly for individual use and educational purposes only. This is not financial or investment advice. Investments are always made at your own risk and are based on your personal judgement. I am not responsible for any losses you may incur. Please invest wisely.
Płatny skrypt

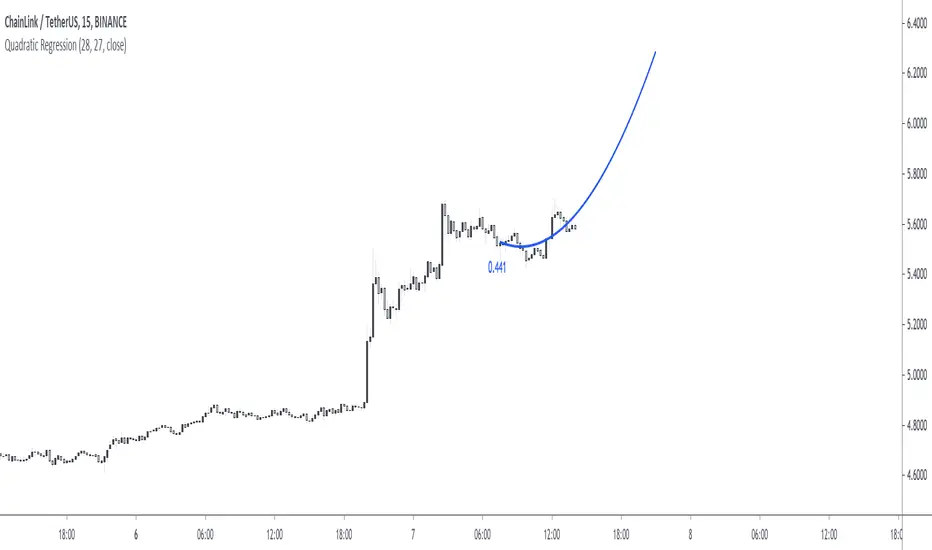
Quadratic RegressionFit a quadratic polynomial (parabola) to the last length data points by minimizing the sum of squares between the data and the fitted results. The script can extrapolate the results in the future and can also display the R-squared of the model. Note that this script is subject to some limitations (more in the "Notes" section).
Settings
Length : Number of data points to use as input.
Offset : Determine the number of past fitted values to be displayed, if 0 only the extrapolated values are displayed, if 55 only the past fitted values are displayed.
Src : Input data of the indicator
Show R2 : Determine if the value of the R-squared must be displayed, by default true.
Usage
When the underlying trend in the price is not linear, we might use more advanced models to estimate it, this is where using a higher-degree regression model might be required, as such a quadratic model (second-degree) is appropriate when the underlying trend is parabolic.
Here we can see that the quadratic regression (in blue) offer a better fit than a linear one.
Another advantage of the quadratic regression is that a linear one will always have the same direction, that's not the case with the quadratic regression and as such, it is possible to forecast reversals.
Above a linear regression (in red) and two quadratic regression (in blue) with both length = 54. Note that for the sake of clarity, the above image uses a quadratic regression to show all the past fitted values and another one to show all the forecasted values.
The R-Squared is also extremely useful when it comes to measuring the accuracy of the model, with values closer to 1 indicating that the model is appropriate, and thus suggesting that the underlying trend in the price is parabolic. The R-squared can also measure the strength of the trend.
Notes
The script uses the function line.new , as such only a maximum of 54 observations are displayed, getting more observations can be done by using an additional quadratic regression like we did in the previous section. Another thing is that line.new use xloc.bar_time , as such it is possible to observe some errors with the displayed results of the indicator, such as:
This will happen when applying the indicator to symbols with session breaks, I apologize for this inconvenience and I'll try to find solutions. Note however that the indicator will work perfectly on cryptos.
Summary
That's an indicator I really wanted to make, even if it is important to note that such models are rarely useful in stock markets, however it is more than possible to create a quadratic regression (with severe limitations) with pinescript.
Today I turn 21, while I should be celebrating I still wanted to share something with the community, it's also some kind of present to myself that tells me that I am a bit better at using pinescript than last year, and I am glad I could progress (instead of regress, regression , got it?). Thx a lot for reading!
Computing The Linear Regression Using The WMA And SMAPlot a linear regression channel through the last length closing prices, with the possibility to use another source as input. The line is fit by using linear combinations between the WMA and SMA thus providing both an interesting and efficient method. The results are the same as the one provided by the built-in linear regression, only the computation differ.
Settings
length : Number of inputs to be used.
src : Source input of the indicator.
mult : Multiplication factor for the RMSE, determine the distance between the upper and lower level.
Usage
In technical analysis a linear regression can provide an estimate of the underlying trend in the price, this result can be extrapolated to have an estimate of the future evolution of the trend, while the upper and lower level can be used as support and resistance levels.
The slope of the fitted line indicates both the direction and strength of the trend, with a positive slope indicating an up-trending market while a negative slope indicates a down-trending market, a steeper line indicates a stronger trend.
We can see that the trend of the S&P500 in this chart is approximately linear, the upper and lower levels were previously tested and might return accurate support and resistance points in the future.
By using a linear regression we are making the following assumptions:
The trend is linear or approximately linear.
The cycle component has an approximately constant amplitude (this allows the upper and lower level to be more effective)
The underlying trend will have the same evolution in the future
In the case where the growth of a trend is non-linear, we can use a logarithmic scale to have a linear representation of the trend.
Details
In a simple linear regression, we want to the slope and intercept parameters that minimize the sum of squared residuals between the data points and the fitted line
intercept + x*slope
Both the intercept and slope have a simple solution, you can find both in the calculations of the lsma, in fact, the last point of the lsma with period length is equal to the last point of a linear regression fitted through the same length data points. We have seen many times that the lsma is an FIR filter with a series of coefficients representing a linearly decaying function with the last coefficients having a negative value, as such we can calculate the lsma more easily by using a linear combination between a WMA and SMA: 3WMA - 2SMA , this linear combination gives us the last point of our linear regression, denoted point B .
Now we need the first point of our linear regression, by using the calculations of the lsma we get this point by using:
intercept + (x-length+1)*slope
If we get the impulse response of such lsma we get
In blue the impulse response of a standard lsma, in red the impulse response of the lsma using the previous calculation, we can see that both are the same with the exception that the red one appears as being time inverted, the first coefficients are negative values and as such we also have a linear operation involving the WMA and SMA but with inverted terms and different coefficients, therefore the first point of our linear regression, denoted point A , is given by 4SMA - 3WMA , we then only need to join these two points thanks to "line.new".
The levels are simply equal to the fitted line plus/minus the root mean squared error between the fitted line and the data points, right now we only have two points, we need to find all the points of the fitted line, as such we first need to find the slope, which can be calculated by diving the vertical distance between B and A (the rise) with the horizontal distance between B and A (the run), that is
(A - B)/(length-1)
Once done we can find each point of our line by using
B + slope*i
where i is the position of the point starting from B, i=0 give B since B + slope*0 = B , then we continue for every i , we then only need to sum the squared distance between each closing prices at position i and the point found at that same position, we divide by length-1 and take the square root of the result in order to have the RMSE.
In Summary
The following post as shown that it was possible to compute a linear regression by using a linear combination between the WMA and SMA, since both had extremely efficient computations (see link at the end of the post) we could have a calculation for the linear regression where the number of operations is independent of length .
This post took me eons to make because it's related to the lsma, and I am rarely short on words when it comes to anything related to the lsma. Thx to LucF for the feedback and everything.

NSDT ES Midline Zones**DESIGNED FOR ES/MES** This script provides an easy visualization of potential reversion zones to take trades back to the intraday midline. A common use would be to enter a position once price reached the outer yellow zones and retreats to either the red zone (for a short toward the midline) or a green zone (for a long back to the midline).

NSDT NQ Midline Zones**DESIGNED FOR NQ/MNQ** This script provides an easy visualization of potential reversion zones to take trades back to the intraday midline. A common use would be to enter a position once price reached the outer yellow zones and retreats to either the red zone (for a short toward the midline) or a green zone (for a long back to the midline).
Linear Regression ++Due to public demand
Linear Regression Formula
Scraped Calculation With Alerts
Here is the Linear Regression Script For traders Who love rich features
Features
++ Multi time frame -> Source Regression from a different Chart
++ Customized Colors -> This includes the pine lines
++ Smoothing -> Allow Filtered Regression; Note: Using 1 Defaults to the original line. The default is 1
++ Alerts On Channel/Range Crossing
Usage
++ Use this for BreakOuts and Reversals
++ This Script is not to be used Independently
Risks
Please note, this script is the likes of Bollinger bands and poses a risk of falling in a trend range.
Signals may Keep running on the same direction while the market is reversing.
Requests
If you have any feature requests, comment below or dm me. I will answer when i can.
Feel free to utilize this on your chart and share your ideas
For developers who want to use this on their chart, Please use this script
The original formula for calculation is posted there
❤❤❤ I hope you love this. From my heart! ❤❤❤
Lnear Regression ++Here is another amazing script for you guys
Target Audience
++ Programmers
++ Linear Regression Enthusiasts
Please Use this Indicator If you understand the risk posed by linear regression; ill explain some below
Features
++ Raw Formulae for the linear regression
--I understand that tradingview explanation on how the linreg function works is not clear to many of you and therefore i included this for developers
--Yes its much simpler than you thought, Do Enjoy
++ Alerts
--You can get alerts when the lower band is crossed/touched based on your settings
--These alerts are not repainting at all.
Linear Regression Limits
As you traders know, the market changes from time and new levels will get drawn
The alerts are based on these new levels and once we have new ones, we keep updating
Risk
This script is similar to Bollinger Bands style of alerts, If the market moves continuously to one direction after the break of a band, The levels change and you may receive a new signal confirmation
Cheers!! Enjoy!! Feel free to ask me for any improvements
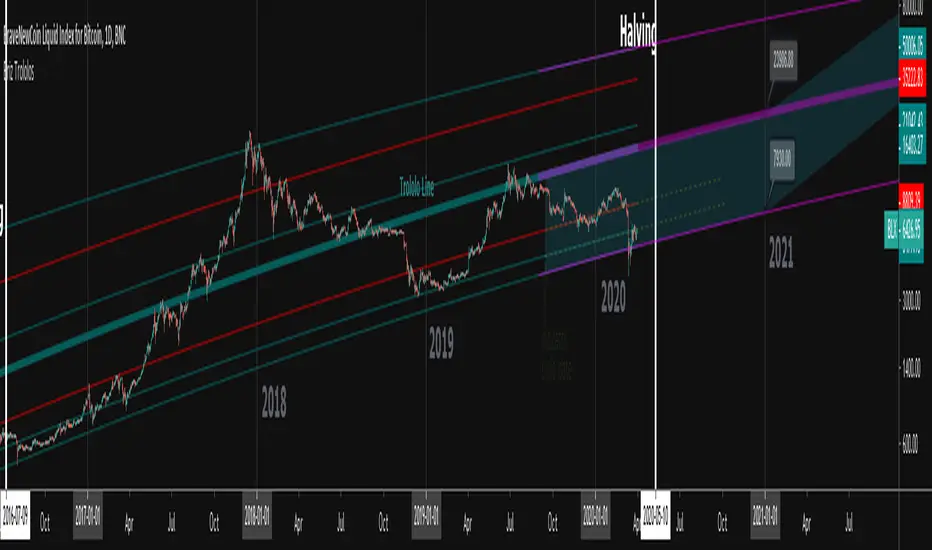
Bitcoin Trololo Lines - Logarithmic Regression for 1D BLXTrololo Lines - Logarithmic Regression lines for Bitcoin with top and bottom ranges. Works only on BLX (BNC) 1 day time frame. Red lines indicate bottom buy range and top sell range. Thickest middle line is the origional "Trololo" or logarithmic regression line.
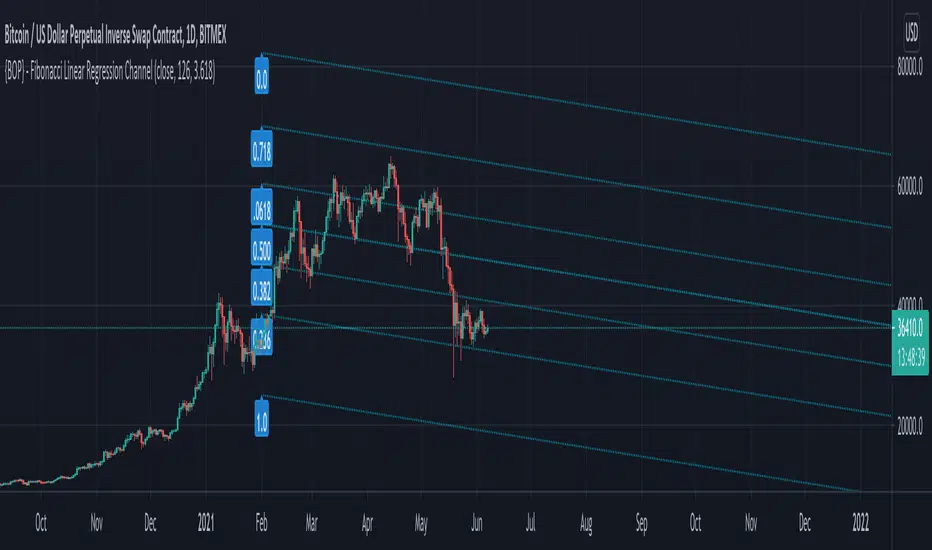
{BOP} - Fibonacci Linear Regression ChannelHere is a test model of a fibonacci linear regression channel. Have fun.