QuantMotions - Pivot Timeline ProjectionQuantMotions – Pivot Timeline Projections is an advanced time-based forecasting tool that uses a unique Twin Pivot model to project future price-time structures.
It combines classical Gann principles with modern quantitative logic to generate highly precise time projections, dynamic angles, and future support/resistance timelines across multiple timeframes.
Whenever two matching pivots (High ↔ Low) of the same length are detected, the indicator calculates a true calendar-time angle and extends it forward, forming dynamic Gann-style fans that adapt to the market in real time.
Perfect for traders who want to integrate price + time forecasting into their strategy.
Key Features:
✔ Twin Pivot Detection
Automatically identifies valid pivot pairs of equal cycle length and opposite direction.
Once confirmed, the pivot becomes a time anchor for future projections.
✔ True Time-Based Angle Projections
Unlike standard Gann tools that rely on bar-counting, this indicator uses real calendar time (milliseconds) to calculate:
This produces significantly more accurate forecasting lines.
✔ Multi-Timeframe Pivot Cycles
Activate time cycles such as:
30M, 1H, 4H, 12H
1D, 7D, 30D
60D, 90D, 120D, 180D, 270D, 360D
Each cycle uses a dedicated color and projection style for clarity.
✔ Dynamic Support/Resistance Timefans
- Every confirmed pivot generates two future projections:
- The main time-angle projection (Gann-style forward fan)
- A secondary projection based on a fixed ratio (1/8), acting as dynamic future support
Both extend until the structure breaks based on ATR tolerance.
✔ ATR-Based Validation
Projection lines remain valid until price breaks them with a configurable ATR multiplier.
This removes noise and keeps only meaningful structures.
✔ Volume Delta Tracking (Optional)
Tracks up-volume and down-volume along the time cycle to validate directional bias.
Info labels show:
- cycle length
- angle
- delta volume
- delta percentage
Seconds-based volume tracking supported for Premium users.
✔ Smart Info Labels
Displays detailed pivot information only for the highest-timeframe pivot at each bar
→ ensures high usability without chart clutter.
🔷 Why This Indicator Is Special
This tool merges Gann angles, time cycles, and quantitative price action into a single engine.
It does not rely on static angles or simple bar offsets.
Instead, it uses:
- real time
- real slope
- real cycle symmetry
- real price movement
The result is a uniquely accurate forecasting model that is extremely difficult to replicate manually.
🔷 Perfect For
- Intraday traders
- Swing traders
- Index, Crypto, Metals, and FX traders
- Gann and cycle-based analysts
- Structure and trend change detection
- Time/price projection strategies
🔷 Inputs & Customization
- ATR break tolerance
- Multiple cycle activation toggles
- Custom color sets for each timeframe
- Second-based or standard timeframe volume tracking
- Enable/Disable info labels
🔷 Note
Some features (like seconds-based volume tracking) depend on TradingView Premium and additional broker data sources.
Loading times may vary when many long-term cycles are enabled simultaneously.
🔷 Access
This is an Invite-Only Script by QuantMotions.
Access is granted after purchase.
For more information, please visit the official product page or contact us directly.
Projection

Vol-Pace Projected-ATR-ADX-Alert-MAThe VolSC indicator analyzes stock volume trends with a focus on the Pace metric, which projects today's volume as a percentage of the 30-day average, highlighting unusual activity (e.g., over 200% turns bright green with alerts). The phantom projection bar, a wide green histogram to the right of the last bar, visually represents this projected volume on daily charts only, aiding quick identification of potential volume surges without cluttering intraday or weekly views. Additional features include ADX strength, ATR averages, and customizable table display for comprehensive insights.
Key Features:
* Primary Indicator: Volume with ADX (Average Directional Index) text.
* Pacing and Alerts: Calculates the volume pace for the day. Features an unusual volume alert with an adjustable threshold (e.g., 200%).
* Volume Projection: Projects a visual "Phantom Volume" for the day, offset to the right of the actual volume bar.
* ATR Indicator: Displays the 2x ATR (Average True Range) value as text.
* Volume Average: Displays the ADV (Average Daily Volume) Moving Average as text.
* Customization: Most settings are adjustable.

[davidev] EMA/MA with projection# EMA/MA with projection
## What it is
A lightweight overlay that plots up to three EMAs and one MA (default: 5/21/55 EMAs and 200 MA) and draws a forward projection from the current bar. The projection extrapolates the latest per-bar change (slope) to visualize where each average *could* be in the next N bars—useful for planning entries, dynamic support/resistance, and anticipating crossovers.
Note: The projection is a simple linear extrapolation of the most recent change. It is not a prediction or signal.
## How it works
Computes EMA1, EMA2, EMA3 and MA (SMA) on your chosen sources.
On the last bar only, it draws a short line segment ahead by `Bars Ahead`, using the most recent change (`ta.change()`) × number of bars to project the line.
Lines are **reused** and updated each tick (no clutter), and deleted on historical bars to avoid artifacts.
## Good for
Visualizing **dynamic levels** slightly ahead of price.
Quickly gauging **momentum** and **slope** of your moving averages.
Sketching possible **crossover timing** (e.g., 5 vs 21 EMA) without changing timeframe.
Cleaner charting: projection only renders on the last bar, so historical candles stay uncluttered.
## Tips
Combine with your market structure/volume tools; the projection helps **plan**, not predict.
Shorter EMAs react faster and will show more pronounced projected moves; longer MAs remain steadier.
Increase `Bars Ahead` on higher timeframes; keep it small on scalping charts to avoid overreach.

ADVANCED COSINE PROJECTION SYSTEM — LITE Mark3ACPS-Lite is a projection-based tool designed to visualize potential price paths using cosine-based similarity and stability analysis.
so, i have been working over multiple iterations to have a stable projection based on cosine principles and I've settled with a few stable algorithmic frameworks which works as: what i like to call : next generation leading indicators.
This indicator works well with any charting type like line/bar/candles etc. across ALL timeframes. (including seconds).
Basically this indicator projects a path towards the right.
Based on the trend the color of the projection updates on live refresh (depends on your timeframe of choice)
GREEN path projection for possible up trend
RED for bearish and yellow for sideways trend.
Technical : This indicator Aims to solve "DIRECTION" .
The idea was to to calculate angle between any given vectors : so if we translate it into the trading world : we are trying to determine direction (simplified explanation).
Pros : Scale Independent
meaning factors like flash crash , High impact movements (like NFP's) dont impact the projection logic in terms of Magnitude.
My model focuses on pattern similarity
example : in the previous instance of similar situation how did price react ?
therefore making a similar "COSINE" projection. (based on past "vector"/event)
on the left side there will always be an highlighted box section to visually represent where the future projections are based off of.
Cons: multiple vectors can have same direction from the cosine logic : essentially rendering the projected distance inconclusive.
but i solved that problem fully but on this lite version i made use of live refresh feature to keep the projections on a float : making our right side projections that much more fluid.
finally as a psychological factor not to get caught up on any Bias i made sure the indicator switches color according to immediate trend change logi.
Best Use case : have this indicator across multiple timeframes inside Tradingvieews tabs to Help make better Judgement.
I'm open for feedback / suggestions.
regards,
drsamc.
Gann Ultimate Time-Price Squares Method V 1.0This Script is an outcome of my Passion towards Gann Theory and his Methodology towards Trading.
The Script is still Evolving.So wait for more updates....
# Complete Trading Guide: Gann Time-Price Squares Indicator
## 🎯 Core Trading Philosophy
**Gann's Key Principle**: "When time and price come together, a change in trend occurs."
Your indicator identifies these critical moments where **Time = Price**, creating high-probability trading opportunities.
---
## 📊 Setup & Configuration
### Recommended Settings by Timeframe
| Timeframe | Pivot Lookback | Min Price Move | Tolerance | Use Case |
|-----------|---------------|----------------|-----------|----------|
| **1-5 min** | 5-8 bars | 0.5-1.0 | 1.0-2.0 | Scalping |
| **15-30 min** | 8-12 bars | 1.0-3.0 | 1.5-2.5 | Day Trading |
| **1-4 hour** | 10-15 bars | 2.0-5.0 | 2.0-3.0 | Swing Trading |
| **Daily** | 15-25 bars | 5.0-20.0 | 3.0-5.0 | Position Trading |
### Initial Setup Steps
1. **Add indicator** to your chart
2. **Set lookback period** based on your timeframe
3. **Adjust tolerance** - start with 2.0 and fine-tune
4. **Enable all visualizations** initially
5. **Position info table** where it doesn't block price action
---
## 🚀 Trading Strategies
### Strategy 1: Square Completion Reversal Trading
#### **Long Entry Setup**
```
CONDITIONS:
✅ Bullish square completes (green box appears)
✅ Info table shows "✅ COMPLETED" status
✅ Price bounces off square's bottom edge
✅ Volume increases on bounce
✅ RSI < 30 (oversold confirmation)
ENTRY: Market buy when price breaks above square's top edge
STOP: Below square's bottom edge (-2 ATR)
TARGET: Next resistance level or 1:2 Risk/Reward
```
#### **Short Entry Setup**
```
CONDITIONS:
✅ Bearish square completes (red box appears)
✅ Info table shows "✅ COMPLETED" status
✅ Price rejects square's top edge
✅ Volume increases on rejection
✅ RSI > 70 (overbought confirmation)
ENTRY: Market sell when price breaks below square's bottom edge
STOP: Above square's top edge (+2 ATR)
TARGET: Next support level or 1:2 Risk/Reward
```
### Strategy 2: Gann Angle Trend Following
#### **1x1 Angle (45°) - The Master Angle**
- **Most Important**: This is Gann's primary trend line
- **Bullish**: Price above 1x1 = uptrend intact
- **Bearish**: Price below 1x1 = downtrend intact
- **Break**: 1x1 angle break = major trend change
#### **Multi-Angle Confluence Trading**
```
STRONG BULLISH SIGNAL:
✅ Price above 1x1 angle (45°)
✅ Bouncing off 2x1 angle (support)
✅ Volume increasing
✅ Multiple angles pointing up
ENTRY: Buy on 2x1 angle bounce
STOP: Below 1x2 angle
TARGET: Next angle resistance
```
### Strategy 3: Projection Trading (Forming Squares)
#### **Anticipation Strategy**
```
SETUP IDENTIFICATION:
👀 Info table shows "⚡ FORMING" status
👀 Progress bar > 70%
👀 P/T Ratio approaching 1.00
👀 Price approaching projected completion zone
ENTRY PREPARATION:
- Set alerts for projected completion levels
- Prepare for reversal at projection zone
- Watch for volume confirmation
- Monitor momentum indicators
```
## 📈 Step-by-Step Trading Process
### Phase 1: Market Analysis (Before Trading)
1. **Check Market Trend**: Look at info table trend indicator
2. **Identify Active Pivots**: Note last significant high/low
3. **Assess Volatility**: High volatility = larger stops needed
4. **Review Completed Squares**: These become support/resistance zones
### Phase 2: Trade Setup Identification
1. **Monitor Forming Squares**: Watch progress bars in info table
2. **Check Gann Angles**: Are they supporting or opposing your bias?
3. **Confirm with Volume**: Look for volume spikes at key levels
4. **Set Alerts**: Use TradingView alerts for completion zones
### Phase 3: Trade Execution
1. **Wait for Confirmation**: Don't trade on projections alone
2. **Enter on Breakout**: Price breaking square boundaries
3. **Set Stops Immediately**: Use square edges as stop levels
4. **Scale Out**: Take partial profits at angle intersections
### Phase 4: Trade Management
1. **Trail Stops**: Use Gann angles as trailing stop levels
2. **Monitor Progress**: Watch for new square formations
3. **Exit Signals**: New squares in opposite direction
4. **Review Performance**: Analyze win/loss against square accuracy
---
## 🎯 High-Probability Setups
### Setup A: Double Confirmation
```
BULLISH EXAMPLE:
1. Bullish square completes at major support
2. Price bounces off 1x1 Gann angle
3. Volume surge confirms reversal
4. RSI divergence present
PROBABILITY: 75-80%
RISK/REWARD: 1:3 typical
```
### Setup B: Angle Breakout
```
BEARISH EXAMPLE:
1. Price breaks below 1x1 angle
2. Bearish square forming below break
3. Multiple angles now resistance
4. Volume confirms breakdown
PROBABILITY: 70-75%
RISK/REWARD: 1:2.5 typical
```
### Setup C: Time Cycle Convergence
```
REVERSAL EXAMPLE:
1. Square completion at time cycle high/low
2. Multiple Gann angles converging
3. Momentum divergence
4. Volume climax
PROBABILITY: 80-85%
RISK/REWARD: 1:4 possible
```
---
## ⚠️ Risk Management Rules
### Position Sizing
- **Conservative**: 1-2% risk per trade
- **Aggressive**: 2-3% risk per trade
- **Never exceed**: 5% total portfolio risk
### Stop Loss Guidelines
- **Completed Squares**: Opposite edge + 1 ATR
- **Gann Angles**: Below/above angle + 0.5 ATR
- **Projections**: 50% of square height
### Take Profit Targets
- **Target 1**: Next Gann angle (1:1 R/R)
- **Target 2**: Next completed square (1:2 R/R)
- **Target 3**: Major S/R level (1:3 R/R)
---
## 📊 Reading the Info Table for Trading
### Market Trend Section
```
📈 BULLISH → Look for long setups
📉 BEARISH → Look for short setups
➡️ NEUTRAL → Wait for direction
```
### Volatility Status
```
🔥 HIGH → Larger stops needed
⚡ ELEVATED → Normal stops
😴 LOW → Tighter stops possible
📊 NORMAL → Standard approach
```
### Square Progress Monitoring
```
✅ COMPLETED → Ready to trade
⚡ FORMING → Prepare for setup
🔥 ACTIVE → Monitor closely
⏳ WAITING → No immediate action
```
### P/T Ratio Interpretation
```
🎯 Perfect (0.8-1.2) → High probability setup
⚡ Good (0.6-1.4) → Moderate probability
⚠️ Watch (outside range) → Lower probability
```
---
## 🔄 Common Trading Scenarios
### Scenario 1: Trend Continuation
**Setup**: Price pulls back to completed square in uptrend
**Action**: Buy at square support with 1x1 angle confirmation
**Management**: Trail stop below each new square formation
### Scenario 2: Reversal Trading
**Setup**: Multiple squares complete at major S/R
**Action**: Fade the move when price rejects square edges
**Management**: Quick profits, tight stops
### Scenario 3: Breakout Trading
**Setup**: Price consolidates in square, then breaks out
**Action**: Trade breakout direction with volume confirmation
**Management**: Use opposite square edge as stop
---
## 📱 Alert Setup Recommendations
### Critical Alerts
1. **Square Completion**: "Gann Square Completed - Check for reversal"
2. **1x1 Angle Break**: "Master angle broken - Trend change possible"
3. **Projection Reached**: "Forming square at 90% - Prepare for reversal"
4. **Multi-Angle Touch**: "Price at angle confluence - High probability setup"
---
Remember: **Gann analysis is both art and science**. The indicator provides the mathematical framework, but successful trading requires patience, discipline, and continuous learning. Start with small positions while you master the methodology!

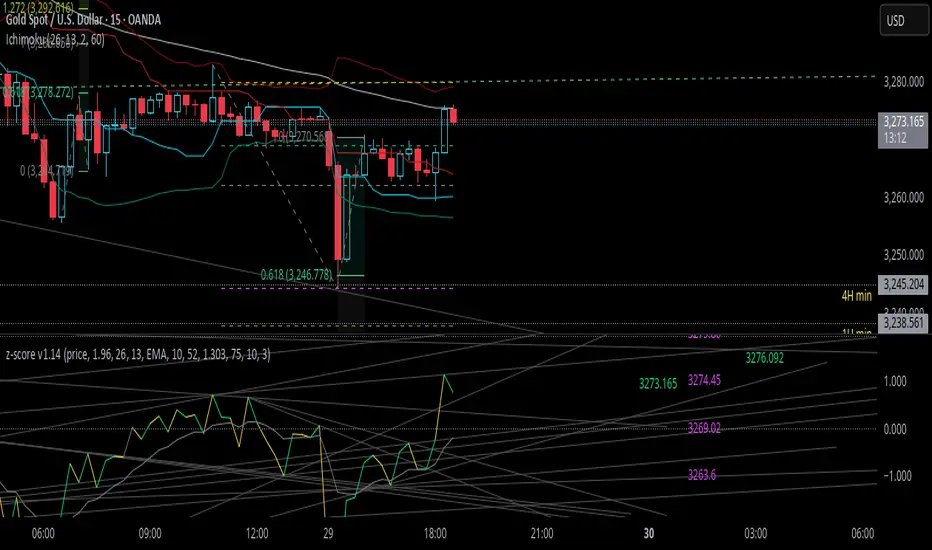
z-score-calkusi-v1.14z-scores incorporate the moment of N look-back bars to allow future price projection.
z-score = (X - mean)/std.deviation ; X = close
z-scores update with each new close print and with each new bar. Each new bar augments the mean and std.deviation for the N bars considered. The old Nth bar falls away from consideration with each new historical bar.
The indicator allows two other options for X: RSI or Moving Average.
NOTE: While trading use the "price" option only.
The other two options are provided for visualisation of RSI and Moving Average as z-score curves.
Use z-scores to identify tops and bottoms in the future as well as intermediate intersections through which a z-score will pass through with each new close and each new bar.
Draw lines from peaks and troughs in the past through intermediate peaks and troughs to identify projected intersections in the future. The most likely intersections are those that are formed from a line that comes from a peak in the past and another line that comes from a trough in the past. Try getting at least two lines from historical peaks and two lines from historical troughs to pass through a future intersection.
Compute the target intersection price in the future by clicking on the z-score indicator header to see a drag-able horizontal line to drag over the intersection. The target price is the last value displayed in the indicator's status bar after the closing price.
When the indicator header is clicked, a white horizontal drag-able line will appear to allow dragging the line over an intersection that has been drawn on the indicator for a future z-score projection and the associated future closing price.
With each new bar that appears, it is necessary to repeat the procedure of clicking the z-score indicator header to be able to drag the drag-able horizontal line to see the new target price for the selected intersection. The projected price will be different from the current close price providing a price arbitrage in time.
New intermediate peaks and troughs that appear require new lines be drawn from the past through the new intermediate peak to find a new intersection in the future and a new projected price. Since z-score curves are sort of cyclical in nature, it is possible to see where one has to locate a future intersection by drawing lines from past peaks and troughs.
Do not get fixated on any one projected price as the market decides which projected price will be realised. All prospective targets should be manually updated with each new bar.
When the z-score plot moves outside a channel comprised of lines that are drawn from the past, be ready to adjust to new market conditions.
z-score plots that move above the zero line indicate price action that is either rising or ranging. Similarly, z-score plots that move below the zero line indicate price action that is either falling or ranging. Be ready to adjust to new market conditions when z-scores move back and forth across the zero line.
A bar with highest absolute z-score for a cycle screams "reversal approaching" and is followed by a bar with a lower absolute z-score where close price tops and bottoms are realised. This can occur either on the next bar or a few bars later.
The indicator also displays the required N for a Normal(0,1) distribution that can be set for finer granularity for the z-score curve.This works with the Confidence Interval (CI) z-score setting. The default z-score is 1.96 for 95% CI.
Common Confidence Interval z-scores to find N for Normal(0,1) with a Margin of Error (MOE) of 1:
70% 1.036
75% 1.150
80% 1.282
85% 1.440
90% 1.645
95% 1.960
98% 2.326
99% 2.576
99.5% 2.807
99.9% 3.291
99.99% 3.891
99.999% 4.417
9-Jun-2025
Added a feature to display price projection labels at z-score levels 3, 2, 1, 0, -1, -2, 3.
This provides a range for prices available at the current time to help decide whether it is worth entering a trade. If the range of prices from say z=|2| to z=|1| is too narrow, then a trade at the current time may not be worth the risk.
Added plot for z-score moving average.
28-Jun-2025
Added Settings option for # of Std.Deviation level Price Labels to display. The default is 3. Min is 2. Max is 6.
This feature allows likelihood assessment for Fibonacci price projections from higher time frames at lower time frames. A Fibonacci price projection that falls outside |3.x| Std.Deviations is not likely.
Added Settings option for Chart Bar Count and Target Label Offset to allow placement of price labels for the standard z-score levels to the right of the window so that these are still visible in the window.
Target Label Offset allows adjustment of placement of Target Price Label in cases when the Target Price Label is either obscured by the price labels for the standard z-score levels or is too far right to be visible in the window.
Practice makes perfect.
Use this indicator at your own risk
Crypto Cycle Projection📈 Crypto Cycle Projection – Indicator Description
This indicator is designed to visually track and forecast repeating price cycles in the crypto market. It highlights a defined time-based cycle starting from a chosen date or the latest bar on the chart. By identifying cycle Start, Midpoint, and End zones, traders can gain insights into timing-based market structure and possible pivot periods.
⚙️ User Settings Explained
Start Point
Start from Last Candle (useLastCandle) – When enabled, the cycle begins from the most recent candle on the chart.
Manual Date (Year / Month / Day) – If Start from Last Candle is disabled, you can manually set a specific start date for the cycle.
Display Options
- Show Projection (showZone) – Toggles the display of the main cycle projection.
- Show Outer Bars (showOuter) – Adds faded edge bars around the key cycle zones for better visual emphasis.
- Show Previous Cycle (showPreviousCycle) – Adds the prior cycle to the chart, going one full cycle period back from the main start point.
Show Next Cycle (showNextCycle) – Projects one additional cycle forward beyond the current.
Cycle Parameters
Cycle Period (cyclePeriod) – Defines the number of bars in a full cycle (e.g., 60 = 60 bars). This sets the spacing between Start → Midpoint → End.
Each cycle section is color-coded:
Start = White
Midpoint = Yellow
End = Green
These reference lines and zones help you align trades with cycle timing for potential reversals, continuations, or volatility expansions.
Co-author Credit:
Matthew Hyland @ParabolicMatt

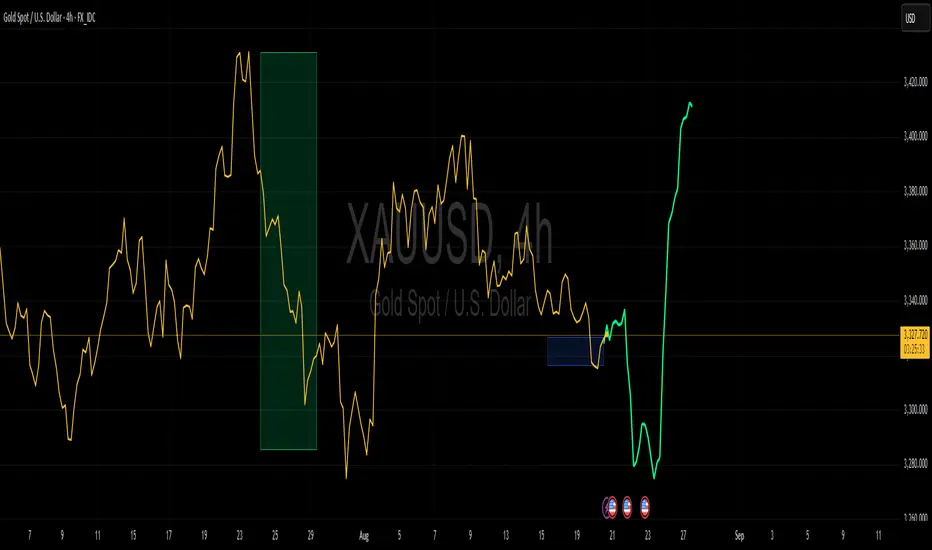
MestreDoFOMO Future Projection BoxMestreDoFOMO Future Projection Box - Description & How to Use
Description
The "MestreDoFOMO Future Projection Box" is a TradingView indicator tailored for crypto traders (e.g., BTC/USDT on 1H, 4H, or 1D timeframes). It visualizes current price ranges, projects future levels, and confirms trends using semi-transparent boxes. With labeled price levels and built-in alerts, it’s a simple yet powerful tool for identifying support, resistance, and potential price targets.
How It Works
Blue Box (Current Channel): Shows the recent price range over the last 10 bars (adjustable). The top is the highest high plus an ATR buffer, and the bottom is the lowest low minus the buffer. Labels display exact levels (e.g., "Top: 114000", "Bottom: 102600").
Green Box (Future Projection): Projects the price range 10 bars ahead (adjustable) based on the trend slope of the moving average. Labels show "Proj Top" and "Proj Bottom" for future targets.
Orange Box (Moving Average): Traces a 50-period EMA (adjustable) to confirm the trend. An upward slope signals a bullish trend; a downward slope signals a bearish trend. A label shows the current MA value (e.g., "MA: 105000").
Alerts: Triggers when the price nears the projected top or bottom, helping you catch breakouts or retracements.
How to Use
Add the Indicator: Apply "MestreDoFOMO Future Projection Box" to your chart in TradingView.
Interpret the Trend: Check the orange box’s slope—upward for bullish, downward for bearish.
Identify Key Levels: Use the blue box’s top as resistance and bottom as support. On a 4H chart, if the top is 114,000, expect resistance; if the bottom is 102,600, expect support.
Plan Targets: Use the green box for future targets—top for profit-taking (e.g., 114,000), bottom for stop-loss or buying (e.g., 102,600).
Set Alerts: Enable alerts for "Near Upper Projection" or "Near Lower Projection" to get notified when the price hits key levels.
Trade Examples:
Bullish: If the price breaks above the blue box top (e.g., 114,000), buy with a target at the green box top. Set a stop-loss below the green box bottom.
Bearish: If the price rejects at the blue box top and drops below the orange MA, short with a target at the blue box bottom.
Customize: Adjust the lookback period, projection bars, ATR multiplier, and MA length in the settings to fit your trading style.
Tips
Use on 1H for short-term trades, 4H for swing trades, or 1D for long-term trends.
Combine with volume or RSI to confirm signals.
Validate levels with market structure (e.g., candlestick patterns).

ZenAlgo - RangerThe core of the indicator is the daily range, anchored around the 1-minute timeframe VWAP (volume-weighted average price), with ±2 standard deviations defining the upper and lower bounds. This range dynamically forms throughout the day and then gets “locked” at 23:59 each day to establish historical reference values.
The indicator calculates this locked VWAP and standard deviation per day, which serves two primary purposes:
Drawing today's real-time evolving range , updated each minute.
Plotting previous daily ranges , based on historical locked VWAPs and standard deviations, providing visual reference boxes on the chart.
This design enables the trader to identify mean-reversion zones and persistent directional biases based on volume-weighted price consensus.
Multiple Standard Deviation Layers
Beyond the ±2.0 deviation bounds, optional lines are available at half-step increments (e.g., ±0.5, ±1.5, ..., ±4.5) and full-step levels beyond ±2.0 (±3.0, ±4.0, ±5.0). These provide a customizable grid to visualize price extremes, tail behavior, or potential breakout zones relative to volume-adjusted price equilibrium.
Users can enable only the levels they need, offering flexibility depending on their strategy (e.g., scalping versus swing trading).
Historical Range Retention
The script stores up to 70 previous daily VWAP + standard deviation values (adjustable). For each, it draws a full range box and standard deviation lines in the past. This historical context helps in understanding how current price interacts with prior days’ balance zones.
These boxes are always drawn from 00:00 to 23:59 UTC , ensuring consistent alignment across instruments and avoiding session-based discrepancies.
Monday Range Reference (Drawn on Tuesdays)
On Tuesdays, the indicator plots the previous Monday's VWAP-based range across the rest of the week. This serves as a persistent contextual anchor for traders watching weekly unfolding behavior. The range is defined identically (VWAP ±2σ) and drawn from Monday 00:00 through the following Monday.
This method assumes Monday often sets the tone or structure for the week, and tracking this level through time may highlight support/resistance confluence or range expansion scenarios.
Each Monday range is extended over 7 days and includes dashed lines at the 25%, 50%, and 75% marks within the range. These midrange markers help traders assess microstructure behaviors (e.g., reversion to median, failure to hold midpoint, etc.).
Daily Volume Delta via 4H Candles
The indicator also integrates daily buy/sell volume deltas , derived from 4-hour candles of the regular session (non-Heikin Ashi). The logic categorizes volume as:
Buy volume when candle closes above the previous close.
Sell volume when it closes below.
Even split when the candle closes flat.
These volumes accumulate each day to derive net delta (buy - sell). This delta is recorded for each day and can optionally be displayed. A similar process tracks the delta for each Monday range on an ongoing basis.
This information quantifies the market’s aggressive buying vs. selling , correlating with price positions inside or outside the VWAP ranges. A strong delta in one direction may justify a price sustaining above/below VWAP, or diverging from the previous range.
Interpretation and Best Usage Practices
VWAP±2σ Range : Considered a high-probability area for consolidation or reversal. Mean-reverting strategies can benefit from signals within this area.
VWAP±3.0 and beyond : Extreme deviations may signal exhaustion or breakout potential, but are less frequent.
Previous Range Overlap : Overlap of today’s price with past VWAP zones may indicate support/resistance zones.
Monday Range on Tuesday : Persistent levels where the week may repeatedly pivot. Best used on instruments that exhibit weekly cyclical behavior (e.g., indices, forex).
Delta Behavior : Sharp positive or negative delta combined with price outside VWAP bands may suggest initiative participation and potential trend continuation.
Added Value Over Free Alternatives
While many free VWAP tools exist, this script differs in several specific and factual ways:
Anchored 1-minute VWAP lock at a consistent daily timestamp (23:59 UTC), enabling historical analysis.
Historical storage of previous VWAP ranges , with adjustable memory depth and visual continuity.
Flexible standard deviation plotting , down to 0.5 increments, tailored to the user's strategy needs.
Dedicated Monday range analysis , not common in freely available scripts.
Volume delta tracking per day and per Monday range , offering a directional volume view unavailable in standard VWAP implementations.
Persistent and visual interpretation framework using extended boxes and dashed lines for easier contextual navigation.
Each of these additions increases the script’s utility for methodical traders relying on volume-weighted statistics, without requiring additional configuration or external calculations.
Limitations and Disclaimers
VWAP based on 1-minute resolution : The indicator uses minute-level data to calculate daily VWAP and standard deviation. This offers high fidelity on liquid instruments but may produce noisy or unreliable levels on illiquid assets or during periods of low volume. For example, microcap stocks or thinly traded altcoins might not yield stable VWAP centers.
Inferred buy/sell volume : Volume delta is estimated using price movement from one candle to the next (close-to-close logic), rather than actual trade-level aggressor data (which is not accessible via TradingView). This approximation may misclassify volume in choppy or low-volatility environments, especially in assets where price changes do not correlate well with order flow (e.g., crypto during low-volume weekends).
Non-continuous markets and price gaps : For assets that do not trade continuously (e.g., stocks, futures), the VWAP calculation starts fresh every day at 00:00 UTC, regardless of the instrument’s official session start. As a result:
Pre-market/post-market trades may be included in VWAP when analyzing equities, even though they are often excluded in professional VWAP tools.
Opening gaps in equities and futures may distort early VWAP values due to lack of volume context, especially if the previous day's session was already closed when new data begins accumulating.
Weekend gaps in crypto, although less frequent due to 24/7 trading, can still influence delta accumulation if abrupt moves happen during low liquidity periods.
Daily session alignment : The VWAP anchoring and box drawing uses 00:00 UTC to 23:59 UTC windows. For instruments with different official session timings (e.g., US equities, CME futures), this may cause mismatches between expected session VWAPs and the ones shown in this script.
Conclusion
The ZenAlgo – Ranger script offers a systematic visualization of volume-adjusted price behavior, combining statistical VWAP ranges with volume delta overlays. By integrating daily and weekly reference zones, this tool supports structured decision-making in various market environments, particularly for traders prioritizing mean reversion, range expansion, or trend confirmation.

CAGR ProjectionThe CAGR Projection Indicator is a tool designed to visualize the potential growth of an asset over time based on a specified annual growth rate. This indicator overlays a projection line on the price chart, allowing traders and investors to compare actual price movements with a hypothetical growth trajectory.
One of the key features of this indicator is the ability for users to input their expected annual growth rate as a percentage. This flexibility allows for various scenarios to be modeled, from conservative estimates to more optimistic projections. Additionally, the indicator allows users to set a specific start date for the projection, enabling analysis from any chosen point in time.
The projection calculation is dynamic, adjusting for different timeframes and updating with each new bar on the chart. The indicator initializes either at the specified start date or when the first valid price is encountered. Using the initial price as a base, the indicator calculates the projected price for each subsequent bar using the compound growth formula. The calculation accounts for the specific timeframe of the chart, ensuring accurate projections regardless of whether the chart displays daily, weekly, or other intervals.
The projected growth is plotted as a blue line on the chart, providing a clear visual comparison between the actual price movement and the hypothetical growth trajectory. This visual representation makes it easy for users to quickly assess how an asset is performing relative to the expected growth rate.
This tool has several practical applications. Investors can use it to set realistic growth targets for their investments. By comparing actual price movements to the projection line, users can quickly assess if an asset is outperforming or underperforming relative to the expected growth rate. Furthermore, multiple instances of the indicator can be used with different growth rates to visualize various potential outcomes, facilitating scenario analysis.
The indicator also offers customization options, such as displaying a label showing the annual growth rate used for the projection, and the ability to adjust the color of the projection line to suit individual preferences or chart setups.
In summary, this CAGR Projection indicator serves as a valuable tool for both long-term investors and traders, offering a simple yet effective way to visualize potential growth scenarios and assess investment performance over time. It combines ease of use with powerful analytical capabilities, making it a useful addition to any trader's or investor's toolkit.

Nami Bands with Future Projection [FXSMARTLAB]The Nami Bands ( Inspired by "Nami", meaning "wave" in Japanese) are two dynamic bands around price data: an upper band and a lower band. These bands are calculated based on an Asymmetric Linear Weighted Moving Average of price and a similarly asymmetric weighted standard deviation. This weighting method emphasizes recent data without overreacting to short-term price changes, thus smoothing the bands in line with prevailing market conditions.
Advantages and Benefits of Using the Indicator
* Volatility Analysis: The bands expand and contract with market volatility, helping traders assess periods of high and low volatility. Narrow bands indicate low volatility and potential consolidation, while wide bands suggest increased volatility and potential price movement.
* Dynamic Support and Resistance Levels: By adapting to recent trends, the bands serve as dynamic support (lower band) and resistance (upper band) levels, which traders can use for entry and exit signals.
* Overbought and Oversold Conditions: When prices reach or cross the bands’ outer limits, it may signal overbought (upper band) or oversold (lower band) conditions, suggesting possible reversals or trend slowdowns.
* Trend Confirmation and Continuation: The slope of the central moving average confirms trend direction. An upward slope generally indicates a bullish trend, while a downward slope suggests a bearish trend.
* Anticipating Breakouts and Reversals: The projected bands help identify where price movements may head, allowing traders to anticipate potential breakouts or reversals based on projected support and resistance.
Indicator Parameters
Source (src): The price data used for calculations, by default set to the average of high, low, and close (hlc3).
Length: The period over which calculations are made, defaulted to 50 periods.
Projection Length: The length for future band projection, defaulted to 20 periods.
StdDev Multiplier (mult): A multiplier for the standard deviation, defaulted to 2.0.
Internal Calculations
1. Asymmetric Linear Weighted Moving Average of Price
The indicator uses an Asymmetric Linear Weighted Moving Average (ALWMA) to calculate a central value for the price.
Asymmetric Weighting: This weighting technique assigns the highest weight to the most recent value, with weights decreasing linearly as the data points become older. This structure provides a nuanced focus on recent price trends, while still reflecting historical price levels.
2. Asymmetric Weighted Standard Deviation
The standard deviation in this indicator is also calculated using asymmetric weighting:
Purpose of Asymmetric Weighted Standard Deviation: Rather than aiming for high sensitivity to recent data, this standard deviation measure smooths out volatility by integrating weighted values across the length period, stabilizing the overall measurement of price variability.
This approach yields a balanced view of volatility, capturing broader market trends without being overly reactive to short-lived changes.
3. Upper and Lower Bands
The upper and lower bands are created by adding and subtracting the asymmetric weighted standard deviation from the asymmetric weighted average of price. This creates a dynamic envelope that adjusts to both recent price trends and the smoothed volatility measure:
These bands represent adaptable support and resistance levels that shift with recent market volatility.
Future Band Projection
The indicator provides a projection of the bands based on their current slope.
1. Calculating the Slope of the Bands
The slope for each band is derived from the difference between the current and previous values of each band.
2. Projecting the Bands into the Future
For each period into the future, up to the defined Projection Length, the bands are projected using the current slope.
This feature offers an anticipated view of where support and resistance levels may move, providing insight for future market behavior based on current trends.

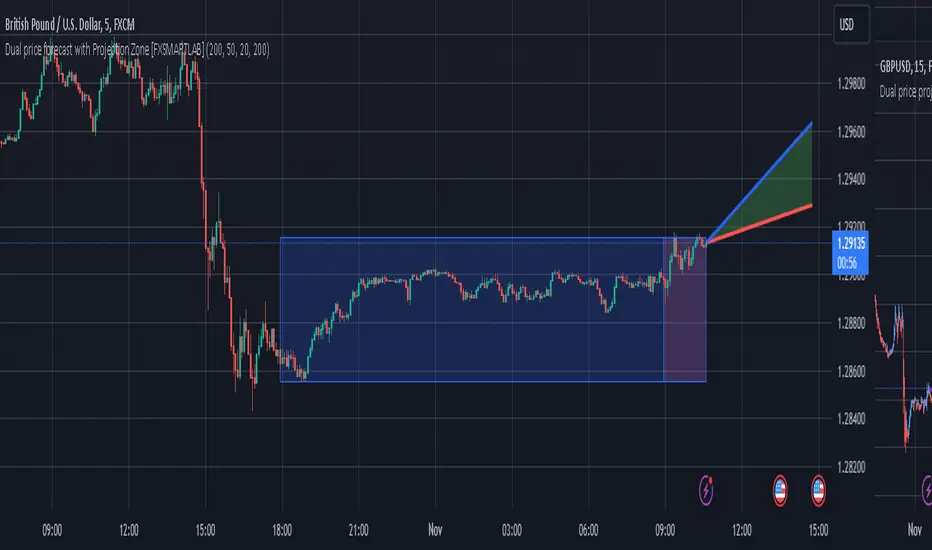
Dual price forecast with Projection Zone [FXSMARTLAB]The Dual Price Forecast with Projection Zone indicator is built to simulate potential future price paths based on historical price movements over two defined lookback periods. By running multiple trials (or simulations) on these historical price movements, the indicator achieves a more robust forecast, incorporating the inherent variability of price behavior.
Key Components and Calculation Details
1. Lookback Periods and Historical Price Movements
Lookback Period 1 and Lookback Period 2 specify the range of past data used to generate each projection. For each period, the indicator calculates the price variations (differences between the closing and opening prices) and stores these in arrays.
These historical price variations capture the volatility and price patterns within each period, serving as templates for future price behavior.
2. Trials: Purpose and Function
The trials are a critical element in the projection calculation. Each trial represents a single simulation of possible future price movements, derived from a random reordering of the historical price variations in each lookback period.
By running multiple trials , the indicator explores various sequences of historical movements, simulating different possible future paths. Each trial adds to the projection’s robustness by capturing a unique potential price path based on past behavior.
Running these multiple trials allows the indicator to account for randomness in price behavior, making the projections more comprehensive by covering a range of scenarios rather than relying on a single deterministic forecast.
3. Reverse Option
The reverse option allows the indicator to invert the direction of price movements within each lookback period. When enabled, historical uptrends are treated as downtrends, and vice versa.
This feature is particularly valuable in scenarios where traders expect a potential reversal in market direction. By enabling the reverse option, the indicator can simulate what might happen if past trends inverted, providing an alternative forecast path that considers possible market reversals.
This allows traders to assess both continuation and reversal scenarios, giving them a more balanced view of potential future price paths and helping them prepare for either market direction.
4. Generating the Average Projection Path
Once the trials are complete, the indicator calculates an average projected price path for each lookback period by averaging the results of all trials. This average represents the most likely price trend based on historical data and provides a smoothed projection that mitigates extreme outliers.
By averaging across all trial paths, the indicator generates a more reliable and balanced forecast line, smoothing out the fluctuations that might appear if only one trial or a small number of trials were used.
5. Projection Zone Visualization
The indicator plots the two average projection paths (one for each lookback period) as Projection 1 and Projection 2, each in a user-defined color.
The Projection Zone is the area between these two lines, filled with a semi-transparent color. This zone visually represents the potential range of future price movement, highlighting where prices are likely to oscillate if historical trends persist.
The Projection Zone effectively functions as a potential support and resistance boundary, providing traders with a visual reference for possible price fluctuations within a specific range.
6. Display of Lookback Zones
To give context to the projections, the indicator can also display colored lookback zones on the chart. These zones correspond to Lookback Period 1 and Lookback Period 2 and are color-coded to match their respective projection lines.
These zones allow traders to see the sections of historical data used in the calculation, helping them understand which past price behaviors influenced the current projections.
Benefits of the Indicator
The "Dual Price Forecast with Projection Zone" indicator provides a multi-scenario forecast based on past price dynamics. Its use of trials ensures that projections are not based on a single deterministic path but on a range of possible scenarios that better reflect the inherent randomness in financial markets.
By generating a probabilistic forecast within a defined zone, the indicator helps traders to:
Anticipate potential price ranges and areas of support/resistance based on historical trends.
Understand the influence of different timeframes (short-term and long-term lookbacks) on future price behavior.
Make informed decisions by visualizing the likely variability of future prices within a controlled projection zone.
Prepare for both continuation and reversal scenarios, thanks to the reverse option. This feature is especially useful in markets where trends may change direction, as it allows traders to explore what might happen
Anchored Monte Carlo Shuffled Projection [LuxAlgo]The Anchored Monte Carlo Shuffled Projection tool randomly simulates future price points based on historical bar movements made before a user-anchored point in time.
By anchoring our data and projections to a single point in time, users can better understand and reflect on how the price played out while taking into consideration our random simulations.
🔶 USAGE
After selecting the indicator to apply to the chart, you will be prompted to "Set the Anchor Point". Do so by clicking on the desired location on your chart, only time is used as the anchor point.
Note: To select a new anchor point when applied to the chart, click on the 'More' dropdown next to the indicator status bar (○○○), then select "Reset points...".
Alternate Method: You are also able to click and drag the vertical line that displays on the anchor point bar when the indicator is highlighted.
By randomly simulating bar movements, a range is developed of potential price action which could be utilized to locate future price development as well as potential support/resistance levels.
Performing numerous simulations and taking the average at each step will converge toward the result highlighted by the "Average Line", and can point out where the price might develop, assuming the trend and amount of volatility persist.
Current closing price + Sum of changes in the calculation window
This constraint will cause the simulations always to display an endpoint consistent with the current lookback's slope.
While this may be helpful to some traders, this indicator includes an option to produce a less biased range, as seen below:
🔶 DETAILS
The Anchored Monte Carlo Shuffled Projection tool creates simulations based on prices within a user-set lookback window originating at the specified anchor point. Simulations are done as follows:
Collect each bar's price changes in the user-set window.
Randomize the order of each change in the window.
Project the cumulative sum of the shuffled changes from the current closing price.
Collect data on each point along the way.
This is the process for the Default calculation; for the 'Randomize Direction' calculation, when added onto the front for every other change, the value is inverted, creating the randomized endpoints for each simulation.
The script contains each simulation's data for that bar, with a maximum of 1000 simulations.
To get a glimpse behind the scenes, each simulation (up to 99) can be viewed using the 'Visualize Simulations' Options, as seen below.
Because the script holds the full simulation data, the script can also calculate this data, such as standard deviations.
In this script the Standard deviation lines are the average of all standard deviations across the vertical data groups, this provides a singular value that can be displayed a distance away from the simulation center line.
🔶 SETTINGS
Lookback: Sets the number of Bars to include in calculations.
Simulation Count: Sets the number of randomized simulations to calculate. (Max 1000)
Randomize Direction: See Details Above. Creates a more 'Normalized' Distribution
Visualize Simulations: See Details Above. Turns on Visualizations, and colors are randomly generated. Visualized max does not cap the calculated max. If 1000 simulations are used, the data will be from 1000 simulations, however, only the last 99 simulations will be visualized.
🔹 Standard Deviations
Standard Deviation Multiplier: Sets the multiplier to use for the Standard Deviation distance away from the center line.
🔹 Style
Extend Lines: Extends the Simulated Value Lines into the future for further reference and analysis.

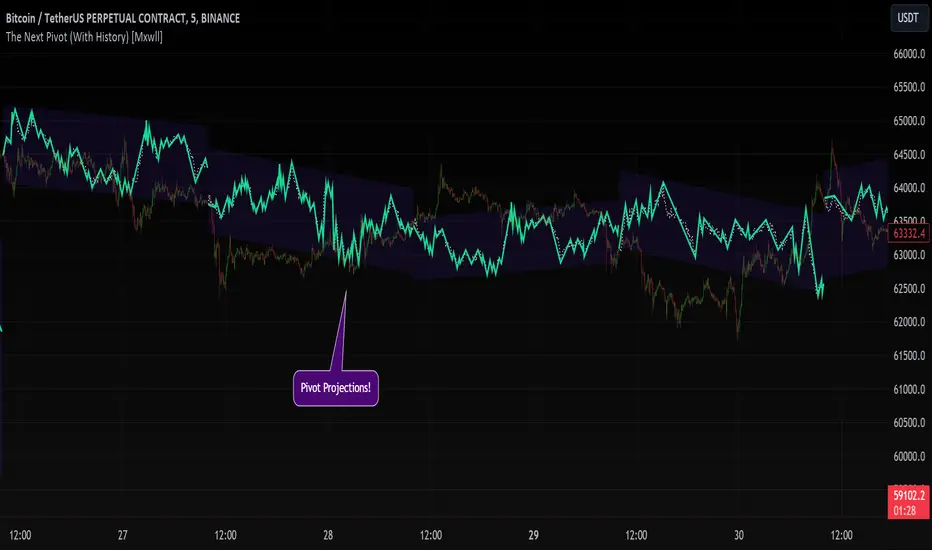
The Next Pivot (With History) [Mxwll]Introducing "The Next Pivot (With History)"!
With permission from the author @KioseffTrading
The script "The Next Pivot" has been restructured to show historical projections!
Features
Find the most similar price sequence per time frame change.
Forecast almost any public indicator! Not just price!
Forecast any session i.e. 4Hr, 1Hr, 15m, 1D, 1W
Forecast ZigZag for any session
Spearmen
Pearson
Absolute Difference
Cosine Similarity
Mean Squared Error
Kendall
Forecasted linear regression channel
The image above shows/explains some of the indicator's capabilities!
Additionally, you can project almost any indicator!
Should load times permit it, the script can search all bar history for a correlating sequence. This won't always be possible, contingent on the forecast length, correlation length, and the number of bars on the chart.
If a load time error occurs, simple reduce the "Bars Back To Search" parameter!
The script can only draw 500 bars into the future. For whatever time frame you are on and the session you wish to project, ensure it will not exceeded a 500-bar forecast!
Reasonable Assessment
The script uses various similarity measures to find the "most similar" price sequence to what's currently happening. Once found, the subsequent price move (to the most similar sequence) is recorded and projected forward.
So,
1: Script finds most similar price sequence
2: Script takes what happened after and projects forward
While this may be useful, the projection is simply the reaction to a possible one-off "similarity" to what's currently happening. Random fluctuations are likely and, if occurring, similarities between the current price sequence and the "most similar" sequence are plausibly coincidental.
Thanks!
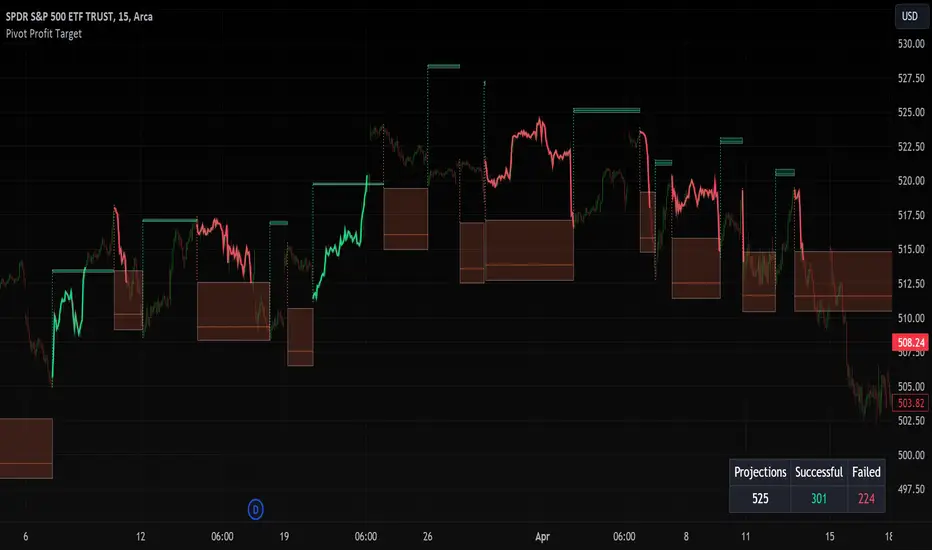
Pivot Profit Target [Mxwll]Introducing the Pivot Profit Target!
This script identifies recent pivot highs/lows and calculates the expected minimum distance for the next pivot, which acts as an approximate profit target.
The image above details the indicator's output.
The image above shows a table consisting of projection statistics.
How to use
The Pivot Profit Targets can be used to approximate a profit target for your trade.
Identify where your entry is relative to the most recent pivot, and assess whether the minimum expected distance for the most recent pivot has been exceeded. Treat the zones as an approximation.
If your trade aligns with the most recent pivot - treat the minimum expected distance zone as a potential profit target area. Of course, price might stop short or continue beyond the projection area!
That's it! Just a short and sweet script; thank you!
Historical Price Projection [LuxAlgo]The Historical Price Projection tool aims to project future price behavior based on historical price behavior plus a user defined growth factor.
The main feature of this tool is to plot a future price forecast with a surrounding area that exactly matches the price behavior of the selected period, with or without added drift.
Other features of the tool include:
User-selected period up to 500 bars anywhere on the chart within 5000 bars
User selected growth factor from 0 (no growth) to 100, this is the percentage of drift to be used in the forecast.
User selected area wide
Show/hide forecast area
🔶 USAGE
This tool generates a price projection with exactly the same price behavior over the period selected by the user, plus a growth factor .
The user must confirm the selection of the anchor point in order for the tool to be executed; this can be done directly on the chart by clicking on any bar, or via the date field in the settings panel.
As we can see on this chart, the four phases of the market cycle are clearly defined and marked, so we choose the distribution phase as our anchor point because in our analysis, we want to see how the market would behave if we were currently at the same point in the cycle.
In the image above, the growth factor parameter is set to 0 so that the projection matches the selection. The tool will use up to 500 bars after the selection point.
The growth factor is defined as the percentage of drift that the tool will use.
Drift is defined as follows:
For periods with a positive return: average negative return within the period
For negative return periods: average positive return within the period
On the chart above, we have selected the same period but added a growth factor of 10, so that the tool uses a 10% drift in its calculations of future prices.
As the return in the selected period is negative, the added drift will make the projection more bearish than the prices from the selection.
On this chart we have changed the selected period, we have chosen the accumulation phase of the last cycle as the anchor point, again with a growth factor of 10%.
As we can see, prices explode higher, making the projection very bullish, as the added effect of both the bullish selected period and the 10% drift is taken into account.
This last chart is a long-term chart, a quarterly chart of the Dow, and it will serve as a review exercise.
What if... everything goes south and the crash of '29 is repeated?
The answer is in the chart, and it is not for the faint of heart
In this case we have chosen a growth factor of 0 to see exactly the same price behaviour projected into the future.
🔶 SETTINGS
🔹 Data Gathering
Anchor point: Starting point for data collection, up to 500 bars will be used.
🔹 Data Transformation
Growth Factor: Values from 0 to 100, is the amount of drift used to calculate the next price in the series.
Area Width: Values from 0 to 100, controls the width of the area around the forecast as an increment/decrement of the growth factor.
🔹 Style
Price line width: Size of the price line.
Bullish color
Bearish color
Show Area: Show forecast area.
Area color

MA+ ProjectionThe "MA+ Projection" indicator is designed to visualize the potential future direction of a moving average, taking into account the impact of historical data loss. It is primarily aimed at providing a practical perspective on how moving averages could evolve as older data points are no longer considered.
Key Features:
Supported Moving Averages: SMA, EMA, WMA, VWMA, and VAWMA (Volume Adjusted WMA).
Flexible Time Span Settings: Customize the moving average length in bars, minutes, or days.
Adjustable Projection Scope: Set a percentage of the measurement to project forward.
Projection 'Cone': Show/hide the deviation and control the multiple.
Use Last Source Value: An option to add the latest known value to the moving window instead of only letting the window shrink. (Enabled by default.)
How It Works:
Given the specified parameters, it takes the selected moving average type (a known formula like SMA, EMA, or WMA), and projects the future data points by continuing to move the data 'window' forward without adding any more data. By default, it extends the average by assuming the price hasn't changed after the last bar. Alternatively, the projection can be the result of shrinking the window as it moves forward without adding any new data points.
Note:
This tool is for visual projection, not prediction. Its purpose is to aid in the analysis of potential future trends based on historical data, not to provide definitive market forecasts.

Machine Learning: Support and Resistance [YinYangAlgorithms]Overview:
Support and Resistance is normally based upon Pivot Points and Highest Highs and Lowest Lows. Many times coders even incorporate Volume, RSI and other factors into the equation. However there may be a downside to doing a pure technical approach based on historical levels. We live in a time where Machine Learning is becoming more and more used; thus we have decided to create a Machine Learning Support and Resistance Projection based Indicator. Rather than using traditional Support and Resistance calculations using historical data, we have taken a rather different approach. This Indicator instead attempts to Predict and Project where Support and Resistance locations will be based on a Machine Learning Model using a form of KNN (k-Nearest Neighbors).
Since this indicator creates a Projection of where it deems Support and Resistance will be, it has the ability to move its Support and Resistance before the price even gets to it if it believes it will surpass its projections. This may create a more accurate placement of Support and Resistance as they’re not based on historical levels.
This Indicator does not Repaint.
How it works:
This Indicator makes its projections based on the source you provide (by default close) of the previous bar and submits the source, RSI and EMA to our Projection Function to get its projection of the current bar.
The Projection function essentially calculates potential movement after finding the differences between the source the MA from the current bar, previous bar and average over the span of Machine Learning Length.
Potential movement is defined as:
Average Difference + Average(Machine Learning Average, Average Last Distance)
Average Difference: (Absolute value of Current Source - Current MA) - (Absolute value of Machine Learning Average - Machine Learning MA)
Average Last Distance: Average(Current Source - Current MA, Previous Source - Previous MA)
It then predicts the next bars directional movement (bullish or bearish bar) using several factors:
Previous Source > Previous MA
Current Source - Current MA > Average Source - Average MA
Current RSI > Previous RSI
Current RSI > 30 and Previous RSI <= 30
Current RSI < 70 and Previous RSI >= 70
This helps us to predict the direction the next bar may move.
We then calculate a multiplier that we apply to our Potential Movement value to get our final result which is our Current Bars Close Projection.
Our multiplier is calculated using:
(Current RSI > 30 and Previous RSI <= 30) OR (Current RSI < 70 and Previous RSI >= 70)
Current Source - Current MA > Previous Source - Previous MA
We then create an array and fill it with the previous X projections (Machine Learning Length) and send it to another function. This function, if told to, will sort the data accordingly and then output the KNN average of the length given.
We calculate and plot various KNN lengths to create different Zones:
Strong Support: Length of 2 but sort the data Ascending (low to high)
Strong Resistance: Length of 2 but sort the data Descending (high to low)
Support: Length of Machine Length Length / 10 or Min of 2 sorted by Ascending
Resistance: Length of Machine Length Length / 10 or Min of 2 sorted by Descending
There are also 4 other plots you may be wondering what they are, there is your AVG, VWMA, Long Term Memory and Current Projection.
By default your Current Projection is disabled in settings but you can enable it if you are curious to see how the projections for each close are calculated. It is, however, not a crucial point of interest (white line).
The average is simply the average value of the Machine Learning Data (purple line).
The VWMA is a VWMA calculation applied to our Data over a length specified in settings (by default 1)(blue line). The VWMA is crucial when combined with the Avg as they can cross over and under each other. These crosses represent potential Bullish and Bearish zones.
Lastly, but certainly not least, we have the Long Term Memory (maroon line). The Long Term Memory can be displayed either as an ‘Average’, ‘Hard Line’ or ‘None’. The Long Term Average is only updated every Machine Learning Length Bar Index’s and is populated with the average of the Machine Learning Data. For Instance, if Machine Learning Length is set to 100, the Long Term Memory is only updated every 100 bars, and since its length is the same as the Machine Learning Length, that means its data is composed of 10,000 bars worth of data. The Long Term Memory may be very beneficial for determining where Support and Resistance lie over the Long Term within a Machine Learning Algorithm. When set to ‘Average’ it plots the connection lines diagonally, and although they may be more visually appealing, they’re less useful when it comes to actually seeing support and resistance as generally speaking, support and resistance lie on the horizontal. When set to ‘Hard Line’ the Long Term Memory is connected with hard lines and holds the price value until the next time it is updated. This makes it much more useful for potentially identifying Support and Resistance.
Tutorial:
Here is an overview of what the Indicator looks like, now let's start to dissect it.
In the example above we can see how all of the lines between the Major Support and Resistance zones may act as BOTH Support and Resistance depending on which side the price is currently on. In the circle on the left, we can see how it can fluctuate between the two. If you look at the circle on the right, we can see how the Average line acts as a strong support before it fails to maintain it. Generally speaking, most Support and Resistance locations may potentially fail to hold after 3 tests, as the Average did in this example.
As you can see, the Support and Resistance doesn’t wait to be tested before adjusting, which is why there are 2 lines which create their zones. The inner line is the Support/Resistance and the outer line is the Strong Support/Resistance. The Yellow Circle shows the inner line was able to calculate the moving resistance correctly and then adjusted accordingly as it was projecting the price to keep increasing. However, if you look at the White Circle, you can see that since there was first a crash, and then parabolic movement, that the inner zone could not move and predict the resistance as well as the outer zone could.
We consider the price to be ‘Overvalued’ when it is above the VWMA (blue line) and ‘Undervalued’ when it is below the VWMA. It is considered ‘fair’ price when it is within the VWMA to Average zone (between the blue and purple lines). If you look at the example above, you’ll notice where the two yellow circles are, it is not only considered ‘Overvalued’, but it then proceeds to ride the inner resistance line upwards. This is common when the market is overly bullish and vice versa when it is bearish. Please keep in mind, although it is common, it doesn’t mean a correction can’t happen.
In this example above we look at the last bull run that may have started due to the halving. This bull run was very bullish as you can see in the example above. The price was constantly sitting within the Resistance Zone and the VWMA that was very close to it was constantly acting as a Support. Naturally, due to the Algorithm used in this Indicator, as the momentum starts to slow down, the VWMA (blue line) will start to space out more and more from the Resistance Zone. This doesn’t mean the momentum is gone, it just means it may be slowing down.
Unfortunately we have to study the Bear Market with a different perspective than the Bull Market. However, there are still some similarities within the two. If you refer to the example above and the previous example, you can clearly see that the Bull Market loves to stay with the Resistance Zone and use the VWMA as a Support. However, the Bear Market does not. This is a normal occurrence, however we can see from the example above you may see a correction / horizontal movement when the Outer Support Line is touched. If you look at all 3 yellow circles, the Outer Support Line was touched, then either a small correction or horizontal consolidation occurred.
We will conclude our Tutorial here, hopefully you’ll be able to benefit from a moving Support and Resistance calculated with Machine Learning that projects its locations, rather than using traditional calculations.
Settings:
Source: This source is the base for all our calculations
Machine Learning Length: How much projection data are we storing and using to make calculations.
Smoothing Length: We need to smooth calculations such as RSI, EMA and VWMA. What length are we smoothing it with?
VWMA ML Projection Length: How far into our Machine Learning data should we average for our VWMA. Please note the 'Smoothing Length' is still applied here after getting the Projection Average.
Long Term Memory: Long term memory has the same storage length but is only updated once per Machine Learning Length. For instance, if Machine Learning Length is 100, it will save the Average of our data once every 100 bars. This means its memory is an average of 10,000 bars of Machine Learning. 'Average' connects its values diagonally whereas 'Hard Line' holds its value until it changes.
Use Average Last Distance In Potential Movement: This can help accuracy but generally also displaces the Support and Resistance by projecting it further.
Show Current Projection: Projections occur for each bar, and our Machine Learning utilizes these projections by storing and evaluating them. This toggle will display the Current Projection Line which is used to create all our Projections.
If you have any questions, comments, ideas or concerns please don't hesitate to contact us.
HAPPY TRADING!

YinYang Bar ForecastOverview:
YinYang Bar Forecast is a prediction indicator. It predicts the movement for High, Low, Open and Close for up to 13 bars into the future. We created this Indicator as we felt the TradingView community could benefit from a bar forecast as there wasn’t any currently available.
Our YinYang Bar Forecast is something we plan on continuously working on to better improve it, but at its current state it is still very useful and decently accurate. It features many calculations to derive what it thinks the future bars will hold. Let’s discuss some of the logic behind it:
Each bar has its High, Low, Open and Close calculated individually for highest accuracy. Within these calculations we first check which bar it is we are calculating and base our span back length that we are getting our data from based on the bar index we are generating. This helps us get a Moving Average for this bar index.
We take this MA and we apply our Custom Volume Filter calculation on it, which is essentially us dividing the current bars volume over the average volume in the last ‘Filtered Length’ (Setting) length. We take this decimal and multiply it on our MA and smooth it out with a VWMA.
We take the new Volume Filtered MA and apply a RSI Filter calculation on it. RSI Filter is where we take the difference between the high and low of this bar and we multiply it with an RSI calculation using our Volume Filtered MA. We take the result of that multiplication and either add or subtract it from the Volume Filtered MA based on if close > open. This makes our RSI Filtered MA.
Next, we do an EMA Strength Calculation which is where we check if close > ema(close, ‘EMA Averaged Length’) (Setting). Based on this condition we assign a multiplier that is applied to our RSI Filtered MA. We divide by how many bars we are predicting and add a bit to each predictive bar so that the further we go into the future the stronger the strength is.
Next we check RSI and RSI MA levels and apply multiplications based on its RSI levels and if it is greater than or less than the MA. Also it is affected by if the RSI is <= 30 and >= 70.
Finally we check the MFI and MFI MA levels and like RSI we apply multiplications based on its MFI levels and if it is greater than or less than the MA. It is also affected by if the MFI is <= 30 and >= 70.
Please note the way we calculate this may change in the future, this is just currently what we deemed works best for forecasting the future bars. Also note this script uses MA calculations out of scope for efficiency but there is potential for inconsistencies.
Innately it’s main use is the projection it provides. It only draws the bars for realtime bars and not historical ones, so the best way to backtest it is with TradingView’s Replay Tool.
Well, enough of the logic behind it, let's get to understanding how to use it:
Tutorial:
So unfortunately we aren’t able to plot legit bars/candles into the future so we’ve had to do a bit of a work around using lines and fills. As you can see here we have 4 Lines and 3 Zones:
Lines:
Green: Represents the High
Orange: Represents the Open
Teal: Represents the Close
Red: Represents the Low
Zones:
High Zone: This zone is from either Open or Close to the High and is ALWAYS filled with Green.
Open/Close Zone: This zone is from the Open to the Close and is filled with either Green or Red based on if it's greater than the previous bar (real or forecasted).
Low Zone: This zone is from either Open or Close to the Low and is ALWAYS filled with Red.
As you can see generally the Forecasted bars are generally within strong pivot locations and are a good estimation of what will likely go on. Please note, the WHOLE structure of the prediction can change based on the current bars movements and the way it affects the calculations.
Let's look 1 bar back from the current bar just so we can see what it used to Forecast:
As you can see it has changed quite a bit from the previous bar, but if you look close, we drew horizontal lines around where its projecting the next bar to be (our current realtime bar), if we go back to the live chart:
Its projections were pretty close for the high and low. Generally, right now at least, it does a much better job at predicting the high and low than it does the open and close, however we will do our best to fine tune that in future updates.
Remember, this indicator is not meant to base your trades on, but rather give you a Forecast towards the general direction of the next few bars. Somewhat like weather, the farther the bar (or day for weather), the harder it is to predict. For this reason we recommend you focusing on the first few bars as they are more accurate, but review the further ones as they may help show the trend and the way that pair will move.
We will conclude this tutorial here, hopefully this Predictive Indicator can be of some help and use to you. If you have any questions, comments, ideas or concerns please let us know.
Settings:
Forecast Length: How many bars should we predict into the Future? Max 13
Each Bar Length Multiplier: For each new Forecast bar, how many more bars are averaged? Min 2
VWMA Averaged Length: All Forecast bars are put into a VWMA, what length should we use?
EMA Averaged Length: All Forecast bars are put into a EMA, what length should we use?
Filtered Length: What length should we use for Filtered Volume and RSI?
EMA Strength Length: What length should we use for the EMA Strength
HAPPY TRADING!

Inverted ProjectionThe "Inverted Projection" indicator calculates the Simple Moving Average (SMA) and draws lines representing an inverted projection. The indicator swaps the highs and lows of the projection to provide a unique perspective on price movement.
This indicator is a simple study that should not be taken seriously as a tool for predicting future price movements; it is purely intended for exploratory purposes.

Tomorrow's Custom Sessions: 4x Sessions projected into next dayTool to visualize your favored sessions for the day ahead (4x custom sessions)
-Input four custom sessions; they will be projected into the next day.
-Toggle on/off each session independently.
-Adjust multiplier UP to show more days of history (setting 0 = tomorrow only; setting 1 = today and tomorrow).
-Increase number from 1>>125 to show historical sessions/days, for backtesting purposes.
-If Set to 0, showing tomorrow only; the projected session boxes will disappear as price passes through their right hand edge.
--note: the session defaults i've written are arbitrary/not special; please choose your own--
Setting '0'; shows next day's sessions only

Week & Day Boxes Projected forward; with day-of-week labelsProjecting Week and Day boxes forward into the future, as an aide in framing the shape/profile of the coming week(s)/day(s).
////user inputs////
~toggle on/off daily and/or weekly boxes.
~input number of 2week blocks or number of 2day blocks to project forward.
~independently format colors and opacities of weekly and daily boxes.
~toggle on/off day-of-week labels (if you just want day labels, make opacity of day boxes&borders zero).
////notes////
-I have limited the project-forward numbers to keep it neat. If you want to play around with them, edit UP the FIRST integer in lines 56, 58, 62, 64 (currently set to 11,10, 41, 40 respectively). And edit UP maxvals in lines 9 and 15.
-To change the height of weekly and/or daily boxes, tweak the SECOND integer in lines 56, 58, 62, 64.
-Written for ES (S&P); tested/working on FX and BTC too.
-Starts painting/Resets at the beginning of a new week (i.e. Sunday eve).
-Sunday is blended into Monday; day's are defined as finishing at 6pm (New York Time).

Next Pivot Projection [Trendoscope]Still experimental. Extending further on the divergence backtest results - in this script we try to project next 2 pivots (including one unconfirmed pivot)
🎲 Previous experiments
1. Divergence-Backtester
2. Divergence-Backtester-V2
🎲 Additions
Apart from collecting the stats on number of occurrences of HH, HL, LH, LL - this script also keeps track of average ratio for each levels and average bars.
Based on these data, we try to calculate the next pivot projections including possible bar and price.
Cloud covering the candles indicate historical levels of average HH, HL, LH, LL projections.
Hover on projection labels to find more details in tooltips.
🎲 Overall method in a nutshell
🎲 Going bit deeper
🎯 Unconfirmed Pivot and its projection - Last pivot of the zigzag is always unconfirmed. Meaning, it can potentially repaint based on further price movements. But, projection of the unconfirmed pivot will not change as it will be based on previous two pivots - both of which are confirmed.
🎯 Next Pivot Projection - Next pivot is projected based on last two pivots - which include last unconfirmed pivot. Hence, these projections can potentially repaint based on the last pivot repaint.
🎯 Historical projections displayed as cloud - Historical projection values are displayed as cloud around pivots.
A cloud above represents area from average lower high range to average higher high range. Cloud color is green if average ratio of pivot high is more than 1. Red Otherwise.
A cloud below represents area from average higher low range to average lower low range. Cloud color is red if average ratio of pivot high is more than 1. Green otherwise
