crypto Position Size CalculatorCrypto Position Size Calculator
this indicator helps you to figure out the position size your trade . and its only used for crypto
the indicator needs to fill the input section in order to give you the information table that includes position size .
The input section consists two section the first section you will give the trade info like entry , stop loss and take profit .
then the next section its about your account balance and risk per trade . then you can get your position size .
you can have also option where you can display your table like bottom right , bottom left or top right its your choice.
special thanks : Ahmed busury
special thanks : Aj group family
Zarządzanie Portfelem

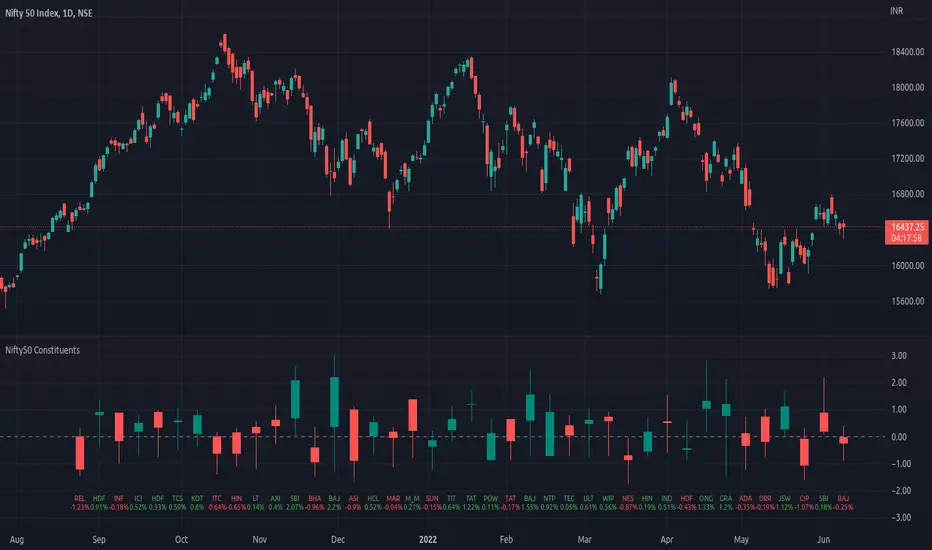
Top 40 constituents of Nifty50Displays real-time candles of top 40 constituents of Nifty50 for a given time frame, side-by-side. This gives an overall idea of breadth and depth of market movements in the time-frame.
Please note that, this is not a standard chart rendered bar-wise and may take time to load as it requests multiple securities. You could modify the contents, from settings, to include stocks from your portfolio or indices of different sectors.
NSE:NIFTY
Relevant World GDP GroupedLooking at a basket of countries total GDP for comparing size of economy. Makes it easy to select your own groupings of countries for comparison. A country's GDP is the total of consumer spending (C) plus business investment (I) and government spending (G), plus net exports, which is total exports minus total imports (X – M). Alliances visualized was the original idea but wasn't quite sure for a lot of other countries where they stand so it is what it is; feel free to improve.

US/CA Bond Yield CurveEasy Viewing of 4 different duration bond yields for US and Canada. Bond prices and bond yields are excellent indicators of the economy as a whole, and of inflation in particular. A bond's yield is the discount rate that can be used to make the present value of all of the bond's cash flows equal to its price. Good as part of a macro set.

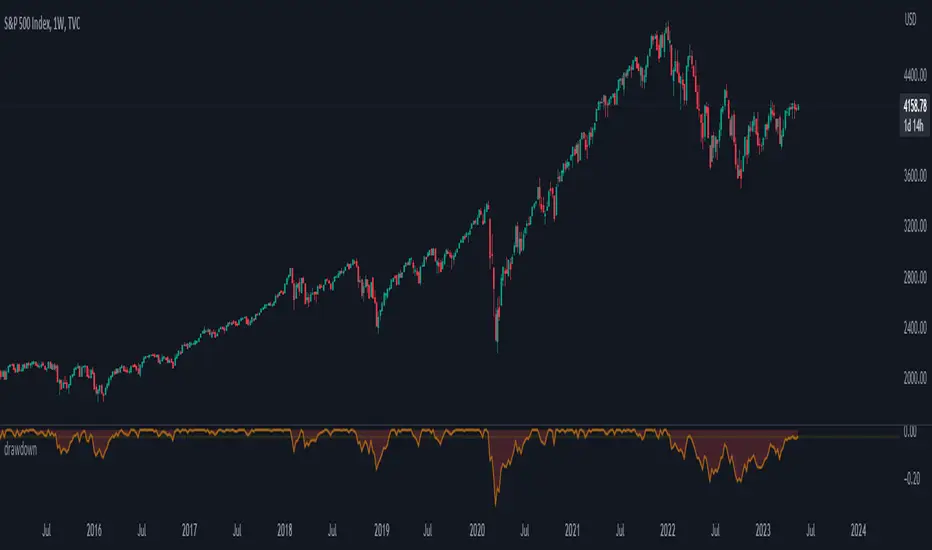
trailing_drawdown
Description:
Drawdown was a tool to measure historical risk, derived from measuring current wealth from its previous peak, casually from portfolio construction (weights allocation), will consider to having a minimum drawdown. In this indicator, the drawdown for individual assets is utilized to measure its value or percentage from its trailing peak (default to 1-yr period).
Drawdown:
drawdown = (price/peaks)-1
Feature:
Static: display drawdown as percentage
Dynamic: display drawdown as value
Asia Reversal ZoneThis indicator shows the most likely time Asia session reverses it direction.
Designed for US30 scalps 30-100 points.
Focus on price and time that is key.
Remove Plot line.
Also check out "Deluxo Kill zones" my other indicator.
-Enjoy

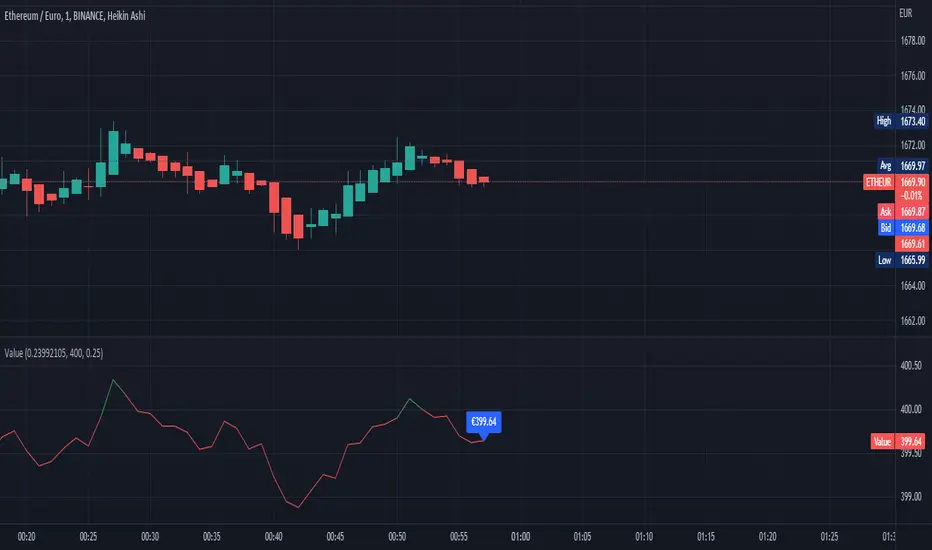
Worth of valueThis script represent the amount of the user's amount of the price rate, it also contains a tax calculation.
This is one of my first pine script, i would may look further to work on this script.
Leverage and contracts toolThis script is more like a tool than an indicator.
The script determinates the amount of contracts and the leverage needed to do one trade.
You must specify the following parameters:
Entry price
Stop Loss price
Stop Loss risk. It's the capital that you will loss if the price hit the SL price.
Operation equity. It's the whole capital involved in the operation.
No matter what side of operation is, it works in both ways (short and long).
To determine the levels could be useful use the short-long position tool of TradingView.

Portfolio with cryptoOVERVIEW
The indicator is made to ALL INSTRUMENTS included in the TradingView subscription
WERE IN THE SAME CURRENCY!
such as:
- Promotions
- Currencies
- Funds
- Crypto
and so on.
FEATURES
Added the ability to notify on the target price.
The movement of your portfolio in %, in money, etc., at any time, even in a MOBILE APPLICATION!
HOW TO USE
- Enter all the data in the settings
- To transfer to your currency, click the select choosing Your currency
- To create alerts, click on the indicator and select create alert
- Moving the cursor to any column of the header, you will see the tooltip
LIMITATIONS
To work in a mobile application
The text of the table should be made the smallest (TINY)
NOTES
Russian version Русская версия

iRisk Manager Hi everyone!
I would like to present my second indicator which has been incredibly useful to help me managing the risk when doing many kind of trades.
This tool can be used by anyone, on every timeframe and every asset and represents, in my opinion, one of the most effective methods for graphically managing multiple entries and keeping track of the most important quantities that come into play when entering a position:
- Entry Price.
- Take Profit Price.
- Stop Loss Price.
- Average Entry Price (in case we place additional orders to average the position).
- RR ratio.
- Margin effectively used.
HOW TO USE IT
In order to use this indicator properly, you need to
1) insert the amount of money you would like to employ for the position your are planning, in particular your deposit and the percentage you intend to use.
2) how many positions (initial entry included ) you would like to enter.
3) which kind of trade you would like to pursue (long/short).
4) how far the stop loss and take profit should be from the original entry price.
5) how far any additional entry must be placed from the original entry price in order to average the position.
CALCULATIONS
Once everything is set up, the indicator will split the margin you want to employ for the trade into different smaller amounts for each additional entry (original entry included).
The amounts will be computed by using some recursive formulas and will be proposed when an additional entry order is filled. Notice that the number of filled additional entries must be inserted by hand so that the indicator will propose how much margin you should employ and at what price you should place the next order.
LINES
- Yellow, it represents the initial price we planned to enter.
- Green solid , it represents the take profit level.
- Red, it represents the stop loss level.
- Olive dotted , it represents the next entry suggested by the indicator.
- Blue, it represents the cumulative average price of the position.
EXAMPLE
Suppose we want to enter a Long position on BTC at 30k and place a TP at 32k and SL at 28k. Suppose also that we plan to enter 3 positions with variations respectively of 500$ and we want to invest 1% of our deposit, e.g. 10k $, so that the total margin we are going to use will be 100$.
With this set up, the indicator will tell us to enter a long position with the following procedures:
x_1 = 18,18$ at p_1 = 30 000 $
x_2 = 27,27$ at p_2 = 29 500 $
x_3 = 54,55$ at p_3 = 29 000 $
The indicator will also automatically keep track of the total margin employed according to each filled entry, the cumulative average entry price of the ongoing trade and its associated RR ratio.
I hope you will enjoy it!

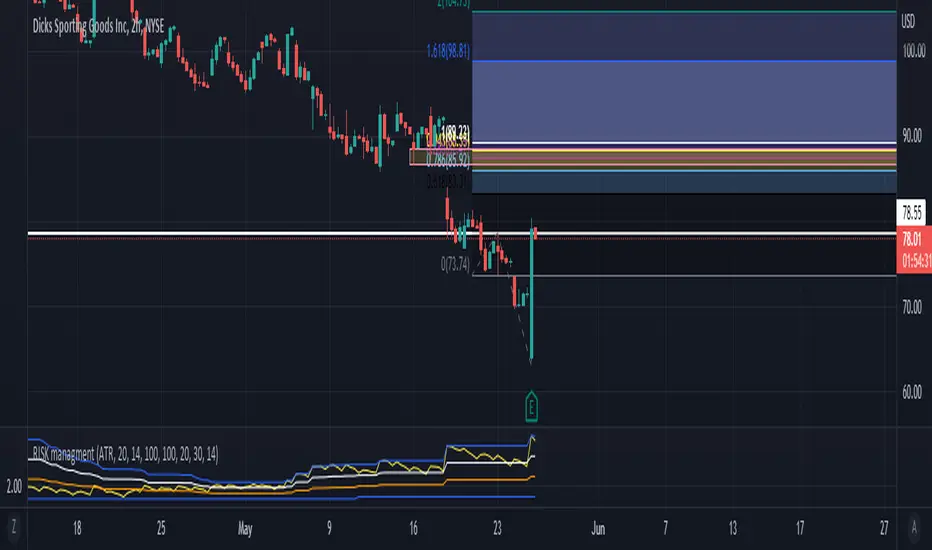
RISK managment TOOL not a netive english speakr - soory for spelling problems.
this tool purpse is to help you dtermine postion sizing
it take a trend meeter of your chose and mesure it with the high and low of lookback number (defult is 100 )
you can chose your trend meeter from 'close','VOL', 'MA short' , 'MA long' , 'MACD', 'VOL MA', 'ATR', 'MFI', 'TSI'
with that you can see if you are "overbought" or "oversold " with the highest and lowest of a lookback period
and size acording to that .
the MA box - MAshort and MA long is the same box for the MACD ma for calcs and for the TSI
for long - if in lower band buy +++ if midelle buy +++ if high buy +
for short - if in highr band short +++ if midelle short ++ if low short ++
hope it will help you
for source - comment email and tip.
כלי ניהול הסיכונים הזה נועד להראות לכם את היחס של המתנד הנבחר ביחס לגבוהה והנמוך בבחירת טווח הזמן הנבחר ( דיפולט הוא 100 ימים אחורה ) ובכך לעזור לכם בהחלטת גודל הפוזציה
הכלי נועד לעזור בוויזאולציה של הטרנד לעומת האיתות שאתם מקבלים ביחס לגבוהה או הנמוך של 100 ימים אחורה
אם אתם מתכננים עסקת לונג העדיפות לקנות כאשר הסמן נמצא ברצועה התחתונה ובמקום זה תוכלו להגדיל את הפוזציה ל +++
כאשר הסמן נמצא ברצועה האמצעית אפשר לקנות ++
וכאשר הסמן נמצא למעלה עדיף לשקול את הפוזציה או לקנות +
ההפך לשורט.
לקבלת הקוד אפשר להשאיר מייל בתגובה + טיפ.
תודה ל @daviddtech tnx to
Risk assistant - A simple risk caluclatorUsing my calculator every time seemed slow and unnecessary when it can be automated as well.
Fill in General settings, then measure from Entry to SL to display position size as a label.

PhinkTrade Risk Manager EssentialsHello there, fellow traders!
So, happy to bring you a new, free tool: my Risk Manager Essentials .
(To use it, click on "Add to favorite indicators" below, and then look for it in your charts’ "Indicators & Strategies" dialog window, inside "Favorites" tab.)
The main objective of this indicator is to help and incentivize as many traders as possible to adopt essential risk management practices .
First and foremost, it helps you define how much you can buy or sell, at your chosen price levels, in order to keep your risk always under control (in other words: in order to limit the amount you can potentially lose with a trade if your stop loss order is hit).
This is fundamental if you want to have a lasting and successful trading career: protect your capital, always . Because without it, you know: it’s game over.
Indicator also helps you visualize where minimum ideal target / take profit level is , given your risk, using the popular 3:1 Return/Risk ratio (R/R) .
3:1 R/R ratio is popular because with it you only need to “be right” (have price reach your targets) about 33% of the time, in order to be profitable : in other words, the fewer successful trades will pay you more than the sum of your unsuccessful ones will take from you.
So, make sure your strategy has a success rate greater than 33% and apply 3:1 R/R to your trades . This indicator will help you that, and with developing the necessary discipline . For example, by knowing where the ideal target should be, given your choices, you can assess the likelihood of it being reached in current price context. If that would look like a hard to happen scenario, it would probably be a good idea to avoid taking that particular trade.
Now, let’s see how it works:
When you deploy the indicator to the chart for the first time, you’ll be asked to define:
Your 1st entry price (interactively: you can define and adjust levels directly on the chart, thanks to the new Interactive Mode introduced by TradingView (ty, TV team!))
Your stop loss price (likewise)
Your 1st target price (likewise)
Your starting capital (via initial Input dialog)
Your risk (likewise)
Your risk is how much of your starting capital you are willing to lose if your stop loss is hit (define it as a % of your starting capital).
There’s a good practice here too: to risk only 1 percent of your capital per trade . This way, you can reinforce the odds of making more money than you lose and keep your peace of mind in all trades – and avoid messing up with your plans – and statistics – along the way.
Successful trading is a statistics-based endeavor. So, you want to implement and maintain consistency. Again, this indicator helps with that.
After initial setup:
You can also define additional entries and targets (up to 3 each) . Just open indicator’s Settings window and adjust accordingly.
If you have more than one entry – or target, the amounts involved will be split evenly between them. You can also enable the display of the Average Entry and Average Target labels , to see the equivalent, should you have taken (or take) a single order for each.
You can also define (via Settings, then interactively) a particular date and time for the trade . This way, labels will be presented near that moment, instead of constantly show near the latest bar.
Finally, you can personalize some other display settings: levels precision (number of decimal places), labels positions , and labels colors .
In conclusion:
You are very welcome to check it out – and adopt it on your daily use!
Please let me know your feedbacks as well. If you find any issues, or have any suggestions, I’ll be glad to hear. You can contact me here, via TradingView, or Telegram.
Finally, check the updates section below , as new stuff may show from time to time.
Thank you very much for your attention, and enjoy!
PhinkTrade

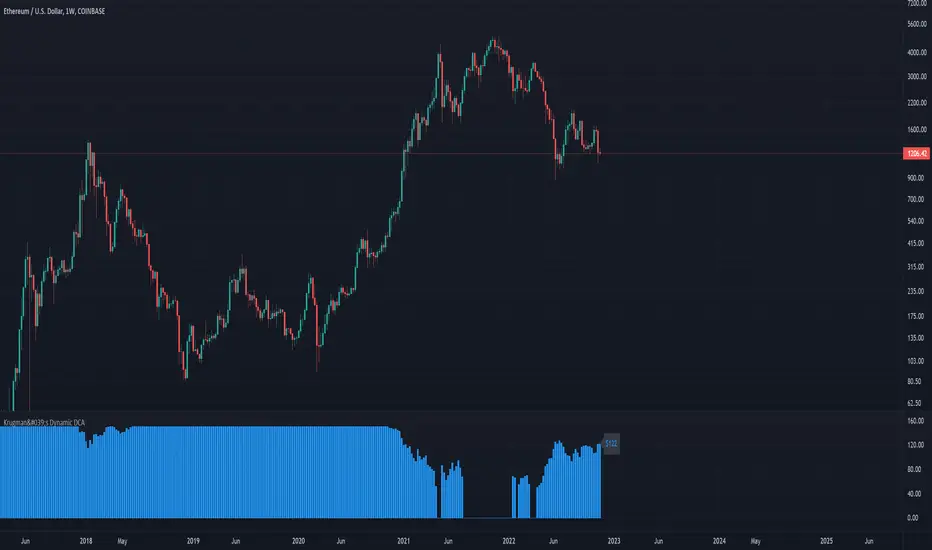
Krugman's Dynamic DCAThis script helps you create a DCA (dollar-cost averaging) strategy for your favorite markets and calculates the DCA value for each bar. This can be used to DCA daily, weekly, bi-weekly, etc.
Configuring the indicator:
- DCA Starting Price : the price you want to begin DCA'ing
- DCA Base Amount : the $ amount you will DCA when price is half of your starting price
- DCA Max Amount : the maximum amount you want to DCA regardless of how low price gets
The DCA scaling works exactly like the formula used to calculated the gain needed to recover from a given % loss. In this case it's calculated from the DCA Starting Price . The idea is to increase the DCA amount linearly with the increased upside potential.
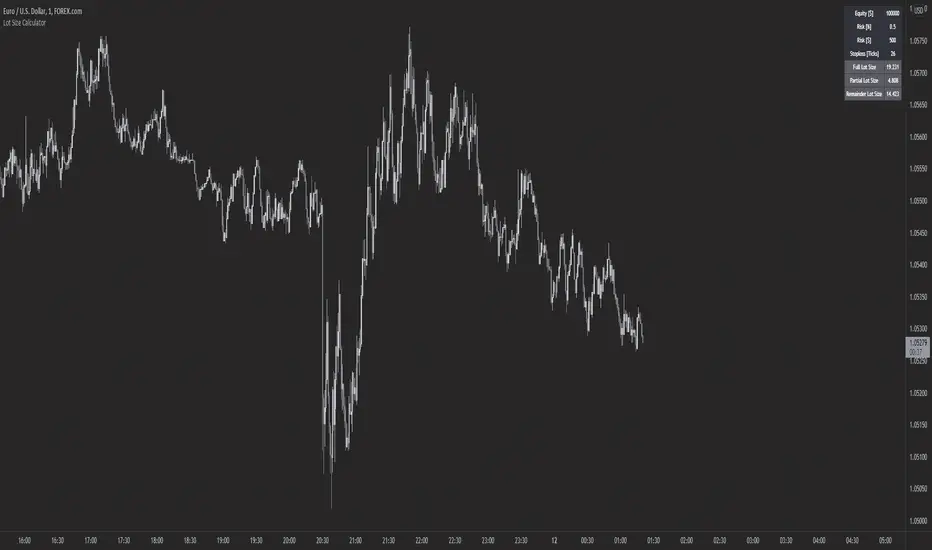
Forex Lot Size Calculator [AKCHOOO]Forex Lot Size Calculator based off stop loss (ticks), also shows the lot size needed for taking partials (based of % of trade to close partial position).
credits
inspired by @DewMic
adapted from @hanabil
Ultimate risk management toolHow to use:
Use the cursor to select the time, entry, stop loss, and target position. Then a window will pop up and type the trading fee or any other things you want to adjust to calculate the actual reward/risk ratio according to the price you selected.
Known error:
Settings of this script can't be saved as default might due to the interactive price selection function. If anyone knows how to fix it, please let me know.
feature:
1. Dynamic profit label can move up and down vertically on the right-hand side of the box.
2. The breakeven line can tell you you can move your stop loss to the entry price when the price reaches it.
3. Calculate the actual reward/risk ratio based on the trading fee. The calculator only calculates the actual Risk/Reward Ratio, which might be helpful for scalpers.
4. When the price touches sl or tp, that side of the box will be highlighted. Sometimes it doesn't work but I will try my best to fix it. Feel free to share your idea to help me to fix it.
5. Price alert. This tool compares with the alert function but reopens it if you want to change the alert price.
