Impulse Zones | Flux Charts💎 GENERAL OVERVIEW
Introducing our new Impulse Zones indicator, a powerful tool designed to identify significant price movements accompanied by strong volume, highlighting potential areas of support and resistance. These Impulse Zones can offer valuable insights into market momentum and potential reversal or continuation points. For more information about the process, please check the "HOW DOES IT WORK ?" section.
Impulse Zones Features :
Dynamic Zone Creation : Automatically identifies and plots potential supply and demand zones based on significant price impulses and volume spikes.
Customizable Settings : Allows you to adjust the sensitivity of zone detection based on your trading style and market conditions.
Retests and Breakouts : Clearly marks instances where price retests or breaks through established Impulse Zones, providing potential entry or exit signals.
Alerts : You can set alerts for Bullish & Bearish Impulse Zone detection and their retests.
🚩 UNIQUENESS
Our Impulse Zones indicator stands out by combining both price action (impulsive moves) and volume confirmation to define significant zones. Unlike simple support and resistance indicators, it emphasizes the strength behind price movements, potentially filtering out less significant levels. The inclusion of retest and breakout visuals directly on the chart provides immediate context for potential trading opportunities. The user can also set up alerts for freshly detected Impulse Zones & the retests of them.
📌 HOW DOES IT WORK ?
The indicator identifies bars where the price range (high - low) is significantly larger than the average true range (ATR), indicating a strong price movement. The Size Sensitivity input allows you to control how large this impulse needs to be relative to the ATR.
Simultaneously, it checks if the volume on the impulse bar is significantly higher than the average volume. The Volume Sensitivity input governs this threshold.
When both the price impulse and volume confirmation criteria are met, an Impulse Zone is created in the corresponding direction. The high and low of the impulse bar define the initial boundaries of the zone. Zones are extended forward in time to remain relevant. The indicator manages the number of active zones to maintain chart clarity and can remove zones that haven't been touched for a specified period. The indicator monitors price action within and around established zones.
A retest is identified when the price touches a zone and then moves away. A break occurs when the price closes beyond the invalidation point of a zone. Keep in mind that if "Show Historic Zones" setting is disabled, you will not see break labels as their zones will be removed from the chart.
The detection of Impulse Zones are immediate signs of significant buying or selling pressure entering the market. These zones represent areas where a strong imbalance between buyers and sellers has led to a rapid price movement accompanied by high volume. Bullish Impulse Zones act as a possible future support zone, and Bearish Impulse Zones act as a possible future resistance zone. Retests of the zones suggest a strong potential movement in the corresponding direction.
⚙️ SETTINGS
1. General Configuration
Show Historic Zones: If enabled, invalidated or expired Impulse Zones will remain visible on the chart.
2. Impulse Zones
Invalidation Method: Determines which part of the candle (Wick or Close) is used to invalidate a zone break.
Size Sensitivity: Controls the required size of the impulse bar relative to the ATR for a zone to be detected. Higher values may identify fewer, larger zones. Lower values may detect more, smaller zones.
Volume Sensitivity: Controls the required volume of the impulse bar relative to the average volume for a zone to be detected. Higher values require more significant volume.
Labels: Toggles the display of "IZ" labels on the identified zones.
Retests: Enables the visual highlighting of retests on the zones.
Breaks: Enables the visual highlighting of zone breaks.
Punkty Pivota i Poziomy

Liqudation HeatMap [BigBeluga]🔵 OVERVIEW
An advanced liquidity visualization tool that plots horizontal heat zones to highlight where potential liquidations and volume clusters are most likely hiding beneath price action.
Liqudation HeatMap scans historical price movements for local highs and lows with elevated volume or candle range. It then draws dynamic heatmap boxes—shaded from lime (low interest) to yellow (high interest)—revealing potential zones of trapped positions or stop clusters. A vertical scale on the right shows you the relative strength of volume behind each level, from 0 to the highest detected.
🔵 CONCEPTS
Maps areas of potential liquidity using volume or candle range (if volume is unavailable).
Identifies swing highs/lows (pivots) and extends heatmap boxes outward from these levels. Colors each zone based on the relative strength of volume concentration.
Fades or removes zones once price crosses their midpoints, simulating the idea of liquidity being “consumed.”
Displays a live vertical scale that shows the volume range for quick reference.
🔵 FEATURES
Dynamic Heatmap Zones:
Draws few boxes above and after pivot highs and below pivot lows, each shaded based on volume concentration.
Smart Coloring System:
Uses a gradient from lime (low) to yellow (high) to visually distinguish between weak and strong liquidity zones.
Adaptive ATR Widths:
Automatically adjusts zone thickness based on volatility (ATR), scaling intelligently across timeframes.
Liquidity Consumption Logic:
Zones are stope extending once price interacts with them—mimicking the behavior of real liquidation sweeps.
Volume Scale Legend:
A real-time scale is plotted on the right side, showing the min-max range of volume used for heat calculations.
🔵 HOW TO USE
Look for thick yellow zones to identify areas of concentrated stop losses or liquidation triggers.
Use these levels to anticipate mean reversion points or high-volatility zones.
Combine with your trend or structure tools to trade into or fade these liquidity pools.
On lower timeframes, use this tool to confirm entries around sweeps or deviations.
Use the right-side scale to compare relative zone strength instantly.
🔵 CONCLUSION
Liqudation HeatMap is a powerful visualization tool that uncovers where liquidity likely resides on the chart. By highlighting hidden traps and reactive levels in real-time, it gives traders a significant edge when it comes to spotting stop hunts, mean reversions, and areas of institutional interest. Whether you’re scalping or swing trading, this heatmap provides unmatched context on the market’s hidden intent.

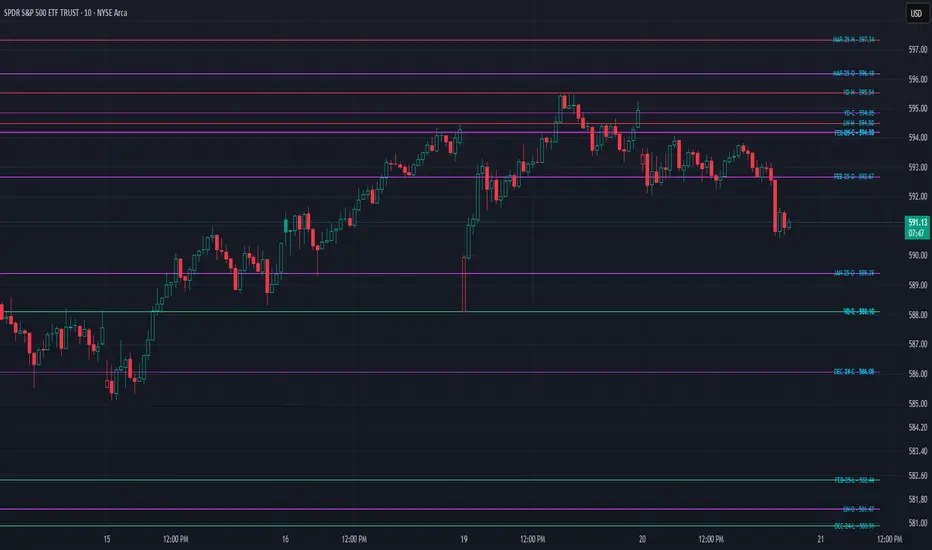
StonkGame AutoLevels+Hey gang — made a new levels script to automatically plot the ones I use the most.
StonkGame AutoLevels+ automatically plots structural price levels from major timeframes — including Yesterday, Last Week, Last Month, Last Quarter, and Last Year — with the option to include up to 6 months of historical monthly open, high, low, and close levels.
Everything’s fully customizable. You pick which timeframes to show, which price types (O/H/L/C) matter, and where the labels appear. Highs are red, lows are lime. Monthly opens are fuchsia, closes are purple — easy to separate at a glance.
Labels auto-stagger to reduce clutter and can be positioned left, right, or center — or turned off completely. You also control how far they sit from price.
The screenshot shows everything turned on just to demo the range — but in practice, I usually stick with the standard levels like Last Week or Last Month, and only show highs and lows (they define structure best IMO).
Clean, contextual, and built for traders who want clarity without noise.
Elliott Wave Noise FilterElliott Wave Noise Filter
Overview
The Elliott Wave Noise Filter is a specialized indicator for TradingView, designed to solve one of the biggest challenges in Elliott Wave analysis on lower timeframes: the identification of market noise. By combining multiple advanced filtering techniques, this indicator helps distinguish meaningful price action from random fluctuations.
The Problem
On lower timeframes—especially below 15 minutes—Elliott Wave analysis is significantly impacted by excessive market noise. This noise can lead to misinterpretation of wave structures, making it difficult to execute reliable trading decisions.
The Solution
The Elliott Wave Noise Filter utilizes four powerful methods to detect and filter noise:
ATR-Based Volatility Analysis: Identifies price movements too small to be structurally meaningful
Volume Confirmation: Filters out price moves that occur with insufficient volume
Trend Strength Measurement (ADX): Detects periods of weak trend activity, where noise tends to dominate
Fractal Pattern Recognition: Marks significant turning points that could be relevant for Elliott Wave analysis
Features
Visual Indicators
Background Coloring: Red indicates noise; green signifies a clear signal
Hull Moving Average: Smooths price action and highlights the prevailing trend
Fractal Markers: Triangles mark significant highs and lows
Status Panel: Displays current noise status and ADX value
Customization Options
ATR Period: Adjust the lookback period for ATR calculations
Noise Threshold: Defines the percentage of ATR below which a movement is considered noise
Volume Filter: Can be enabled or disabled
Volume Threshold: Sets the ratio to average volume for a move to be deemed significant
Hull MA Display and Length: Configure the moving average settings
ADX Parameters: Adjust trend strength sensitivity
Use Cases
For Elliott Wave Analysis
Eliminate noise to identify cleaner wave structures
Use fractal markers as potential wave endpoints
Reference the Hull MA for determining the broader trend
For General Trading
Identify high-noise periods to avoid low-quality setups
Spot clearer market phases for better entries
Assess price action quality through visual cues
Multi-Timeframe Approach
Apply the indicator across different timeframes for a comprehensive view
Prefer trading when both higher and lower timeframes align with consistent signals
Optimal Settings
For Very Short Timeframes (1–5 minutes)
Higher Noise Threshold (0.4–0.5)
Longer ATR Period (20–30)
Higher Volume Threshold (1.0–1.2)
For Medium Timeframes (15–60 minutes)
Medium Noise Threshold (0.2–0.3)
Standard ATR Period (14)
Standard Volume Threshold (0.8)
For Higher Timeframes (4h and above)
Lower Noise Threshold (0.1–0.2)
Shorter ATR Period (10)
Lower Volume Threshold (0.6–0.7)
Conclusion
The Elliott Wave Noise Filter is an essential tool for any Elliott Wave analyst or trader working on lower timeframes. By reducing noise and emphasizing significant market movements, it enables more precise analysis and potentially more profitable trading decisions.
Note: As with any technical indicator, the Elliott Wave Noise Filter should be used as part of a broader trading strategy and not as a standalone signal for trade execution.

CandelaCharts - Buyside & Sellside 📝 Overview
The Buyside & Sellside Liquidity Indicator is designed to identify and emphasize one of the foundational concepts within the ICT (Inner Circle Trader) trading methodology: liquidity levels.
This tool focuses on pinpointing key areas in the market where buy-side and sell-side liquidity is concentrated, providing traders with insights into potential price targets, reversal zones, and institutional order flow behavior.
By highlighting these liquidity zones, the indicator serves as a strategic aid in understanding market dynamics and enhancing decision-making in alignment with ICT principles.
📦 Features
Buyside & Sellside Liquidity
Invalidated Liquidity
Threshold
Styling
⚙️ Settings
Liquidity: Controls visibility of Bullish/Bearish Liquidity levels.
Invalidated: Displays the invalidated liquidity levels.
Levels: Controls the number of Liquidity levels that will be displayed.
Line Style: Customize the line style and width.
Threshold: Filter by swing points the Liquidity levels.
Labels: Control the Labels visibility.
⚡️ Showcase
Buyside & Sellside
Invalidated
🚨 Alerts
This script offers alert options for all signal types.
Bearish Signal
A bearish signal is generated when the price reaches a Buyside Liquidity level.
Bullish Signal
A bullish signal is generated when the price reaches a Sellside Liquidity level.
⚠️ Disclaimer
Trading involves significant risk, and many participants may incur losses. The content on this site is not intended as financial advice and should not be interpreted as such. Decisions to buy, sell, hold, or trade securities, commodities, or other financial instruments carry inherent risks and are best made with guidance from qualified financial professionals. Past performance is not indicative of future results.

Wick SweepThe Wick Sweep indicator identifies potential trend reversal zones based on price action patterns and swing points. Specifically, it looks for "Wick Sweeps," a concept where the market temporarily breaks a swing low or high (creating a "wick"), only to reverse in the opposite direction. This pattern is often indicative of a market attempting to trap traders before making a larger move. The indicator marks these zones using dashed lines, helping traders spot key areas of potential price action.
Key Features:
* Swing Low and High Detection: The indicator identifies significant swing lows and highs within a user-defined period by employing Williams fractals.
* Wick Sweep Detection: Once a swing low or high is identified, the indicator looks for price movements that break through the low or high (creating a wick) and then reverses direction.
* Fractal Plotting: Optionally, the indicator plots fractal points (triangle shapes) on the chart when a swing low or high is detected. This can assist in visually identifying the potential wick sweep areas.
* Line Plotting: When a wick sweep is detected, a dashed line is drawn at the price level of the failed low or high, visually marking the potential reversal zone.
Inputs:
* Periods: The number of bars used to identify swing highs and lows. A higher value results in fewer, more significant swing points.
* Line Color: The color of the dashed lines drawn when a wick sweep is detected. Customize this to match your chart's theme or preferences.
* Show Fractals: A toggle that, when enabled, plots triangle shapes above and below bars indicating swing highs (up triangles) and swing lows (down triangles).
Functionality:
* Swing High and Low Calculation:
- The indicator calculates the swing low and swing high based on the periods input. A swing low is identified when the current low is the lowest within a range of (2 * periods + 1), with the lowest point being at the center of the period.
- Similarly, a swing high is identified when the current high is the highest within the same range.
* Wick Sweep Detection:
- Once a swing low or high is detected, the script looks for a potential wick. This happens when the price breaks the swing low or high and then reverses in the opposite direction.
- For a valid wick sweep, the price should briefly move beyond the identified swing point but then close in the opposite direction (i.e., a bullish reversal for a swing low and a bearish reversal for a swing high).
- A line is drawn at the price level of the failed low or high when a wick sweep is confirmed.
Confirmations for Reversal:
* The confirmation for a wick sweep requires that the price not only break the swing low/high but also close in the opposite direction (i.e., close above the low for a bullish reversal or close below the high for a bearish reversal).
* The confirmation is further refined by checking that the price movement is within a reasonable distance from the original swing point, which prevents the indicator from marking distant, unimportant price levels.
Additional Notes:
* The Wick Sweep indicator does not provide standalone trading signals; it is best used in conjunction with other technical analysis tools, such as trend analysis, oscillators, or volume indicators.
* The periods input can be adjusted based on the trader’s preferred level of sensitivity. A lower period value will result in more frequent swing points and potentially more signals, while a higher value will focus on more significant market swings.
* The indicator may work well in ranging markets where price tends to oscillate between key support and resistance levels.

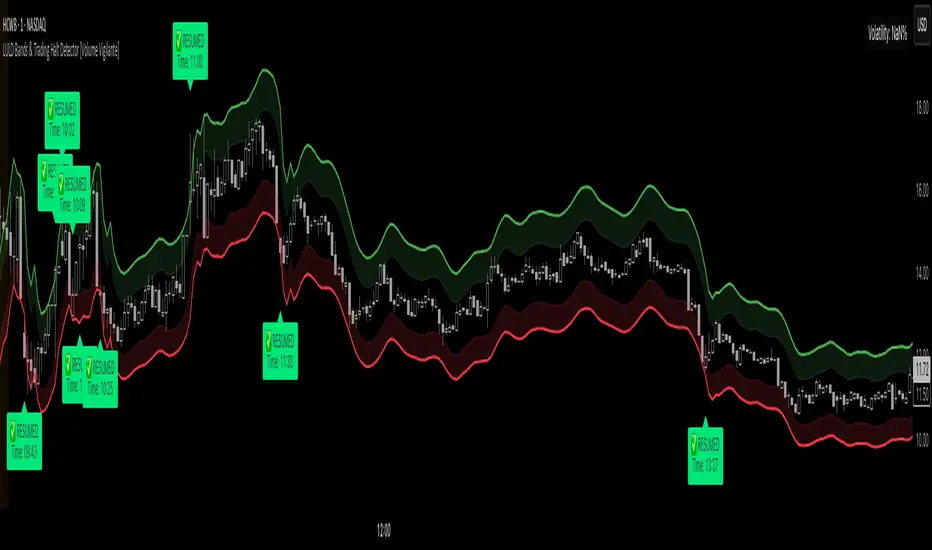
LULD Bands & Trading Halt Detector [Volume Vigilante]📖 LULD Bands & Trading Halt Detector
This advanced tool visualizes official Limit Up / Limit Down (LULD) price bands and detects regulatory trading halts and resumptions based on SEC and NASDAQ rules. It is engineered for high accuracy by anchoring all calculations to the 1-minute timeframe, ensuring reliable signals across any chart resolution.
📌 What Does This Script Do?
- Draws real-time LULD price band estimations and optional buffer (caution) zones directly on the chart.
- Detects trading halt resumptions by monitoring time gaps between candles and other regulatory criteria. (Note: Due to Pine Script limitations, halts cannot be detected in real-time, only resumptions after they occur.)
- Triggers real-time alerts for:
- Trading Resumptions (Limit Up & Limit Down)
- LULD Zone Entries (Caution Zone)
- Band Breaches (Limit Up and Limit Down)
- Plots historical halt resumption markers to analyse past events.
📐 How It Works:
- Implements official SEC/NASDAQ LULD rules for Tier 1 and Tier 2 securities.
- Applies special band adjustments for the final 25 minutes of trading (after 3:35 PM ET).
- Anchors all logic to the 1-minute timeframe for precise calculations, even on higher timeframe charts.
- Includes adjustable volume and volatility filters to eliminate false signals (ghost halts) on low-- liquidity assets, especially Tier 2 securities when TradingView fails to print candles.
⚙️ How to Use It:
1.) Apply the script to any asset or timeframe.
2.) Adjust Volume and Volatility Filters to reduce noise. (Recommended: 500,000+ volume, 10%+ volatility.)
3.) Enable or disable visual components like bands, buffer zones, and halt resumption labels.
4.) Configure alerts directly from the script settings panel.
5.) Apply alerts to individual assets via "Add Alert On..." or to entire watchlists using "Add Alert on the List."
🧩 What Makes This Script Unique?
- True 1-Minute Anchored Calculations: Ensures alerts and visuals match official trading halt criteria regardless of chart timeframe.
- Customisable Buffered Zones: Visualise proximity to regulatory price limits and avoid volatility traps.
- Combines halt resumption detection, limit up/down band visualisation, and real-time alerts into one clean, modular tool.
📚 Disclaimer:
This script is for educational purposes only and does not constitute financial advice. Use at your own discretion and consult a licensed financial advisor before making trading decisions based on it.
Official Resources:
- NASDAQ LULD Regulations (FAQ):
www.nasdaqtrader.com
Current Nasdaq Trading Halts:
www.nasdaqtrader.com
Swing Point Indicator🔍 How does it work?
He looks at a candle and compares it with a number of candles to the left and right.
If that candle is the highest of that group, then it is a swing high.
If that candle is the lowest, then it is a swing low.
📈 What do you use it for?
Reading market structure:
You can easily see higher highs / higher lows (bullish structure)
Or lower highs / lower lows (bearish structure)
Determining BOS & CHoCH:
If a new swing low breaks below the previous one → Break of Structure (BOS)
If you go from HH/HL to LH/LL → Change of Character (CHoCH)
Finding entry and exit points:
You know where to expect price reactions (at swing points)
Good for pullback entries or stop loss placement
Drawing smart zones:
You can draw from swing high to swing low for Fibs, order blocks or S&D zones
*** Translated with www.DeepL.com (free version) ***

GapCluster SR For Intraday by Chaitu50c**GapCluster SR For Intraday by Chaitu50c**
**Overview**
GapCluster SR plots dynamic intraday support and resistance lines based on candle-to-candle gaps. Whenever an Open/Close or High/Low gap is detected, the script draws a horizontal level and “clusters” nearby gaps into a single line to keep your chart clean. Lines automatically color-code relative to price—green when below, red when above.
---
**Key Features**
* **Gap Detection Modes**: Choose between Open/Close gaps (default) or High/Low gaps.
* **Clustering**: Merge levels within a user-defined vertical range to avoid clutter.
* **Dynamic Coloring**: Levels below price turn green; levels above price turn red.
* **Session Reset**: Automatically removes levels older than X days.
* **Fully Customizable**: Adjust buffer, cluster range, line width, lookback period, and both above/below colors.
---
**Inputs**
| Input | Default | Description |
| ---------------------------- | :--------: | ------------------------------------------- |
| Gap Type | Open/Close | Select gap detection method |
| Price Buffer (points) | 5.0 | Maximum distance for gap matching |
| Cluster Range (points) | 100.0 | Vertical distance within which levels merge |
| Line Width | 2 | Thickness of plotted lines |
| Days to Include | 14 | Number of days to retain past levels |
| Color for Levels Above Price | red | Line color when level > current price |
| Color for Levels Below Price | green | Line color when level < current price |
---
**How to Use**
1. **Add to Chart**: Apply on any intraday timeframe (1 min, 5 min, etc.).
2. **Select Mode**: Pick Open/Close or High/Low in settings.
3. **Tweak Inputs**: Raise/lower buffer for tighter/looser gap detection; adjust cluster range to group levels; change lookback (“Days to Include”) to control session reset.
4. **Interpret Levels**:
* **Green Lines** mark potential support zones.
* **Red Lines** mark potential resistance zones.
5. **Combine with Your Strategy**: Use alongside volume, momentum, or trend filters for confirmation.
---
**Tips & Tricks**
* **Intraday Entries**: Look for price reaction at green (support) lines for long setups, or red (resistance) lines for shorts.
* **Filter Noise**: Increase the “Cluster Range” to consolidate many close levels into stronger, singular lines.
---
**Disclaimer**
This indicator is provided “as-is” for educational purposes only. Always backtest any setup and practice proper risk management.

Intraday Fibs RetracementFibonacci (Fibs) levels are often used by traders as a way to find support and resistance, based on the Fibonacci sequence. These levels are widely used in technical analysis to identify potential reversal points in the price of an asset.
Fibs retracement draws lines at these Fibs level between a significant high and low point on a price chart.
What it shows:
This indicator will automatically draw Fibs Retracement Levels on your chart without any manual work.
It is designed to be used for day trading, especially in scenarios where a ticker gaps up/down large compared to the prior day close. (i.e. scenario where the difference of day's open and prior day close is large)
The drawing will happen on each trading day the moment trading hours open, and will NOT draw during pre-market and post-market.
User can see the line of each Fibs level, labelled with the Fib percentage and price value for the corresponding levels.
User will specify a start and end point of Fibs and based on the choice the indicator will automatically compute the other user defined Fibs levels and display on the chart.
How to use it:
The Fib levels drawn can be a potential support and resistance zone. Therefore in scenario where you already have a position and are approaching one of these levels it could be a point to close out some or all the position as you are approaching a resistance. On the other hand when price do approach these levels you could enter a position for a reversal trade. These are few ways to use the indicator but there are other ways that can be used, which can be found out by researching "Fibonacci (Fibs) Retracement".
In the example on the chart you can see a price bounce from the 0.7886 Fibs level on this particular day, where the price gapped up and was coming down after market hours opened.
Key settings:
1. Fibs Retracement Start and end Point: User selects where the Fibs levels should be drawn.
Available Options are:
Start Points:
Market Open
Market Open High (Dependent on the time frame you are on)
Pre-market High
Day's High
End Points:
Previous Day Close
Previous Day Low
Previous Day High
Pre-market Low (Current Day)
Day's Low
2. Custom Fib Levels: User can manually enter the Fib levels they want to see. (Max 9)
Default values are: 0,0.236,0.382,0.5,0.618,0.786,1,1.618,2.618.
3. Display settings: User can specify the line colour, thickness and style.
4. Label Setting: User can choose to turn on/off the labels for the each Fibs Level. Label will show the fib percentage and the corresponding price. User can also choose the location of the labels, defined by an offset from the current candle.
----------------------------------------------------------------------
If anything is not clear please let me know!

Balanced Price Range | Flux Charts💎 GENERAL OVERVIEW
Introducing our new Balanced Price Range (BPR) indicator! A Balanced Price Range is a trading concept used by price action traders. It is detected by finding overlapping area between two contrary Fair Value Gaps (FVGs). These areas can be used as entry points during market pullbacks. For more information about the process, please check the "HOW DOES IT WORK ?" section.
Balanced Price Range Features :
Balanced Price Range Detection : Identifies areas where bullish and bearish FVGs overlap, suggesting a zone of price equilibrium.
Customizable FVG & BPR Detection : You can fine-tune FVG detection and sensitivity for BPR detection to your liking.
Retest Labels : Bullish & Bearish retest labels will be rendered for BPRs.
Alerts : You can set alerts for Bullish & Bearish BPR detection and their retests.
🚩 UNIQUENESS
This indicator doesn't just detect standard FVGs but specifically looks for areas where bullish and bearish IFVGs (Invalidated Fair Value Gaps) overlap, defining a Balanced Price Range. It also actively manages and updates identified BPR zones, removing them when they are invalidated or remain untouched for a specified period. It highlights and alerts users to retests of established BPR zones, signaling potential trading opportunities. Users can tailor the appearance of the BPR zones and retest markers, as well as configure specific alerts for new BPR formations and retests.
📌 HOW DOES IT WORK ?
A Fair Value Gap generally occur when there is an imbalance in the market. They can be detected by specific formations within the chart. The indicator first detects bullish & bearish FVG zones according to their formations on chart. Then, they are dynamically tracked and flagged as invalidated if the price crosses them, turning them into IFVGs. When a FVG & IFVG of the same type overlaps, the indicator combines them into a single BPR of corresponding type. The detected BPR is updated as new data comes in, and renders retests labels as they occur. A bullish BPR can be used to find long trade entry opportunities, while a bearish BPR can be used to find short trade entry opportunities. Retests can also indicate potential movements in the corresponding direction of the BPR. Users can set-up alerts for BPR detection & BPR retests and will get notified as they occur.
⚙️ SETTINGS
Show Historic Zones: If enabled, invalidated or expired BPR zones will remain visible on the chart.
Balanced Price Range:
FVG Detection Method: Determines the criteria for the bar types forming the initial FVG.
Same: All three bars forming the FVG must be of the same type (all bullish or all bearish).
Mixed: The bar types must vary (a mix of bullish and bearish bars).
All: Bar types can vary or be the same.
FVG Invalidation Method: Determines which part of the candle (wick or close) invalidates the initial FVG.
BPR Invalidation Method: Determines which part of the candle (wick or close) invalidates the Balanced Price Range.
Sensitivity: Adjusts the sensitivity of FVG detection. Higher values may identify fewer, larger BPRs, while lower values may detect more, smaller BPRs.
Labels: Toggles the display of text labels on the identified zones.
Retests: Enables or disables the detection and visualization of BPR retests.

The Traders Support & Resistance LevelsThis script automatically detects pivot-based support and resistance levels and draws dynamic trendlines based on recent price action.
🔹 Support & Resistance Levels
Pivot points are calculated using customizable left/right bar logic. A pivot high (or low) is confirmed when leftBars candles to the left and rightBars candles to the right are lower (or higher).
Triangles are plotted when a level is confirmed:
🔻 🟡 Yellow Down Triangle = Confirmed Resistance
🔺 🟣 Purple Up Triangle = Confirmed Support
Lines are drawn at confirmed levels.
If enough lines are confirmed, the oldest one is converted into a zone using a thick, semi-transparent line.
🔹 Trendline Logic
Trendlines are drawn between the last two support points (for uptrend) and last two resistance points (for downtrend).
The slope and price relationship determine trend strength, visualized by color:
Condition Color Meaning
Uptrend + Price Above + Steep 🟨 Yellow Strong Uptrend
Uptrend + Price Above 🔷 Blue Weak Uptrend
Downtrend + Price Below + Steep 💗 Fuchsia Strong Downtrend
Downtrend + Price Below 🟣 Purple Weak Downtrend
Otherwise ⚪️ Gray Neutral / No Trend
⚙️ Customizable Inputs
leftBars, rightBars: Adjust sensitivity of pivot detection
previewBars: Show early "draft" lines before confirmation
volumeThresh: Reserved for future enhancements

BK AK-47 Divergence🚨 Introducing BK AK-47 Divergence — Multi-Timeframe Precision Firepower for True Traders 🚨
After months of development, I’m proud to release my fifth weapon in the arsenal — BK AK-47 Divergence.
💥 Why “AK-47”? The Meaning Behind the Name
The AK-47 isn’t just a rifle. It’s the symbol of reliability, versatility, and raw stopping power. It performs in every environment — from the mud to the mountains — just like this indicator cuts through noise on any timeframe, any asset, any condition.
🔸 “AK” honors the same legacy as before — my mentor, A.K., whose discipline and vision forged my trading edge.
🔸 “47” signifies layered precision: 4 = structure, 7 = spiritual completion. Together, it’s the weapon of divine order that adapts, reacts, and strikes with purpose.
🔍 What Is BK AK-47 Divergence?
It’s a next-generation divergence detector — a smart hybrid of MACD, Bollinger Bands, and multi-timeframe divergence logic wrapped in a custom volatility engine and real-time flash alerts.
Designed for snipers in the market — those who only take the highest-probability shots.
⚙️ Core Weapon Systems
✅ MACD + BB Precision Overlay → MACD plotted inside dynamic Bollinger Bands — reveals hidden pressure zones where most indicators fail.
✅ Smart Histogram Scaling → Adaptive amplification based on volatility. No more weak histograms in strong markets.
✅ Full Multi-Timeframe Divergence Detection:
🔻 Current TF Divergence
🕐 Higher TF Divergence
⏱️ Lower TF Divergence
Each plotted with clean visual alerts, color-coded by direction and timeframe. You get instant divergence recognition across dimensions.
✅ Background Flash Alerts → When MACD hits BB extremes, the background lights up in red or green. Eyes instantly lock in on key moments.
✅ Advanced Pivot Lookback Control → New lookback system compares multiple pivot layers, not just the last swing. This gives true structural divergence, not just noise.
✅ Dynamic Fill Zones:
🔴 Oversold
🟢 Overbought
🔵 Neutral
Built to filter false signals and highlight hidden edge.
🛡️ Why This Indicator Changes the Game
🔹 Built for divergence snipers — not lagging MACD watchers.
🔹 Perfect for traders who sync with:
• Elliott Waves
• Fibonacci Time/Price Clusters
• Harmonic Patterns
• Gann Angles or Squares
• Price Action & Trendlines
🔹 Lets you visually map:
• Converging divergences (multi-TF confirmation)
• High-volatility histograms in low-volatility price zones (entry sweet spots)
• Flash-momentum warnings at BB pressure zones
🎯 How to Use BK AK-47 Divergence
🔹 Breakout Confirmation → MACD breaches upper BB with bullish divergence = signal to ride momentum.
🔹 Mean Reversion Reversals → MACD breaks lower BB + bullish div = setup for sniper long.
🔹 Top/Bottom Detection → Bearish divergence + MACD failure at upper BB = early reversal signal.
🔹 TF Sync Strategy → Align current TF with higher or lower divergences for laser-confirmed entries.
🧠 Final Thoughts
This isn’t just a divergence tool. It’s a battlefield reconnaissance system — one that lets you see when, where, and why the next pivot is forming.
🔹 Built in honor of the AK-legacy — reliability, discipline, and firepower.
🔹 Designed to cut through noise, expose structure, and alert you to what really matters.
🔹 Crafted for those who trade with intent, vision, and respect for the craft.
🙏 And most importantly: All glory to Gd — the One who gives wisdom, clarity, and purpose.
Without Him, the markets are chaos. With Him, we move in structure, order, and divine timing.
—
⚡ Stay dangerous. Stay precise. Stay aligned.
🔥 BK AK-47 Divergence — Locked. Loaded. Laser-focused. 🔥
May the markets bend to your discipline.
Gd bless. 🙏
Order Block Matrix [Alpha Extract]The Order Block Matrix indicator identifies and visualizes key supply and demand zones on your chart, helping traders recognize potential reversal points and high-probability trading setups.
This tool helps traders:
Visualize key order blocks with volume profile histograms showing liquidity distribution.
Identify high-volume price levels where institutional activity occurs.
rank historical order blocks and analyze their strength based on volume.
Receive alerts for potential trading opportunities based on price-block interactions.
🔶 CALCULATION
The indicator processes chart data to identify and analyze order blocks:
Order Block Detection
Inputs:
Price action patterns (consolidation areas followed by breakouts).
Volume data from current and lower timeframes.
User-defined lookback periods and thresholds.
Detection Logic:
Identifies consolidation areas using a dynamic range comparison.
Confirms breakout patterns with percentage threshold validation.
Maps volume distribution across price levels within each order block.
🔶Volume Analysis
Volume Profiling:
Divides each order block into configurable grid segments.
Maps volume distribution across price segments within blocks.
Highlights zones with highest volume concentration.
Strength Assessment:
Calculates total block volume and relative strength metrics.
Compares block volume to historical averages.
Determines probability of reversal based on volume patterns.
isConsolidation(len) =>
high_range = ta.highest(high, len) - ta.lowest(high, len)
low_range = ta.highest(low, len) - ta.lowest(low, len)
avg_range = (high_range + low_range) / 2
current_range = high - low
current_range <= avg_range * (1 + obThreshold)
🔶 DETAILS
Visual Features
Volume Profile Histograms:
Color-coded bars showing volume concentration within order blocks.
Gradient coloring based on relative volume (high volume = brighter colors).
Bull blocks (green/teal) and bear blocks (red) with varying opacity.
Block Visualization:
Dynamic box sizing based on volume concentration.
Optional block borders and background fills.
Volume labels showing total block volume.
Screener Table:
Real-time analysis of order block metrics.
Shows block direction, proximity, retest count, and volume metrics.
Color-coded for quick reference.
Interpretation
High Volume Areas: Zones with institutional interest and potential reversal points.
Block Direction: Bullish blocks typically support price, bearish blocks typically resist price.
Retests: Multiple tests of an order block may strengthen or weaken its influence.
Block Age: Newer blocks often have stronger influence than older ones.
Volume Concentration: Brightest segments within blocks represent the highest volume areas.
🔶 EXAMPLES
The indicator helps identify key trading opportunities:
Bullish Order Blocks
Support Zones: Identify strong support levels where price is likely to bounce.
Breakout Confirmation: Validate breakouts with volume analysis to avoid false moves.
Retest Strategies: Enter trades when price retests a bullish order block with high volume.
Bearish Order Blocks
Resistance Zones: Identify strong resistance levels where price is likely to reverse.
Distribution Areas: Detect zones where smart money is distributing to retail.
Short Opportunities: Find optimal short entry points at high-volume bearish blocks.
Combined Strategies
Order Block Stacking: Multiple aligned blocks create stronger support/resistance zones.
Block Mitigation: When price breaks through a block, it often indicates a strong trend continuation.
Volume Profile Applications: Higher volume segments provide more precise entry and exit points.
🔶 SETTINGS
Customization Options
Order Block Detection:
Consolidation Lookback: Adjust the period for consolidation detection.
Breakout Threshold: Set minimum percentage for breakout confirmation.
Historical Lookback Limit: Control how far back to scan for historical order blocks.
Maximum Order Blocks: Limit the number of visible blocks on the chart.
Visual Style:
Grid Segments: Adjust the number of volume profile segments.
Extend Blocks to Right: Enable/disable extending blocks to current price.
Show Block Borders: Toggle border visibility.
Border Width: Adjust thickness of block borders.
Show Volume Text: Enable/disable volume labels.
Volume Text Position: Control placement of volume labels.
Color Settings:
Bullish High/Low Volume Colors: Customize appearance of bullish blocks.
Bearish High/Low Volume Colors: Customize appearance of bearish blocks.
Border Color: Set color for block outlines.
Background Fill: Adjust color and transparency of block backgrounds.
Volume Text Color: Customize label appearance.
Screener Table:
Show Screener Table: Toggle table visibility.
Table Position: Select positioning on the chart.
Table Size: Adjust display size.
The Order Block Matrix indicator provides traders with powerful insights into market structure, helping to identify key levels where smart money is active and where high-probability trading opportunities may exist.

Rocky's Dynamic DikFat Supply & Demand ZonesDynamic Supply & Demand Zones
Overview
The Dynamic Supply & Demand Zones indicator identifies key supply and demand levels on your chart by detecting pivot highs and lows. It draws customizable boxes around these zones, helping traders visualize areas where price may react. With flexible display options and dynamic box behavior, this tool is designed to assist in identifying potential support and resistance levels for various trading strategies.
Key Features
Pivot-Based Zones: Automatically detects supply (resistance) and demand (support) zones using pivot highs and lows on the chart’s timeframe.
Dynamic Box Sizing: Boxes shrink when price enters them, reflecting reduced zone strength, and stop adjusting once price fully crosses through.
Customizable Display: Choose to show current-day boxes, historical boxes, or all boxes, with an option to update past box colors dynamically.
Session-Based Extension: Boxes can extend to the current bar or stop at 4:00 PM of the creation day’s 9:30 AM–4:00 PM trading session (ideal for stock markets).
Color Coding: Borders change color based on price position:
Green for demand zones (price above the box).
Red for supply zones (price below the box).
White for neutral zones (price inside the box).
User-Friendly Inputs: Adjust pivot lookback periods, box visibility, extension behavior, and colors via intuitive input settings.
How It Works
Zone Detection: The indicator uses pivot highs and lows to define supply and demand zones, plotting boxes between these levels.
Box Behavior:
Boxes are created when pivot highs and lows are confirmed, with no overlap with the previous box.
When price enters a box, it shrinks to reflect interaction, stopping once price exits completely.
Boxes can extend to the current bar or end at 4:00 PM of the creation day (or next trading day if created after 4:00 PM or on weekends).
Display Options:
Current Only: Shows boxes created on the current day.
Historical Only: Shows boxes from previous days, with optional color updates.
All Boxes: Shows all boxes, with an option to hide historical box color updates.
Performance: Limits the number of boxes to 200 to ensure smooth performance, removing older boxes as needed.
Inputs
Pivot Look Right/Left: Set the number of bars (default: 2) to confirm pivot highs and lows.
What Boxes to Show: Select Current Only, Historical Only, or All Boxes (default: Current Only).
Boxes On/Off: Toggle box visibility (default: on).
Extend Boxes to Current Bar: Choose whether boxes extend to the current bar or stop at 4:00 PM (default: off, stops at 4:00 PM).
Update Past Box Colors: Enable/disable color updates for historical boxes (default: on).
Demand/Supply/Neutral Box Color: Customize border colors (default: green, red, white).
How to Use
Add the indicator to your chart.
Adjust inputs to match your trading style (e.g., pivot lookback, box extension, colors).
Use the boxes to identify potential support (demand) and resistance (supply) zones:
Green-bordered boxes (price above) may act as support.
Red-bordered boxes (price below) may act as resistance.
White-bordered boxes (price inside) indicate active price interaction.
Combine with other analysis tools (e.g., trendlines, indicators) to confirm trade setups.
Monitor box shrinking to gauge zone strength and watch for breakouts when price fully crosses a box.
Understanding Supply and Demand in Stock Trading
In stock trading, supply and demand are fundamental forces driving price movements. Demand refers to the willingness of buyers to purchase a stock at a given price, often creating support levels where buying interest prevents further price declines. Supply represents the willingness of sellers to offload a stock, forming resistance levels where selling pressure halts price increases. These zones are critical because they highlight areas where significant buying or selling activity has occurred, influencing future price behavior.
The importance of supply and demand lies in their ability to reveal where institutional traders, with large orders, have entered or exited the market. Demand zones, often seen at pivot lows, indicate strong buying interest and potential areas for price reversals or bounces. Supply zones, typically at pivot highs, signal heavy selling and possible reversal points for downward moves. By identifying these zones, traders can anticipate where price is likely to stall, reverse, or break out, enabling better entry and exit decisions. This indicator visualizes these zones as dynamic boxes, making it easier to spot high-probability trading opportunities while emphasizing the core market dynamics of supply and demand.
Feedback
This indicator is designed to help traders visualize supply and demand zones effectively. If you have suggestions for improvements, please share your feedback in the comments!
0830-0845 High/Low Marker (Accurate Start + History)This indicator marks the high and low of the 15-minute candle between 08:30 and 08:45 (local time) of the trading session. The high and low are tracked dynamically, with the lines drawn once the 08:45 candle closes.
Key Features:
Session-based Tracking: Automatically tracks and records the high and low of the 15-minute period starting at 08:30 and ending at 08:45.
Excludes 08:45 High : If a high is created exactly at 08:45, the indicator will ignore it and use the highest value before 08:45, ensuring it only references the price action during the specified window.
Line Extension : The high and low lines are drawn and extended to the right for a user-defined number of bars, making them visible beyond the session's close.
Customizable Parameters : Adjust the start and end times of the session, line colors, and line width to fit your preferences.
Use Case :
Ideal for traders who focus on the price action during the early part of the trading session (08:30 to 08:45) and want to track significant levels of support and resistance from that period.
The extended lines help identify potential price zones for the rest of the session or the trading day.
Forex Session + Volume Profile [RunRox]📊 Forex Session + Volume Profile is built especially for traders who work with intra-session liquidity concepts or any strategy that needs a clear visual of trading sessions and the liquidity inside them.
Our team created this indicator to give you better session visibility, flexible session styling, and extra tools that help you navigate the market more easily.
📌 Features:
6 fully customizable sessions
Kill Zone (the high-impact trading window)
Volume Profile for each session
POC / VAL / VAH / LVN levels (Point of Control, Value Area Low, Value Area High, Low Volume Node)
PDH / PDL levels (Previous Day High / Low)
PWH / PWL levels (Previous Week High / Low)
NYM level (New York Market level)
Active sessions table
5 style options for each session
All of this gives you the flexibility to set up exactly the layout you need for your trading. Below, you’ll find a more detailed look at each feature.
🗓️ 6 CUSTOMIZABLE SESSION
The indicator includes six sessions that you can fully customize to fit your needs—everything from naming each session and choosing line colors to adjusting opacity, showing the volume profile, or even turning off a session entirely if you don’t need it.
Plus, you can pick different display styles for each session. As shown in the screenshot below, there are five style options you can apply individually to every session.
5 Style Options for Sessions
BOX
AREA
ZONES
LINES
CURVED
These styles can be customized for each session individually to help you highlight the sessions you care about on your chart. Example below
📢 VOLUME PROFILE
We’ve also integrated a Volume Profile into the indicator to pinpoint important levels on the chart. On top of that, we’ve added extra volume-based levels. Below, you’ll find the settings and a visual demo of how it appears on your chart.
To identify optimal entry points, you can use the following key reference levels:
POC (Point of Control)
VAL (Value Area Low)
VAH (Value Area High)
LVN (Low Volume Node)
You can also customize colors and line styles, or hide any levels you don’t need on your chart.
📐 ADDITIONAL LEVELS
You can display the following levels on your chart:
NYM (New York Market)
PDH (Previous Day High)
PDL (Previous Day Low)
PWH (Previous Week High)
PWL (Previous Week Low)
All of these are fully customizable with color selection and the option to extend lines into the next period.
💹 ACTIVE SESSION TABLE
The active sessions table helps you quickly identify the trading times for the sessions you care about. It’s fully customizable, with options to choose border and background colors for the table itself.
🟠 USAGE
This indicator is highly versatile: use it to simply mark trading sessions on your chart, set up the Kill Zone at your chosen time, or identify the context of the previous session by its most traded range levels. All of this makes the indicator an invaluable tool for any trader!

Time-based LiquidityThis indicator automatically marks important time-based liquidity levels on your chart, helping you stay aware of where major price reactions may occur and the market is forced to show its hand.
Key Features:
Previous Month’s, Week’s, and Day’s Highs and Lows: Displays PMH/PML, PWH/PWL, and PDH/PDL — key reference points where liquidity often accumulates.
Intraday Session Highs and Lows: Divides the trading day into quarters (00:00–06:00, 06:00–12:00, etc. following Day’s Quarterly Theory) and tracks session highs and lows dynamically across these periods.
Current Session 90-Minute Quarters: Splits the active session into 90-minute intervals to highlight short-term liquidity structures and potential reaction zones.
Level Alerts: Tracks when each liquidity level is reached and enables customizable alerts so you don’t miss important price movements.
Use Case:
This tool provides an organized, time-based framework for identifying where liquidity is likely to concentrate across different timeframes and intraday cycles. Use these levels for forming bias, planning entries, exits, or anticipating price reactions at key points in the market structure.
Customization Options:
Enable/disable liquidity levels to display (Daily, Weekly, Monthly, Sessions, Session Quarters)
Customize the appearance of each level (color, style, line width)
Enable or disable tracking and alerts for level interactions

LANZ Strategy 2.0🔷 LANZ Strategy 2.0 — London Breakout Confirmation with Structural Swing Protection
LANZ Strategy 2.0 is a structured trading system that leverages the last confirmed market direction before the London session to define directional bias and manage trades based on key structural swing levels. It is tailored for intraday traders looking to capitalize on early London volatility with built-in risk management and visual clarity.
🧠 Core Components:
Directional Confirmation (Pre-London Bias): Validates the last breakout or structural move from the 15-minute timeframe before 02:15 a.m. New York time (start of the London session), establishing the expected market direction.
Time-Based Execution: Executes potential entries strictly at 02:15 a.m. NY time, using market structure to support Long or Short bias.
Dynamic Swing-Based SL System: Allows user to select between three SL protection models: First Swing (most recent structural point) Second Swing (prior level) Total Coverage (includes both swings + extra buffer) This supports flexibility based on trader profile or market conditions.
Visual Risk Mapping: All SL and TP levels are clearly plotted.
End-of-Session Management: Positions are automatically evaluated for closure at 11:45 a.m. NY time. SL, TP, or manual close outcomes are labeled accordingly.
📊 Visual Features:
Labels for 1st and 2nd swing levels upon entry.
Dynamic lines projecting SL/TP levels toward the end of the session.
Session background coloring for Pre-London, Execution, and NY sessions.
Real-time percentage outcome labels (+2.00%, -1.00%, or net % at session end).
Automatic deletion of previous visuals on new entries for clean charting.
⚙️ How It Works:
Detects last structural breakout on the 15m timeframe before 02:15 a.m. NY.
On the 02:15 a.m. candle, executes a Long or Short logic entry.
Plots corresponding SL and TP based on selected swing model.
Monitors price action: If TP or SL is hit, labels it accordingly. If no exit is hit, trade closes manually at 11:45 a.m. NY with net result shown.
Optional logic to reverse entries if market structure breaks before execution.
🔔 Alerts:
Daily execution alert at 02:15 a.m. NY (prompting manual review or action).
Optional alert logic can be extended for SL/TP hits or structure breaks.
📝 Notes:
Designed for semi-automated or discretionary intraday trading.
Best used on Forex pairs or indices with strong London session behavior.
Adjustable parameters include session hours, swing SL type, and buffer settings.
Credits:
Developed by LANZ, this script combines time-based execution with dynamic structure protection, offering a disciplined framework for participating in the London session breakout with clear visuals and risk logic.

TTM Scalper AlertTTM Scalper Alert — Real-Time Pivot Detector
Description:
This is a custom implementation of the classic TTM Scalper Alert, adapted to show early pivot detection and trend structure tracking in real-time. The script identifies potential highs and lows before the full pivot confirmation—giving traders an early edge—and removes outdated signals once pivots are confirmed.
It supports two levels of detection:
Fast Alert Pivots : Identified after Alert Period candles confirm a local reversal.
Confirmed Pivots : Validated only after Pivot Period candles on both sides ensure a true swing high/low.
How It Works:
Fast Detection (Early Pivots):
Detected after Alert Period (AP) candles. These are provisional signals, shown as triangle labels (▲▼) near current price. Only the latest signal is shown; previous fast pivots are deleted to avoid clutter.
Confirmed Pivots:
Detected with a full lookback of Pivot Period (PP) on both sides of the candle. Shown using plotshape with triangle markers (▲▼). Serve as anchors for price structure analysis (HH-HL or LL-LH tracking).
Custom Source Option:
Users can choose to base pivots on High/Low or Close/Open range. Helps adjust sensitivity depending on volatility or bar structure.
How to Interpret:
Trend & Market Structure:
Use Confirmed Pivots (plotshapes) to analyze market structure:
HH → HL: Uptrend
LL → LH: Downtrend
Watch for breaks in structure for possible reversals
Early Alerts:
The floating labels (▲▼) represent early warnings of a potential pivot. Use them to anticipate:
Short-term exhaustion
Quick scalping entries
Divergence setups
Inputs:
Source : Choose from High/Low or Close/Open — affects how pivots are calculated
Alert Period : How fast the script detects an early reversal pattern (used for entry timing)
Pivot Period : How many candles before/after to confirm a full pivot (used for structural analysis)
Best For:
Traders who follow price action and structure
Scalpers and intraday traders who want early signals
Anyone using pivot highs/lows for confluence with other tools (like RSI divergence, Bollinger Bands, VWAP, etc.)
Pro Tips:
Combine this with:
Trend Magic or Supertrend for directional bias
Volume spike filters to confirm reversal intent
RSI/CCI divergence to strengthen reversal pivots
Adjust Alert Period to tune early signal sensitivity (lower = faster but noisier)

Dealing rangeHi all!
This indicator will show you the current dealing range. The concept of dealing range comes from the inner circle trader (ICT) and gives you a range between an established swing high and an established swing low (the length of these pivots can be changed in settings parameter Length and defaults to 5/2 (left/right)). These swing points must have taken out liquidity to be considered "established". The liquidity that must be grabbed by the swing point has to be a pivot of left length of 1 and a right length of 1.
The dealing range that's created should be used in conjunction with market structure. This could be done through scripts (maybe the Market structure script that I published ()) or manually. It's a common approach to look for long opportunities when the trend is bullish and price is currently in the discount zone of the dealing range. If the trend is bearish then short opportunities are presented when the price is currently in the premium zone of the dealing range.
The zones within the dealing range are premium and discount that are split on the 50% level of the dealing range. These zones can be split into 3 zone with a Fair price (also called Fair value ) zone in between premium and discount. This makes the premium zone to be in the upper third of the dealing range, fair price in the middle third and discount in the lower third. This can be enabled in the settings through the Fair price parameter.
Enabled:
You can choose to enable/disable the visualisation of liquidity grabs and the External liquidity available above and below the swing points that created the dealing range.
Enabled:
Disabled:
Enabled on a higher timeframe (will display a box of the liquidity grab price instead of a label):
This dealing range is configurable to be created by a higher timeframe then the visible charts. Use the setting Higher timeframe to change this.
You can force candles to be closed (for liquidity and swing points). Please note that if you use a higher timeframe then the visible charts the candles must be closed on this timeframe.
Lastly you can also change the transparency of liquidity grabs and external liquidity outside of the dealing range. Use the Transparency setting to change this (a lower value will lead to stronger visuals).
If you have any input or suggestions on future features or bugs, don't hesitate to let me know!
Best of trading luck!

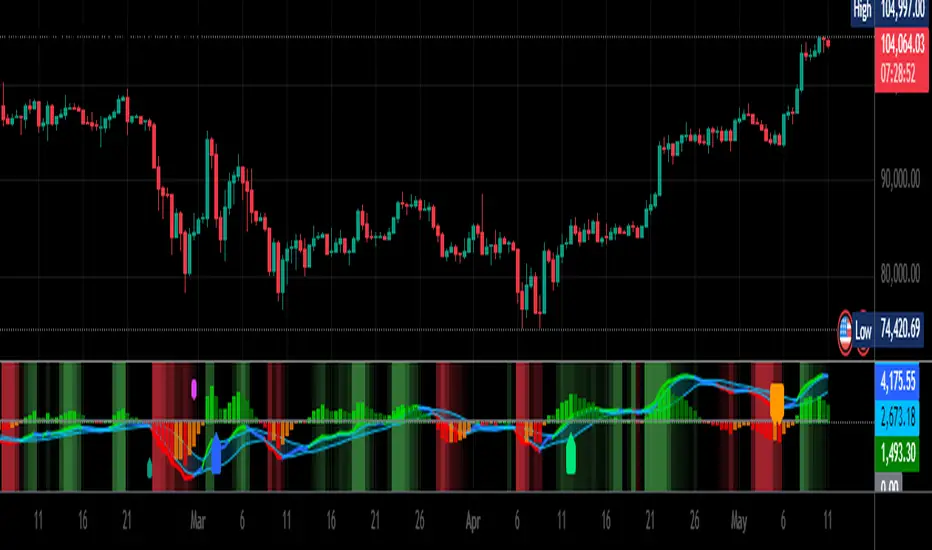
Volumetric Pivot Echo🔮 Volumetric Pivot Echo (VPE)
Future Price Projection Zones with Confidence Scoring
📘 Overview
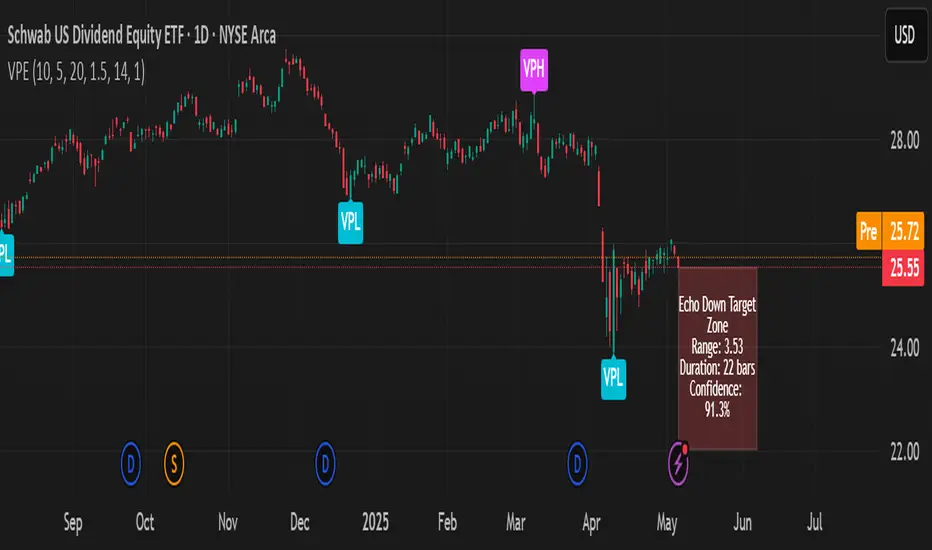
The Volumetric Pivot Echo (VPE) is a next-generation leading indicator that identifies high-volume reversal points and echoes their price + time behavior into the future — giving you a visual forecast box that includes a confidence score, price range, and duration estimate.
It’s designed for swing and options traders who want forward guidance based on real structure, not just reactive signals.
⚙️ How It Works
Pivot Detection – Finds pivot highs/lows based on configurable bar structure.
Volume Confirmation – Only confirms pivots backed by strong volume (e.g., 1.5× average).
Echo Logic – Measures the price move and time it took to reach the pivot.
ATR Scaling – Adjusts projections based on current market volatility.
Confidence Score – Rates each projection (0–100%) based on structure match, volatility, and direction alignment.
📦 What Appears on Chart
Projection Box:
A forward-drawn rectangle from the current bar to the estimated future zone. The box's size and duration mirror the last valid momentum leg.
Box Label Text:
🔹 Range (projected move size)
⏱️ Duration (bars expected)
✅ Confidence %
VPH/VPL Markers:
Pivot highs and lows confirmed by volume, marked with “VPH” or “VPL”.
🎯 How to Trade with It
Use the box as a target zone for directional trades.
If price enters a box with >85% confidence, consider it a high-quality path projection.
Use with support/resistance confluence or entry systems.
Works especially well for swing trading, breakout setups, or options targeting.
🛠️ Recommended Settings
Box Transparency: Set Projection Up/Down Color to 90 (10% visible).
Text Color: Set to white for readability.
Volume Multiplier: Default 1.5x, increase in choppy markets.
Projection Duration: Start with 1.0x echo multiplier and fine-tune.
⏳ Timeframes & Accuracy
Timeframe Confidence Zones Most Reliable
15m – 1h Use 70–85% confidence scores
1h – 4h Sweet spot for balanced signals
1D – 1W Strongest historical echo tracking (>85% ideal)
✅ Key Features
Forward-looking, non-repainting logic
Clear visual projections — no guesswork
Confidence scoring built-in
ATR-adjusted — adapts to volatility
Works on any asset (stocks, crypto, FX)
🧠 Why It’s Unique
This is not a lagging oscillator or classic trend-following tool.
It’s a leading structure projection model — combining pivot behavior, volume intensity, and market volatility to sketch forward “echo zones” based on the past.
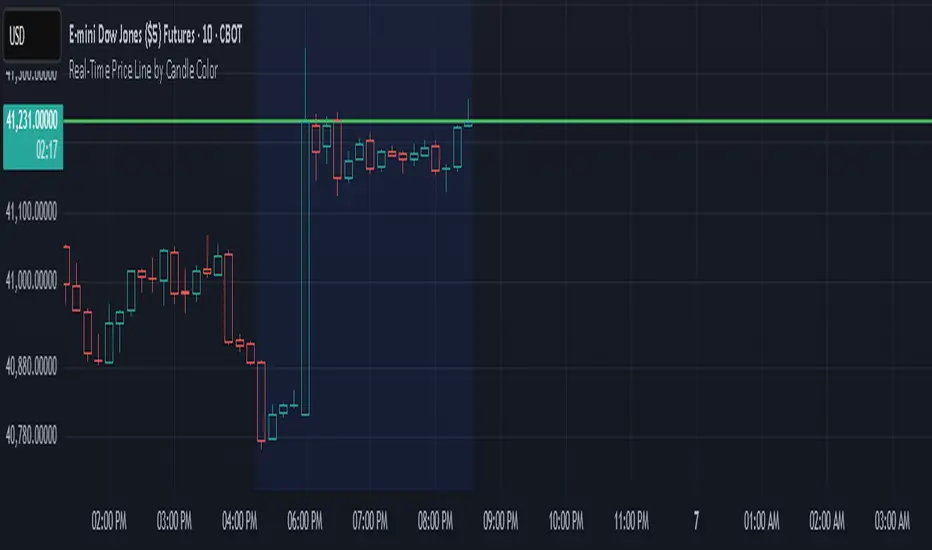
Real-Time Price Line by Candle ColorThis indicator draws a horizontal line at the current price that updates in real time on each candle. The line:
Extends infinitely left and right
Changes color based on the current candle:
🟢 Green if the candle is bullish (close ≥ open)
🔴 Red if the candle is bearish (close < open)
Automatically clears and redraws each bar to reflect the latest price and direction
Use this as a simple but effective visual aid to track the live price and its directional bias.