Pivot Points with Slopes - By Necromancer█ OVERVIEW
- This script draws array-based Pivot Points with the calculated slope on the next connecting point.
- The script works left to right, but could be be modified.
- Looks best with Label-Style on Diamonds, without Slope Text drawn.
█ Thank You!
- Many more to come which will utilize these fundamentals!
🅝🅔🅒🅡🅞🅜🅐🅝🅒🅔🅡
Pivot
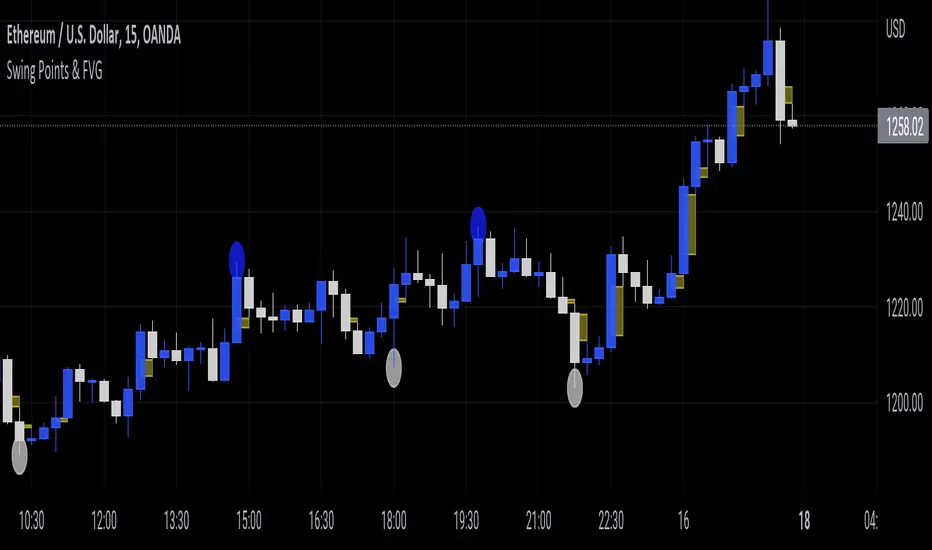
Swing Points & FVGClassic ITH/ITL
Intermediate Term High - High that has short term high on either of it's side.
Intermediate Term Low - Low that has short term low on either of it's side.
FVG
The indicator also marks Fair Value Gaps which is a very important concept in price action trading. FVGs are formed when there is ineffeciency,or imbalance, in the market.
Rebalanced ITH/ITL
Rebalanced ITH - A short term high that rebalanced the ineffeciency in price can be considered as an Intermediate Term High.
Rebalanced ITL - A short term low that rebalanced the ineffeciency in price can be considered as an Intermediate Term Low.
Use the ITH and ITL points marked by the indicator to determine the structure of the market.
Indicator repaints only when it tries to identify the latest ITH/ITL.
Autodrawn Pivot Levels IndicatorAn experiment with pinescript's line.new() function. The Autodrawn Pivot Levels indicator draws horizontal lines in areas where prices have been flat, which serve as pivot points. This can be useful for pivot trading as it visually shows several critical levels
Market Structure Patterns (Nephew_Sam_)This market structure indicator plots HH/LL labels with a little twist - it can identify upto 14 custom patterns of your choice!
Indicator settings:
Pivot strength - highest or lowest point in a number of x left+right bars
Show - show zigzag lines, HHLL labels, Pattern Matches
Patterns - upto 14 patterns (7 bear, 7 bull) with custom label text
Styles - for labels and lines
Disclaimer
- Although 90% of this indicator is custom coded, I have to give credits to LonesomeTheBlue (www.tradingview.com) for his "Double Zig Zag with HHLL" indicator where I got the logic on how to plot the labels in real time.
- This indicator repaints labels in realtime (not historical candle)

Support and Resistance Multiperiod (Zig Zag Based)Support and Resistance Multiperiod (Zig Zag Based)
What is the indicator?
• The indicator is a multi period (up to 5 lengths) Support and Resistance indicator calculated based on Zig Zag.
Who can use?
Scalpers to Long term investors
What timeframe to use?
• Any timeframe
What are the lines?
• Green lines are Support levels.
• Orange lines are Resistance levels.
How to use?
• Buy Low and Sell High.
• Brighter zones means strong Support or Resistance.
• Weaker zones appear lighter.
• Brighter zones are formed by overlapping of lines from multiple levels of support or resistance.
Indicator Menu
• The indicator can input 5 different Lengths.
• The default settings uses 13, 21, 52, 100 & 200.
• Every option are customizable.

ATRvsDTR + ADR Zone + SSS50%This Script is to be used for intra day as far as the adr zones. The adr zones are used as support and resistance but also can be used to determine whether the stock is breaking out or not. Also being that the adr zones are calculated using a 5 or 10 day period unless you change the settings, and are set when price opens. It does really help you know whether a stock is moving more than it does on average to me it just signifies its directional. So I added the atr vs dtr so you can see what a stock moves on average versus what it has moved today.
The atr period is calculated based on the daily period unless you change the settings. I added to the original script 3 more percentages the atr vs dtr will change as it goes higher so that you can be aware when the stock is getting closer to moving 100% of its atr. Even though a stock breaks above or below the adr that doesn't mean it has moved more than it normally moves.
I also have the weekly open on the script as I trade the strat and I want to know, at what price the the week will change from bearish to bullish and vice versa. So that I can understand the trend when I am trading intraday.
The 50% lines were added for Sara strat snipers 50% rule and you can change the timeframes on them. This is used to know whether a candle will go 3. This also can help with retracements vs reversals, because in traditional technical analysis 50% is around where people start think its a reversal more so than a retracement.
I believe the script will be very help as it can show you price being directional but can also let you know when the stock is getting close to moving more than it normally has or if it has moved more than it normally has. As well as being able to see if something is a retracement vs a reversal. I trade TheStrat strategy so this can be very helpful in that regard
The 50% retracement levels are default 1h and daily. You can change them and whether or not they show
In the example chart you can see we are below weekly open which is bearish and you can also see where price reverses out of the upper adr zone. As well as how much of the atr we have moved on this day in time.

Pivot Points Standard Higher Timeframe█ OVERVIEW
This indicator was intended as educational purpose only and alternative way to write pine script in version 5 for Pivot Points Standard.
█ CREDITS
Credits to TradingView for original built-in source code.
█ FEATURES
Display price or percentage.
Change color for labels and lines.
█ USAGE EXAMPLES

Relative Strength Index - Divergences - LibertusHello all,
To ease everyone's trading experience I made this script which colors RSI overbought and oversold conditions and as a bonus displays bullish or bearish divergences in last 50 candles (by default, you can change it).
Script is open source, part of code is from Trading View examples. If you have suggestions or you already made some improvements, please report in comment.
Happy trading and good luck!

Camarilla PivotsA slimmed down/cleaner version of the "Pivot Points Standard" indicator. This is for Camarilla pivots only. The S and R pivots are renamed to L/H and the colors of pivot 1 and 2 are faded out by default since those pivots are less used in the Camarilla trading system. They can also be disabled of course.

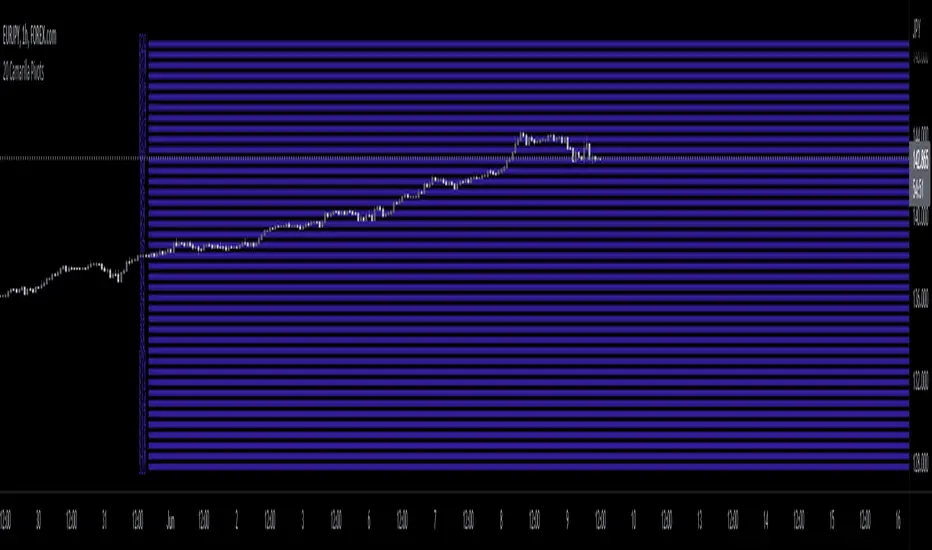
20 Camarilla Pivot PointsThis indicator plots 20 Camarilla pivot points above and below the pivot based on the selected time frame. This is useful when price goes between the standard 3 and 4 pivots and above 4. Note that the normal 4 pivot point is labeled as 6 in this indicator. You can change the color of each set of pivots so you can mark the standard Camarilla pivots if you wish. The image is using monthly Camarilla pivots on a 1 hour time frame.
Volume Profile, Pivot Anchored by DGTVolume Profile (also known as Price by Volume ) is an charting study that displays trading activity over a specified time period at specific price levels. It is plotted as a horizontal histogram on the finacial isntrumnet's chart that highlights the trader's interest at specific price levels. Specified time period with Pivots Anchored Volume Profile is determined by the Pivot Levels, where the Pivot Points High Low indicator is used and presented with this Custom indicator
Finally, Volume Weighted Colored Bars indicator is presneted with the study
Different perspective of Volume Profile applications;
Anchored to Session, Week, Month etc : Anchored-Volume-Profile
Custom Range, Interactive : Volume-Profile-Custom-Range
Fixed Range with Volume Indicator : Volume-Profile-Fixed-Range
Combined with Support and Resistance Indicator : Price-Action-Support-Resistance and Volume-Profile
Combined with Supply and Demand Zones, Interactive : Supply-Demand-and-Equilibrium-Zones
Disclaimer : Trading success is all about following your trading strategy and the indicators should fit within your trading strategy, and not to be traded upon solely
The script is for informational and educational purposes only. Use of the script does not constitutes professional and/or financial advice. You alone the sole responsibility of evaluating the script output and risks associated with the use of the script. In exchange for using the script, you agree not to hold dgtrd TradingView user liable for any possible claim for damages arising from any decision you make based on use of the script

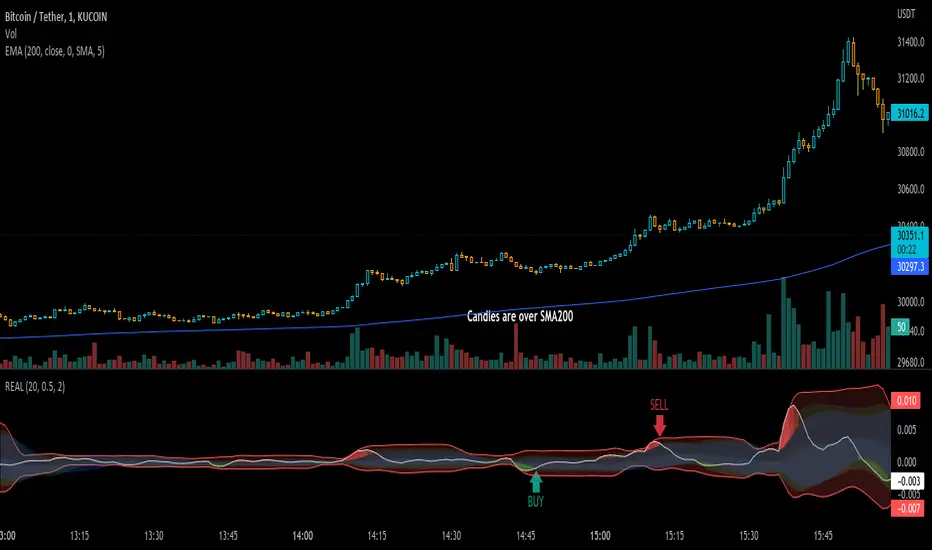
Real IndicatorReal indicator is an indicator to convert ohlcv charts to one oscilator!
there is an effective thing in all charts: "Volume", and I used this thing to mix it by price
Buy: on crossing above to Bollinger-lower-band (on Up-trends)
Sell: on crossing under Bollinger-upper-band (on Down-Trends)
use an SMA-200 to determine trends ;)
Heikin Ashi OscillatorThis indicator plots a delta between the Heiken Ashi close price and the regular candlestick closing price as a histogram, which allows you to quickly analyse changes in trend
direction.
It also provides a reverse-engineered closing price for regular candlesticks, to reach in order to maintain the momentum, which allows you to be forewarned of potential pivot points to change in bias in direction.
Feel free to use this indicator to modify and add to your charts as you wish.

fontilabLibrary "fontilab"
Provides function's indicators for pivot - trend - resistance.
pivots(src, lenght, isHigh) Detecting pivot points (and returning price + bar index.
Parameters:
src : The chart we analyse.
lenght : Used for the calcul.
isHigh : lookging for high if true, low otherwise.
Returns: The bar index and the price of the pivot.
calcDevThreshold(tresholdMultiplier, closePrice) Calculate deviation threshold for identifying major swings.
Parameters:
tresholdMultiplier : Usefull to equilibrate the calculate.
closePrice : Close price of the chart wanted.
Returns: The deviation threshold.
calcDev(basePrice, price) Custom function for calculating price deviation for validating large moves.
Parameters:
basePrice : The reference price.
price : The price tested.
Returns: The deviation.
pivotFoundWithLines(dev, isHigh, index, price, dev_threshold, isHighLast, pLast, iLast, lineLast) Detecting pivots that meet our deviation criteria.
Parameters:
dev : The deviation wanted.
isHigh : The type of pivot tested (high or low).
index : The Index of the pivot tested.
price : The chart price wanted.
dev_threshold : The deviation treshold.
isHighLast : The type of last pivot.
pLast : The pivot price last.
iLast : Index of the last pivot.
lineLast : The lst line.
Returns: The Line and bool is pivot High.
getDeviationPivots(thresholdMultiplier, depth, lineLast, isHighLast, iLast, pLast, deleteLines, closePrice, highPrice, lowPrice) Get pivot that meet our deviation criteria.
Parameters:
thresholdMultiplier : The treshold multiplier.
depth : The depth to calculate pivot.
lineLast : The last line.
isHighLast : The type of last pivot
iLast : Index of the last pivot.
pLast : The pivot price last.
deleteLines : If the line are draw or not.
closePrice : The chart close price.
highPrice : The chart high price.
lowPrice : The chart low price.
Returns: All pivot the informations.
getElIntArrayFromEnd() Get the last element of an int array.
getElFloatArrayFromEnd() Get the last element of an float array.
getElBoolArrayFromEnd() Get the last element of a bool array.
isTrendContinuation(isTrendUp, arrayBounds, lastPrice, precision) Check if last price is between bounds array.
Parameters:
isTrendUp : Is actual trend up.
arrayBounds : The trend array.
lastPrice : The pivot Price that just be found.
precision : The percent we add to actual bounds to validate a move.
Returns: na if price is between bounds, true if continuation, false if not.
getTrendPivots(trendBarIndexes, trendPrices, trendPricesIsHigh, interBarIndexes, interPrices, interPricesIsHigh, isTrendHesitate, isTrendUp, trendPrecision, pLast, iLast, isHighLast) Function to update array and trend related to pivot trend interpretation.
Parameters:
trendBarIndexes : The array trend bar index.
trendPrices : The array trend price.
trendPricesIsHigh : The array trend is high.
interBarIndexes : The array inter bar index.
interPrices : The array inter price.
interPricesIsHigh : The array inter ishigh.
isTrendHesitate : The actual status of is trend hesitate.
isTrendUp : The actual status of is trend up.
trendPrecision : The var precision to add in "iscontinuation" function.
pLast : The last pivot price.
iLast : The last pivot bar index.
isHighLast : The last pivot "isHigh".
Returns: trend & inter arrays, is trend hesitate, is trend up.
drawBoundLines(startIndex, startPrice, endIndex, endPrice, breakingPivotIndex, breakingPivotPrice, isTrendUp) Draw bounds and breaking line of the trend.
Parameters:
startIndex : Index of the first bound line.
startPrice : Price of first bound line.
endIndex : Index of second bound line.
endPrice : price of second bound line.
breakingPivotIndex : The breaking line index.
breakingPivotPrice : The breaking line price.
isTrendUp : The actual status of the trend.
Returns: The lines bounds and breaking line.

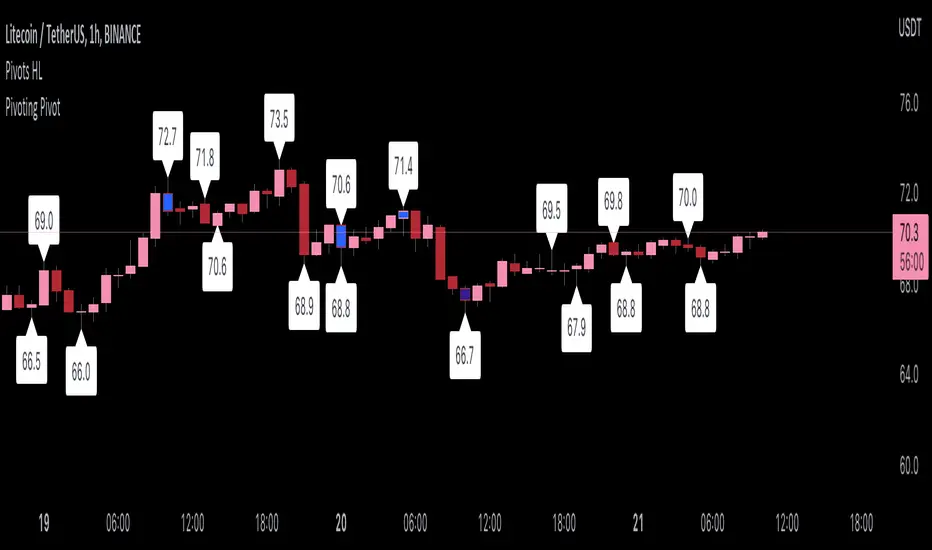
Pivoting PivotMany people use Pivots when conducting analysis, but I don't see many people using pivoting pivots. Pivoting pivots are pivots that don't have any other pivots around them. They can be useful when trying to separate pivot clusters from important pivot points.
The code is calculated by finding the distance between two candlesticks (left check), then calculating the distance between the last pivot and the current candlestick.
On the chart: labels are TradingView's official pivot high and pivot low script, and the blue candle color is my pivoting pivots (both with a look left and look right of 2).
Special thanks to @fikira for helping me with ideas for the calculations!
PivotThis library was designed to create three different datasets using Bill Williams fractals. The goal is to spot trends in reversal data and ultimately use these datasets to help predict future price reversals.
First, the pivot() function is used to initialize and populate three separate arrays (high pivot , low pivot , all pivots ). Since each high/low price depends on the bar_index, the bar_index, pivot direction(high/low), and high/low values are compressed into a string to maintain the data's integrity ("__"). Once each string array is populated and organized by bar_index, all three are returned inside a tuple. The return value must be deconstructed H,L,A =pivot() for each array's values to be accessed using getPivot() . This boilerplate allows for data to be accessed more efficiently in a recursive environment. getPivot() was designed to be used inside of a for or while block to populate matrices for further analyses. Again, getPivot() return values must be exposed through deconstruction. x,d,y =getPivot(). See code for more details.
pivot(int XLR) initializes and populates arrays
Parameters
XLR - number of bars to the left and right that must be lower for a high to be considered a pivotHigh, or vice versa. This number will drastically change the size and scope of the returned datasets. smaller values will produce much larger datasets, which might model short term price activity well. In contrast, larger values will produce smaller datasets which might model longer term price activity well.
Returns - tuple [string ]
getPivot(string arrayID, int index) accesses array data
Parameters
arrayID - the variable name for one of the three arrays returned by pivot().
index - the index of the provided array, with 0 being the most recent pivot point. can be set to " i " in a loop to access values recursively
Returns - tuple

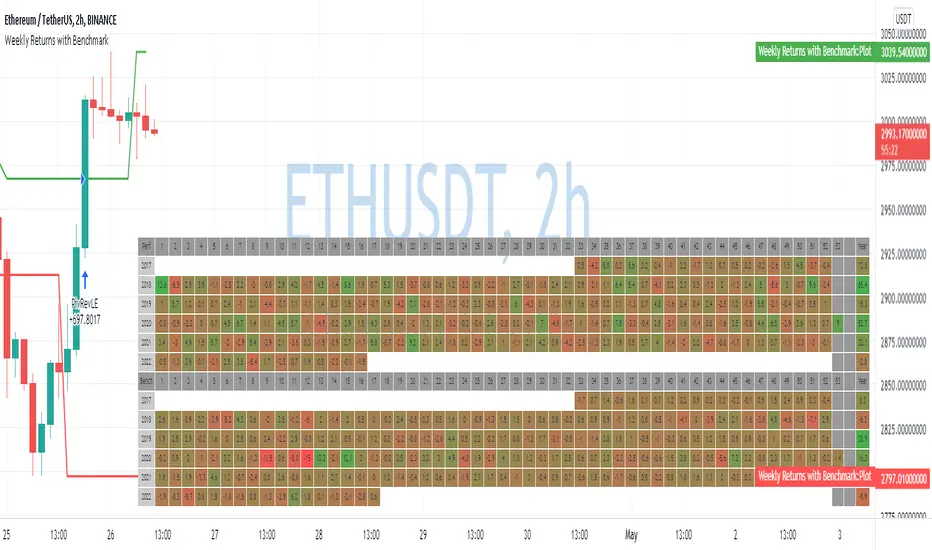
Weekly Returns with BenchmarkSome time ago I published Monthly returns table. Now It's time for weekly one.
To get it work you need a pretty big screen, but I hope it will be useful for some of you.
Features of this table includes:
Display weekly returns of your strategy, benchmark, and alpha over this benchmark.
Select benchmark to be another instrument
Select the date from which you want to compute monthly returns
Show/hide benchmark and alpha
Choose colors for gradient for gain/loss values
Use it with any type of strategy
Use it with replay
Thanks to @MUQWISHI to help me coding it.
It's not about the strategy itself but the way you display returns on your chart. So pls don't critique my choice of the strategy and its performance 🙂
Disclaimer
Please remember that past performance may not be indicative of future results.
Due to various factors, including changing market conditions, the strategy may no longer perform as well as in historical backtesting.
This post and the script don’t provide any financial advice.
Vector Flow ChannelA decay channel that allows multi stage setup for timed events.
update to V5:
and

3EMA + Boullinger + PIVOTTRES EMAS + BANDAS DE BOLLINGER + PIVOTE
INDICADOR 1: TRES EMAS (MEDIA MOVIL EXPONENCIAL)
Con este indicador puede visualizar el promedio de precios con mayor peso a los datos mas recientes.
Se calculan y dibujan tres medias móviles exponenciales: 8, 20 y 200 últimas velas.
-Rápida EMA1 = 8
-Media EMA2 = 20
-Lenta EMA 3 = 200
INDICADOR 2: BANDAS DE BOLLINGER
Con este indicador podrá ver la fuerza y la tendencia del mercado, es decir la mide la volatilidad del precio del activo.
Si el precio sobrepasa la banda superior, el activo está sobrecomprado.
Si el precio sobrepasa la banda inferior, el activo está sobrevendido.
Longitud tendencia - BASE = 20, paso = 1
Desviación Estándar - Multiplicador = 2, paso = 0.2
INDICADOR 3: PIVOTE
Este indicador etiqueta los puntos donde el precio es mínimo y máximo, en un rango de velas determinado en el parámetro "Distancia para el Pivote".
Estos 3 indicadores sirven para todo tipo de activos: FOREX, CRIPTO, CFD´s, ETC.
------------------------------------------------------------------------------------------------------------------
THREE EMAS + BOLLINGER BANDS + PIVOT
INDICATOR 1: THREE EMAS ( EXPONENTIAL MOVING AVERAGE )
With this indicator you can visualize the average of prices with greater weight to the most recent data.
Three exponential moving averages are calculated and drawn: 4, 20 and 200 last candles.
-Fast EMA1 = 8
-Average EMA2 = 20
-Slow EMA 3 = 200
INDICATOR 2: BOLLINGER BANDS
With this indicator you can see the strength and trend of the market, that is, it is measured by the volatility of the asset price.
If the price goes above the upper band, the asset is overbought.
If the price goes above the lower band, the asset is oversold.
Trend length - BASE = 20, step = 1
Standard Deviation - Multiplier = 2, step = 0.2
INDICATOR 3: PIVOT
This indicator labels the points where the price is minimum and maximum, in a range of candles determined in the parameter "Distance to Pivot".
These 3 indicators are used for all types of assets: FOREX, CRYPT, CFD's, ETC.

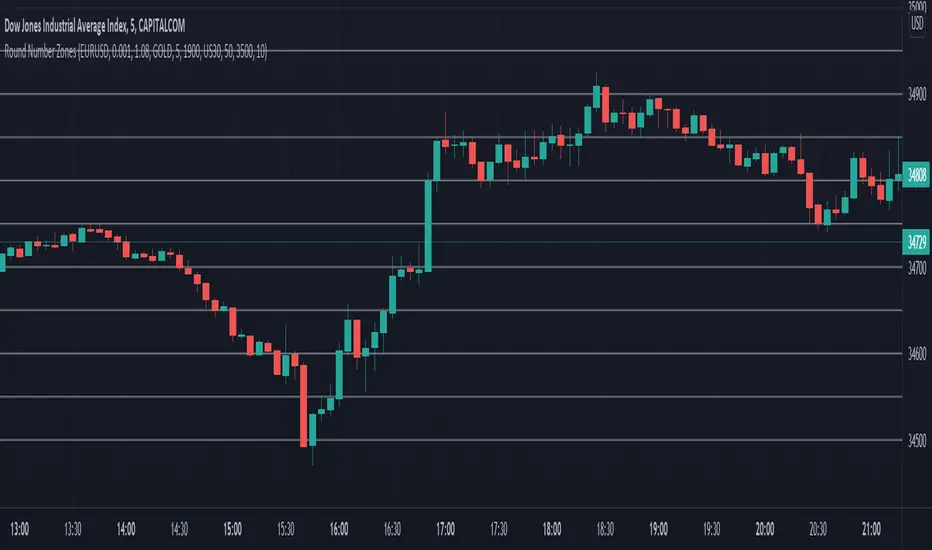
Round Number ZonesThis indicator shows zones of round numbers for 3 custom symbols like US30, EURUSD or GOLD as lines in the chart. The starting price can also be the current or a custom one and you can configure the increments as well. CAPITALCOM:US30
Pivot Order Blocks// How it Works \\
Order Blocks based on pivot reversal candle
When a pivot High or Pivot Low is found and confirmed, a box will be plotted on the open and close values of that pivot candle
// Settings \\
In the settings you have the ability to change the distances required to confirm an pivot High or Low
These are the lengths where the script checks to see if it is at its local high or low.
You also have the ability to change the amount of candles the box stretches over as well as the colors of the bullish and bearish boxes
// Use Case \\
Pivot points often provide Support and Resistance points on their own,
one way of marking up order blocks is by taking the pivot candle and marking that up as a resistance area where you could be looking for price to reverse
// Suggestions \\
Happy for anyone to make any suggestions on changes which could improve the script,
// Terms \\
Feel free to use the script, If you do use the script could you please just tag me as I am interested to see how people are using it. Good Luck!

MTF Pivots Zones [tanayroy]Dear Fellow Traders,
I only publish scripts that I use and found good for my trading. Pivots are my favorite indicator. I use daily, weekly, monthly, quarterly, and yearly pivots levels. multiple pivot zones are very strong levels and I like to watch these levels for possible price action.
But when I include all pivots levels at a time, my charts get too clumsy. To see price action properly, you need a clean chart. And when we trade we want to see only important levels within the price horizon.
To resolve this, I created this script, which shows important levels within my display option. I control the display option with 14 periods ATR and a multiplier to adjust the display levels.
The following chart displays levels within 14 ATR * 0.5 multipliers. As the price progress, it will automatically add levels and delete levels that do not come within this option.
What levels are included?
I have used traditional pivot calculation and included Daily, Weekly, Monthly, Quarterly, and Yearly pivots with high and low.
What options are available?
You can replace the yearly timeframe with your desired time frame and can adjust the ATR multiplier to increase or decrease display levels.
Use this in 5m, 15m, or 1H chart or any timeframe below Daily.
Please like, share, and comment.

OscillatorPivotsLibrary "OscillatorPivots"
Measures pivots in an oscillator and flags if they are above a configurable size. Uses absolute size rather than just highest/lowest in a candle range.
f_osc_Pivots()
Uses the total change in the Y axis, instead of a simple Williams pivot over a defined number of bars. In other words, it measures the size of the actual pivot, not just whether it happens to be the highest/lowest value in a range.
Measures the absolute, cumulative change both before and after the pivot, to avoid flagging mere kinks in trends.
The advantage is that absolute pivot size is, in some cases, precisely what we care about. A disadvantage is that it can take an arbitrary, perhaps long, time to confirm.
You can configure the threshold size of the pivot so that it finds large or small pivots.
Always returns a pivot high after a pivot low, then another pivot high and so on, in order. It never returns a high followed by a high, which simple indicators based on the ta.pivot() function can do.
@param chart_H_1 This must always be set to 1, unless you are using my HighTimeframeTiming library, in which case set it to the output of the function for a _HTF_H of 1.
@param chart_H_2 This must always be set to 2, unless you are using my HighTimeframeTiming library, in which case set it to the output of the function for a _HTF_H of 2.
@param _osc This is the oscillator float value.
@param _oscPivotSize This is the user setting for what counts as a big enough change to be a pivot.
@returns Information about the pivot that is likely to be useful in further calculations:
confirmPeak, confirmDip - whether the pivot was confirmed this bar
peakBarsBack, dipBarsBack - how many bars ago the actual peak or dip was
peakPrice, dipPrice - the value of the oscillator at the peak/dip
It also returns some internal variables, which are plotted in this library only for an understanding of how the function works.
debug_peakStartLevel, debug_dipStartLevel - The level of the currently active peak/dip
