NY Session Range Box with Labeled Time MarkersShows opening time ny session by timing with lines to inform traders to avoid 11:30am to 1:30pm for choppy sessions and mark early and power hour .
Narzędzia Pine

USDJPY MA Zone Entry Strategy USD/JPY tested only.A consistent strategy that gives me alerts each time my conditions are met. I am a funded prop firm trader. this strategy gives 45-70% annual returns. the sequence for this strategy is: After 4 stop loss hits, place a trade on the NEXT ENTRY ALERT ONCE: (-.188) pips draw back towards the stop loss. (this turns the Strat from 1-3 RISK/REWARD to 1-7+ RISK/REWARD). keep the Stop Loss the same (-.300) away from your entry. Take Profit placed at (+1.488) from entry. if 3 losses in a row happens AFTER you've followed these instructions, don't trade again UNTIL the strategy has a TAKE PROFIT gain, then the sequence starts over again. that is this strategies losing streak. after that streak is over. the strategy will be back to give you profits.

Colocar Ordens Fácil!This eases the process of creating limit orders on Trading View, when using the smarphone.
For that, the user inputs the given price range, the desired fibonacci entry level, and trade direction. The tools gives visual snap-to objects that can be used to lock long/short position tools, from which the option "create limit order" can be used to directly create the orders.


Previous Day & Week High/Low LevelsPrevious Day & Week High/Low Levels is a precision tool designed to help traders easily identify the most relevant price levels that often act as strong support or resistance areas in the market. It automatically plots the previous day’s and week’s highs and lows, as well as the current day’s developing internal high and low. These levels are crucial reference points for intraday, swing, and even position traders who rely on price action and liquidity behavior.
Key Features
Previous Day High/Low:
The indicator automatically draws horizontal lines marking the highest and lowest prices from the previous trading day.
These levels are widely recognized as potential zones where the market may react again — either rejecting or breaking through them.
Previous Week High/Low:
The script also tracks and displays the high and low from the last completed trading week.
Weekly levels tend to represent stronger liquidity pools and broader institutional zones, which makes them especially important when aligning higher timeframe context with lower timeframe entries.
Internal Daily High/Low (Real-Time Tracking):
While the day progresses, the indicator dynamically updates the current day’s internal high and low.
This allows traders to visualize developing market structure, identify intraday ranges, and anticipate potential breakouts or liquidity sweeps.
Multi-Timeframe Consistency:
All levels — daily and weekly — remain visible across any chart timeframe, from 1 minute to 1 day or higher.
This ensures traders can maintain perspective and avoid losing track of key zones when switching views.
Customizable Visuals:
The colors, line thickness, and label visibility can be easily adjusted to match personal charting preferences.
This makes the indicator adaptable to any trading style or layout, whether minimalistic or detailed.
How to Use
Identify Key Reaction Zones:
Observe how price interacts with the previous day and week levels. Rejections, consolidations, or clean breakouts around these lines often signal strong liquidity areas or potential directional moves.
Combine with Market Structure or Liquidity Concepts:
The indicator works perfectly with supply and demand analysis, liquidity sweeps, order block strategies, or simply classic support/resistance techniques.
Scalping and Intraday Trading:
On lower timeframes (1m–15m), the daily levels help identify intraday turning points.
On higher timeframes (1h–4h or daily), the weekly levels provide broader context and directional bias.
Risk Management and Planning:
Using these levels as reference points allows for more precise stop placement, target setting, and overall trade management.
Why This Indicator Helps
Markets often react strongly around previous highs and lows because these zones contain trapped liquidity, pending orders, or institutional decision points.
By having these areas automatically mapped out, traders gain a clear and objective view of where price is likely to respond — without needing to manually draw lines every day or week.
Whether you’re a beginner still learning about price structure, or an advanced trader refining entries within liquidity zones, this tool simplifies the process and keeps your charts clean, consistent, and data-driven.

Smart Weekly Lines — Clean & Scroll-Proof (Pine v6)Because your chart deserves structure. Elegant weekly dividers that stay aligned, scroll smoothly, and project future weeks using your wished UTC offset.
Smart Weekly Lines draws precise, full-height vertical lines marking each new week — perfectly aligned to your local UTC offset. It stays clean, smooth, and consistent no matter how far you scroll.
Features
• Accurate weekly boundaries based on your local UTC offset (supports half-hour zones like India +5.5)
• Clean, full-height lines that never cut off with zoom or scroll
• Adjustable color, opacity, width, and style (solid, dashed, dotted)
• Future week projection for planning and alignment
• Optional visibility: show only on Daily and Intraday charts
Works with any market — stocks, crypto, forex, or futures.
Built for traders who value clarity, structure, and precision.
Developed collaboratively with the assistance of ChatGPT under my direction and testing.

USCBBS-WDTGAL-RRPONTSYDThis is the U.S. Financial Market Net Liquidity.
The calculation method is to subtract the U.S. Treasury General Account balance (WDTGAL) and then the Overnight Reverse Repo balance (RRPONTSYD) from the Federal Reserve's balance sheet total (USCBBS).


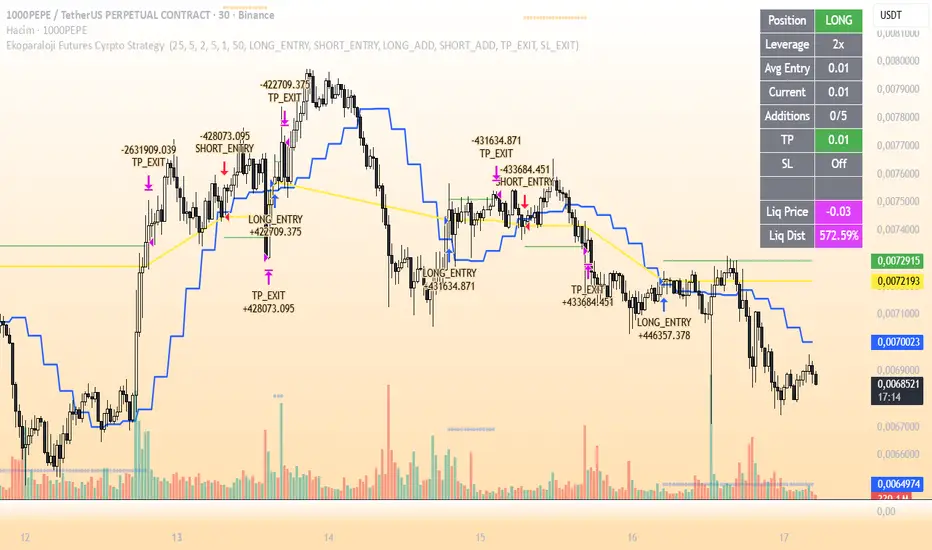
Ekoparaloji Futures Cyrpto Strategy Ekoparaloji Futures Crypto Strategy - Ladder Averaging System
This strategy uses a ladder position entry (pyramiding) approach and average cost reduction principle for crypto futures markets.
Key Features:
Dynamic ladder entry system
Profit-taking mechanism based on average price
Adjustable leverage support (1x-125x)
Long and Short position management
Optional stop-loss protection
Liquidation distance tracking
Advantages:
✓ Optimizes average cost during price fluctuations
✓ User-controlled risk-reward ratio
✓ Adapts to different market conditions
✓ Provides detailed visual feedback
✓ Increases profit potential through pyramiding strategy
Risks:
⚠ High leverage usage increases liquidation risk
⚠ Losses can accumulate during trend continuation
⚠ Pyramiding adds capital requirements
⚠ May produce unexpected results in sideways markets
⚠ Past performance does not guarantee future results
Recommended Usage:
This strategy is optimized for testing particularly on 30-minute and 1-hour timeframes. It may produce different results across various crypto pairs and market conditions.
Important Warning:
This strategy is for educational and research purposes. Extensive testing on demo accounts is strongly recommended before using in live trading. Leveraged trading involves high risk and you can lose all your capital.
📩 Message me to test the strategy and get access.
Happy Trading! 🚀
Biance Events 币安事件合约适用于biance中的Events,可用于btc和eth,两者表现相近,我不推荐梭哈,指标不能做到100%正确
Applicable to events in Binance, can be used for BTC and ETH, both perform similarly. I do not recommend going all-in, as indicators cannot be 100% accurate.

ATR Trailing Stop Without tradepanel Open✅ Only plots ATR trailing stop line
✅ Only colors candles
✅ No trades / entries
✅ No “Strategy Tester” panel
✅ No arrows, markers, or trade lists

Metallic Retracement LevelsThere's something that's always bothered me about how traders use Fibonacci retracements. Everyone treats the golden ratio like it's the only game in town, but mathematically speaking, it's completely arbitrary. The golden ratio is just the first member of an infinite family of metallic means, and there's no particular reason why 1.618 should be special for markets when we have the silver ratio at 2.414, the bronze ratio at 3.303, and literally every other metallic mean extending to infinity. We just picked one and decided it was magical.
The metallic means are a sequence of mathematical constants that generalize the golden ratio. They're defined by the equation x² = kx + 1, where k is any positive integer. When k equals 1, you get the golden ratio. When k equals 2, you get the silver ratio. When k equals 3, you get bronze, and so on forever. Each metallic mean generates its own set of ratios through successive powers, just like how the golden ratio gives you 0.618, 0.382, 0.236 and so forth. The silver ratio produces a completely different set of retracement levels, as does bronze, as does any arbitrary metallic number you want to choose.
This indicator calculates these metallic means using the standard alpha and beta formulas. For any metallic number k, alpha equals (k + sqrt(k² + 4)) / 2, and we generate retracement ratios by raising alpha to various negative powers. The script algorithmically generates these levels instead of hardcoding them, which is how it should have been done from the start. It's genuinely silly that most fib tools just hardcode the ratios when the math to generate them is straightforward. Even worse, traditional fib retracements use 0.5 as a level, which isn't even a fibonacci ratio. It's just thrown in there because it seems like it should be important.
The indicator works by first detecting swing points using the Sylvain Zig-Zag . The zig-zag identifies significant price swings by combining percentage change with ATR adjustments, filtering out noise and connecting major pivot points. This is what drives the retracement levels. Once a new swing is confirmed, the script calculates the range between the last two pivot points and generates metallic retracement levels from the most recent swing low or high.
You can adjust which metallic number to use (golden, silver, bronze, or any positive integer), control how many power ratios to display above and below the 1.0 level, and set how many complete retracement cycles you want drawn. The levels extend from the swing point and show you where price might react based on whichever metallic mean you've selected. The zig-zag settings let you tune the sensitivity of swing detection through ATR period, ATR multiplier, percentage reversal, and additional absolute or tick-based reversal values.
What this really demonstrates is that retracement analysis is more flexible than most traders realize. There's no mathematical law that says markets must respect the golden ratio over any other metallic mean. They're all valid mathematical constructs with the same kind of recursive properties. By making this tool, I wanted to highlight that using fibonacci retracements involves an arbitrary choice, and maybe that choice should be more deliberate or at least tested against alternatives. You can experiment with different metallic numbers and see which ones seem to work better for your particular market or timeframe, or just use this to understand that the standard fib levels everyone uses aren't as fundamental as they appear.

RPT Position Sizer🎯 Purpose
This indicator is a position sizing and stop-loss calculator designed to help traders instantly determine:
How many shares/contracts to buy,
How much risk (₹) they are taking per trade,
How much capital will be deployed, and
The precise stop-loss price level based on user-defined parameters.
It displays all key values in a compact on-chart table (bottom-left corner) for quick trade planning.
💡 Use Case
Perfect for discretionary swing traders, systematic position traders, and risk managers who want instant visual feedback of trade sizing metrics directly on the chart — eliminating manual calculations and improving discipline.
⚙️ Key Features
Dynamic Inputs
Trading Capital (₹) — total available capital for trading.
RPT % — risk-per-trade as a percentage of total capital.
SL % — stop-loss distance in percent below CMP (Current Market Price).
CMP Source — can be linked to close, hl2, etc.
Rounding Style — round position size to Nearest, Floor, or Ceil.
Decimals Show — control number formatting precision in the table.
Core Calculations
SL Points: CMP × SL%
SL Price: CMP − SL Points
Risk Amount (₹): Capital × RPT%
Position Size: Risk ÷ SL Points
Capital Used: Position Size × CMP
Clean On-Chart Table Display
Displays:
Trading Capital
RPT %
Risk Amount (₹)
Position Size (shares/contracts)
Capital Required (₹)
Stop-Loss % & SL Price
The table uses a minimalistic white-on-black design with clear labeling and rupee formatting for quick reference.
Data Window Integration
Plots hidden values (Position Size, Risk Amount, SL Points, Capital Used) for use in TradingView’s Data Window—ideal for strategy testing and exporting values.

Volatilidad Multi-TF📊 Multi-Timeframe Volatility (ATR%)
Description
Indicator that displays the current asset's volatility across multiple timeframes simultaneously. It uses the ATR (Average True Range) normalized as a percentage of price, allowing for objective volatility comparison across different timeframes.
✨ Key Features
- Multi-Timeframe Analysis: Visualize volatility across 5 different timeframes (1H, 4H, D, W, M)
- Normalized Volatility: ATR expressed as a percentage of price for accurate comparison
- Compact Table: Clean and easy-to-read interface in the corner of your chart
- Auto-Update: Automatically adapts to the asset you're viewing
- No Additional Plots: Only displays essential information in table format
🎯 How to Use
1. Add the indicator to your chart
2. The table will automatically display the current asset's volatility
3. Percentage values allow you to quickly identify:
- Which timeframe has higher/lower volatility
- Divergences between timeframes
- High or low volatility zones to adjust your strategies
⚙️ Configurable Parameters
- ATR Period: Default 14, adjust according to your strategy
📈 Practical Applications
- Risk Management: Adjust position sizing based on current volatility
- Asset Selection: Identify assets with suitable volatility for your profile
- Entry Timing: Detect volatility expansions/contractions
- Timeframe Analysis: Compare volatility across different time periods
💡 Technical Notes
- Normalized ATR allows volatility comparison between assets with different prices
- Useful for both intraday trading (1H, 4H) and swing/positional trading (D, W, M)
- Compatible with any market: cryptocurrencies, forex, stocks, indices
⚠️ Disclaimer
This indicator is a technical analysis tool. It does not constitute financial advice. Conduct your own analysis and risk management before trading.

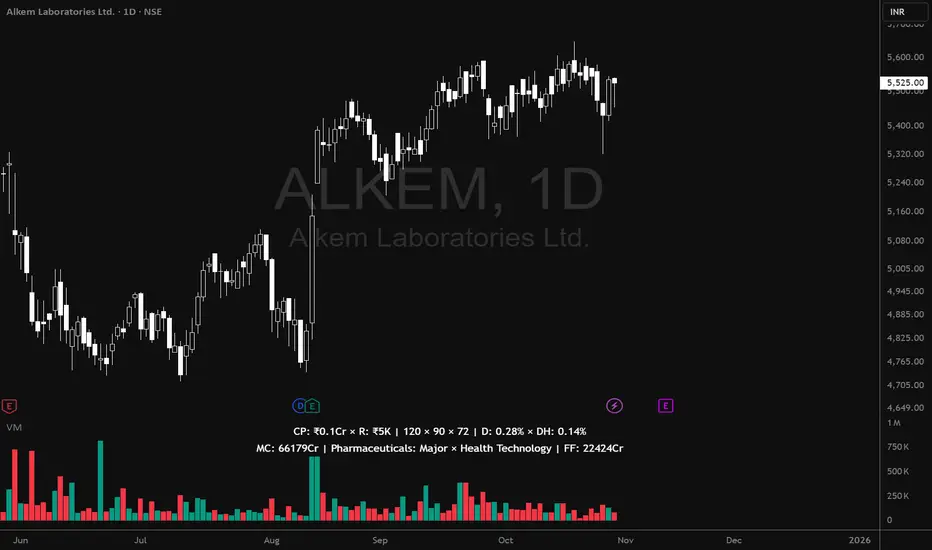
Volume MatrixVolume Matrix (VM) is a comprehensive volume and position-sizing toolkit designed to help traders interpret market participation and manage trade risk efficiently.
It combines volume analytics, risk-adjusted position sizing, and stock-specific financial data — all in a clear, visual, and automated format directly on TradingView charts.
The indicator integrates capital management, episodic volume spikes, and market capitalization data into a single, intuitive framework, giving traders an edge in both decision-making and discipline.
⚙️ Core Components & Features
🧩 1. Position Sizing & Risk Management
A dynamic risk table helps traders determine how much to trade and how much to risk per position, adapting automatically based on user inputs:
- Capital (CP): Total account size (₹ or $).
- Risk Mode (R): Choose between Percentage of capital or fixed Currency value.
- Lot Size Mode: Optional toggle to align quantities with F&O lot sizes (India-based).
- Standard Stop-Loss (SSL): Displays position quantities for three custom stop-loss levels (e.g., 0.75%, 1%, 1.25%).
- % Distance Metrics: D: Distance from day’s low/high (helps assess stop distance). DH: Distance from mid-body (useful for candle risk assessment). Auto-adjusts based on whether the trader is in Long, Short, or Both mode.
📈 Helps answer:
“How much quantity should I trade at my desired risk level?”
🔶 2. Volume Visualization
- Plots volume bars with default up/down coloring.
- Green for bullish bars.
- Red for bearish bars.
- Designed for quick visual differentiation of buying/selling pressure.
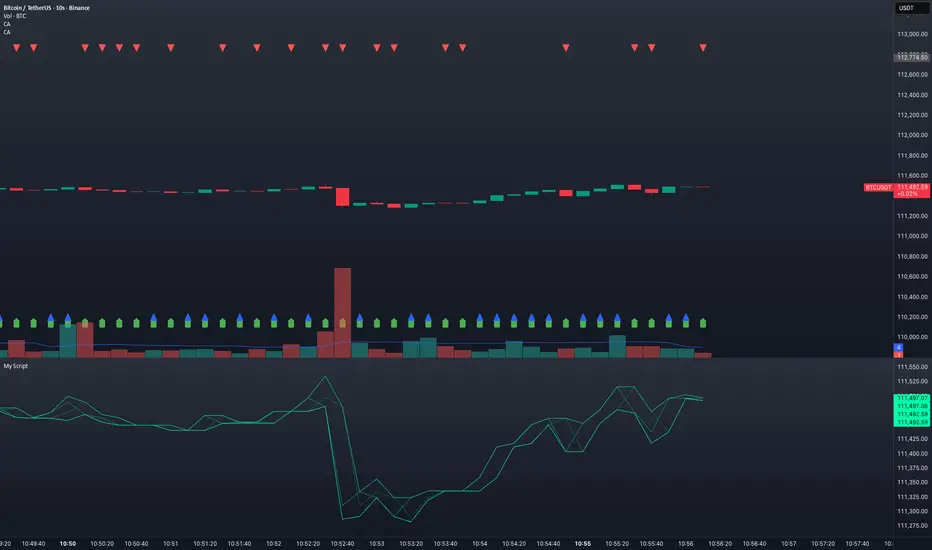
🚀 3. Episodic Pivot (EP) Detector
Identifies high-volume breakout or capitulation days, often marking significant turning points or trend initiations.
- Highlights bars where volume exceeds a custom threshold (in millions).
- Marks them visually with an orange triangle under the candle.
-Best used on daily charts to spot institutional footprints.
📊 Helps answer:
“Is today’s volume large enough to signal major institutional activity?”
🧾 4. Data Metrics Table
Displays fundamental and contextual data about the asset:
- Market Capitalization (MC): Auto-calculated using outstanding shares × price.
- Free Float (FF): Value of tradable shares in currency or Cr (INR).
- Industry × Sector × F&O Status: Shows the company’s industry and sector classification. Displays FC (Futures Contract) or NFC (Non-F&O stock).
- Customizable appearance: Choose between text/value display, text color, and background color. Flexible positioning and size control to suit any chart layout.
📚 Helps answer:
“What type of stock is this, how big is it, and does it trade in futures?”
🪄 5. User Interface Customization
- Modular UI grouped by functionality (Risk, Direction, Metrics, Volume, etc.).
- Flexible table position & size (Top/Bottom/Middle & Tiny–Huge).
- All elements are toggleable, giving full control over displayed data.
- Built to ensure visual clarity on any chart background.
| Trading Goal | How Volume Matrix Supports It |
| ------------------------------ | -------------------------------------------------------------- |
| **Risk Management** | Calculates optimal trade size and risk exposure automatically. |
| **Position Sizing Discipline** | Enforces consistent sizing across trades using SSL levels. |
| **Volume Confirmation** | Highlights institutional participation via Episodic Pivots. |
| **Stock Context Awareness** | Shows market cap, sector, and float value instantly. |
| **Efficiency** | Reduces manual work — no need for calculators or spreadsheets. |
💡 In Short
Volume Matrix simplifies trade planning, brings transparency to risk, and connects volume with context — all in one elegant visual tool.
Perfect for:
- Discretionary traders refining entries and sizing.
- Swing traders watching for volume-based pivots.
- Analysts who want price-volume fundamentals at a glance.
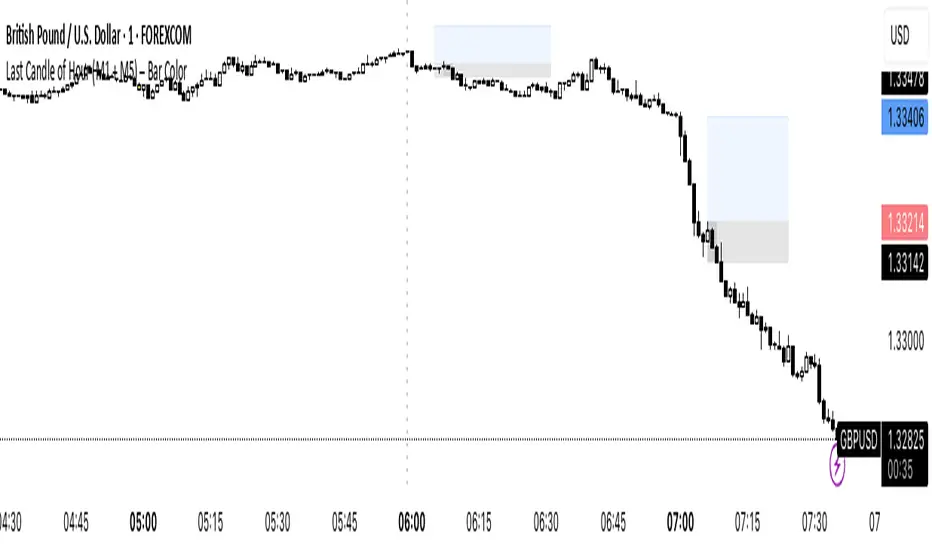
Last Candle of Hour Highlighter (M1 + M5)Highlights the last candle of every hour on 1-minute (M1) and 5-minute (M5) charts, making it easier to spot session closes, breakouts, and end-of-hour price action at a glance.
Detailed Description / How to Use:
This indicator automatically detects the last candle of each hour and changes its colour for quick visual reference. It’s designed for traders who use short-term timeframes (M1, M5) and want a clean visual cue for hourly closes.
Features:
• Automatically detects M1 and M5 timeframes.
• Highlights the last candle of each hour with a customisable colour.
• Optional Bull/Bear mode: colour changes depending on candle direction.
• Simple and lightweight — does not affect chart performance.
Inputs / Settings:
1. Color by Bull/Bear – Toggle on to automatically colour the last candle green (bullish) or red (bearish) based on its close relative to the open.
2. Highlight Colour – Choose a single colour if Bull/Bear mode is off.
3. Bullish Colour – Choose the colour for bullish last candles.
4. Bearish Colour – Choose the colour for bearish last candles.
Usage Tips:
• Works best on 1-minute and 5-minute charts.
• Ideal for spotting end-of-hour reversals, breakout candles, and momentum shifts.
• Can be combined with other indicators like support/resistance or moving averages for more advanced strategies.
Premarket Gapper Swing Filter (Long) – v6here’s a plug-and-play Pine Script v5 “screener” you can drop on any chart to flag pre-market gainers that also meet swing-friendly trend/liquidity filters. It works as a chart-level scanner (since Pine can’t screen the whole market by itself): add it to a watchlist; symbols that qualify will light up and you can set alerts to ping you right at the opening bell.

Event Marking [zidaniee]This is not a technical analysis indicator, but a visual tool designed to mark important global events using vertical lines on your chart.
By placing a single marker at the exact time an event occurred, you can compare how different assets reacted to that global event — before, during, and after it happened.
In the example provided, the marking corresponds to the moment when U.S. President Donald Trump announced a 100% tariff on goods from China, which was immediately reflected in market reactions worldwide.
The indicator includes full customization features for:
• Event label text
• Label size and position
• Line color, style, and width
Enjoy

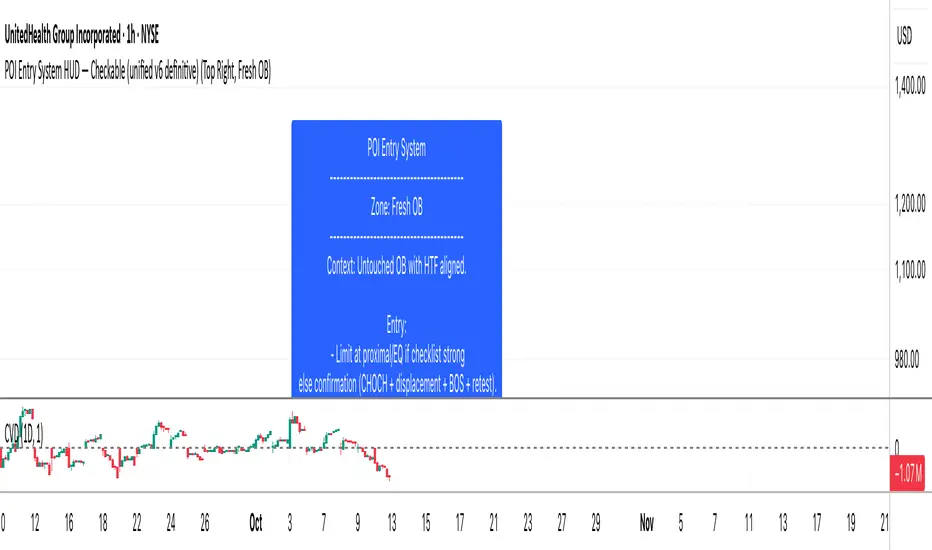
SMC POI Entry System HUDEntry, RR, Exit, of supply and demand zones taught in smart money trading. 12 types of zones and setups around Flips, Order Blocks, High Probability, and Extreme Demand Zones. Includes Checklist for Entry, Exit Rules, Take Profit Targets, Stop Loss spots, and Context

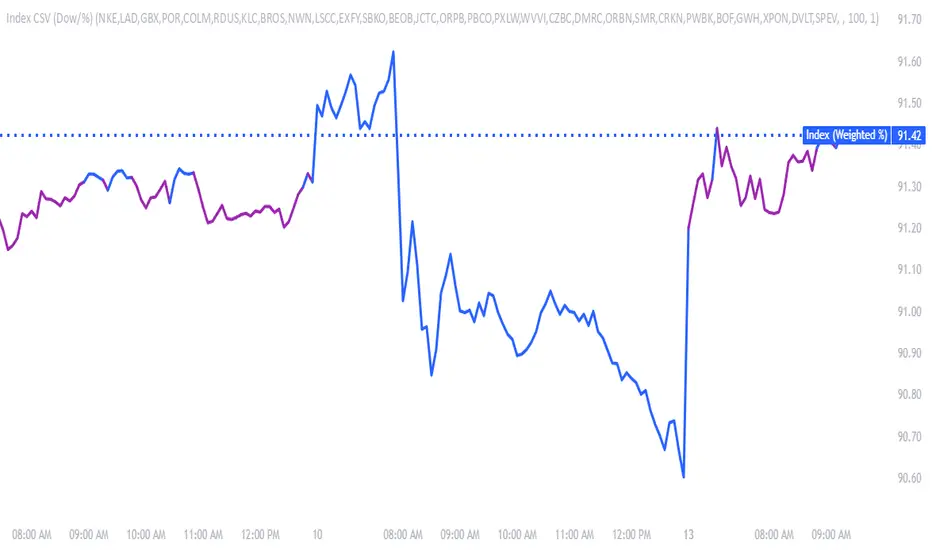
Make & Track An Index — Custom Weighted (by Quinn Millegan)Fixed pinescript security call issue limiting to 40 calls
Test for firing alerts on candle openThis fires an alert on every candle open. Nice to use if you need to test the performance of TradingView Alerts.
CyberTradingV1.4 TRexCyberTradingV1.3 — Multi-TF Volatility/Structure + FVG Suite (by College Pips)
TL;DR
One utility to read volatility regime (ATR vs TH), map market structure & swings, and track FVG/CE imbalances—so you can gauge range, context and entries in one place. No signals or promises; it’s a contextual toolkit.
What it does
Volatility table (multi-TF): Shows ATR-style and TH proxies across 1m → Monthly, so you can compare current TF vs higher TFs.
Composite levels: LQC / GAM / Trigger / TRex quantify “how much is enough” for legs/impulses relative to the active TF.
Structure & swings: Validated swing highs/lows with optional time-anchored rectangles (height sized by LQC) and auto structure/diagonal lines.
Imbalances (FVG): Auto-detect UP/DOWN FVGs, extend forward, optional CE line; alerts fire on touches/entries/fills.
Candle sizing: Directional color map by fixed ATR-ratio buckets; Inside Bars are force-colored for clarity.
How components work together (mashup rationale)
Read regime with the table (ATR vs TH per TF).
Map structure with swings/lines to see HH/HL/LH/LL context.
Focus imbalances with FVG + optional CE; monitor with alerts.
Act with thresholds using LQC/GAM/Trigger/TRex to standardize expectations across symbols/TFs.
Method transparency
ATR/TH math: ATR is a smoothed multi-window blend; TH scales the daily range to TF via √time.
Composites: LQC ≈ √(ATR×TH) × C(TF); GAM2/3/4 and Trigger/TRex apply TF-specific scalars to min/max aggregates (see source for exact coefficients).
Multi-TF: Values come from request.security and finalize on higher-TF bar close (no look-ahead).
Swings: Confirmed using left/right strengths; labels are offset back to the pivot bar.
FVG/CE: Classic 3-bar definition; CE is the midpoint line. Boxes extend until touched/filled; optional auto-delete on fill.
Usage
Enable the table to gauge expansion/contraction.
Turn on swing rectangles for LQC-sized reaction zones.
Toggle FVG + CE on your execution TF; use alerts to catch re-entries/resolutions.
Combine with price action and your own trade plan.
Limitations & fair warnings (be honest)
Offsets/past plotting: Swing labels and rectangles are anchored to past bars (offset = -right_strength). They do not predict future bars.
Repainting notes: Swings confirm after right_strength bars; higher-TF values finalize on their close. Past markings can update as confirmations occur.
Tick handling: Uses syminfo.mintick (special cases for JPY/XAU/XAG). Validate on exotic symbols.
No promises: This is a context tool, not a buy/sell signal generator.
Alerts included
ABOVE/BELOW threshold: Price crossing CE or FVG bounds.
IOFED up/down: Price entering an FVG from above/below.
Inputs (high-level)
Layout/positioning, color palettes, swing rectangle styling (width/fill/border), detection strengths, label/line widths, FVG lookback, CE on/off & style, auto-delete filled boxes.
Credits & reuse
Concepts like FVG/CE are widely known in market-microstructure education.
This implementation—table architecture, LQC/GAM/Trigger framework, swing rectangles, candle bucketing, and alert logic—is original to College Pips / CyberTradingV1.4
