TRADING VIEW INDICATOR - PINE TUTORIAL 5After a long gap, I have written the 5th tutorial for the pine script. You can find the others below, if you read through all of these you should be good to do your own writing.
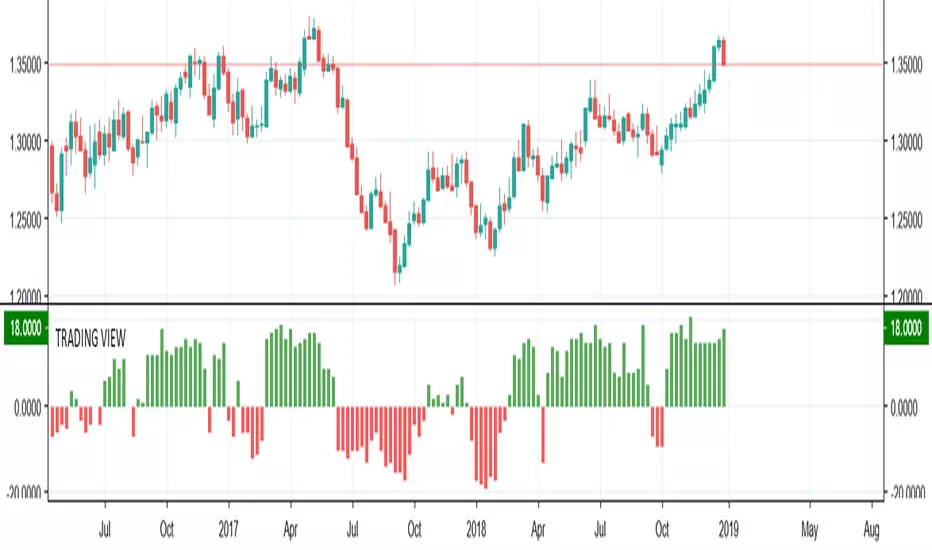
This script mimics the Trading View Indicator . For example this one below.
www.tradingview.com
It shows the net result of the 28 indicator, either as buy or sell. I have worked hard to make sure it matches the trading view results but I am not in hundred percent agreement with tradingView on SMA, EMA and Ichimoku indicator.
There are many commented plots because I needed to check separately if each indicator is working correctly.
Someone else wrote this code but they did not make it public. It took me about 3 weeks to write this and to be honest it could be cleaner and better commented.
If you find any mistake please let me know. I hope it will be useful in your learning.
Pinescript
Christmas Tree Theme With Open Code To See Pine ScriptI had been trying to code a predictive algorithm working with sine waves, but I got distracted and made some snow and Christmas trees lol. I'm uploading this with the source code because I'm sure someone will be able to learn from it to create something useful.
Please follow me for some actual useful pine scripts and merry Christmas! :)

BarstateThe TradingView system has two types of bars. Bars that are historical and bars that are real-time.
When programming complex scripts and strategies that use higher timeframe data there can be difficult programming conditions due to these two bar states.
Especially in the case of after-hours, end of day, low volume trading and thinly traded stocks the bar state status can sometimes be historical and sometimes be real-time in different timeframes or even the same timeframe.
This script displays what state a bar is in by shading the background of the chart.
The script is being made publicly available to help my script users know about and understand 'barstate'. The script allows users to see the 'barstate' in order to help report bugs and conduct their own workarounds.
My testing has indicated that the 'barstate' status is sometimes spurious especially on thinly traded symbols. Additionally, the Tradingview back-end calls the script only after price changes to reduce system load. As a result, these two characteristics can cause unexpected Pine Script results.
Crinkebine
November 2018

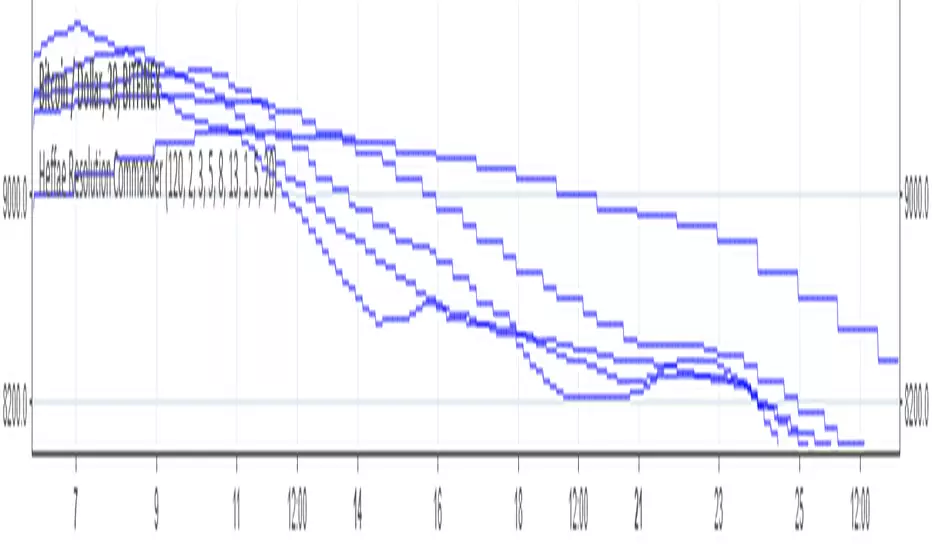
Heffae Resolution Commander (RAW)This is a script to call resolutions with some math on top of your base resolution.
Using the modulo operator to quantize integer values, it works by converting the modified resolution integer to a 4 digit string value.
Use the function within your own scripts to call funny resolutions otherwise difficult to calculate.
You cannot add series expressions to the resolution value since pine does not allow "series" as a resolution for a security call
However, you could easily stack a crapload of these together and use an expression to switch the referenced security function for your purposes.
This is the raw timeframe output as integer, not string.
To go back to string outputs (for use in security calls etc) unslash line 52 //resvalue
For those interested in the verbose version of the timeframe mod function, showing all the steps, here is a pastebin:
pastebin.com
Cheers! Drop a line / comment if you enjoy or have any questions on how to integrate this into your script@!
The Modulo operator is so much fun!
Heffae Resolution CommanderThis is a script to call resolutions with some math on top of your base resolution.
THIS IS NOT AN INDICATOR TO USE ON A CHART!!! The resolution call function is really useful for your own scripting ideas!
Using the modulo operator to quantize integer values, it works by converting the modified resolution integer to a 4 digit string value.
The function within this script is what is valuable, use it within your own scripts to call funny resolutions otherwise difficult to calculate.
You cannot add series expressions to the resolution value since pine does not allow "series " as a resolution for a security call
However, you could easily stack a crapload of these together and use
an expression to switch the referenced security function for your purposes.
The SMA and plot overlay are just there to show a visual example of how the function works.
You can view the raw timeframe output integer by getting rid of tostring(x) and // out the security calls,
plotting the raw function outputs.
For those interested in the verbose version of the timeframe mod function, showing all the steps, here is a pastebin:
pastebin.com
Cheers! Drop a line / comment if you enjoy or have any questions on how to integrate this into your script@!
The Modulo operator is so much fun!
CM_Ultimate_MA_MTF_V2 with Alert Long and Short Hello All,
Here is a scirpt of ChrisMoody modified with the alerts of purchases and sales.
I just have a problem with automation. At the bottom of my script my alerts "Buy1" and "Sell2" give alerts constantly and I wish to have a single alert before the order is completed. Before "Sell1" or Buy2 ".
I found the function "barstate.isfirst" that could possibly work?
Does anyone have an idea ? :)

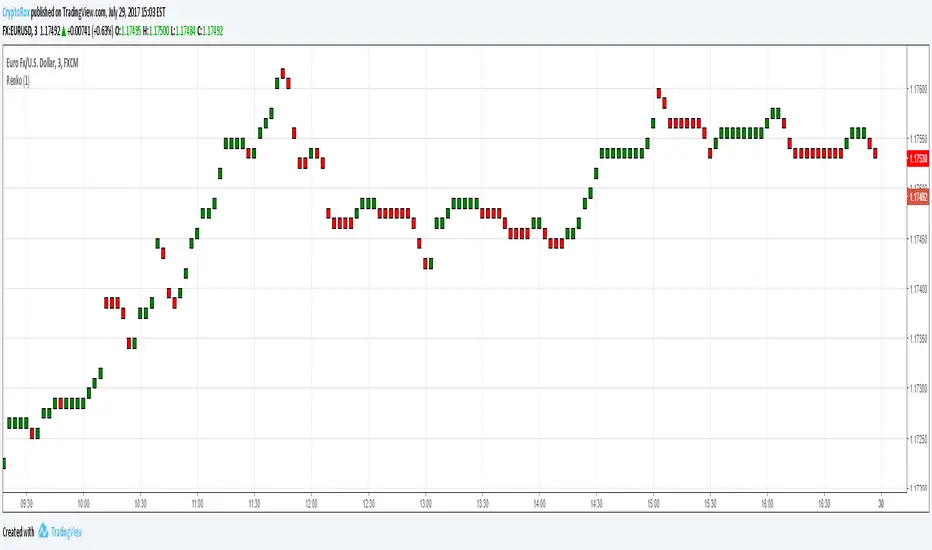
Renko CandlesThis is a script to place Renko candles on your chart alongside another candle type or more importantly, using the variables from this script, you can build a strategy using Renko candles that will depict true/proper entries and exits in a strategy when using the backtest feature.
We hope this helps!
Pine Script Tutorial #2In this second tutorial we build upon the previous tutorial. We add color shading for each different day and highlight Wednesday.
The idea here is to manually count if on Wednesdays close is bigger then open.
Hope it helps.
Feel free to comment.
MartinMystere

My Tutorial #1If you are just like me and cant just get your head around pine script, I have created this simple code so you get the main concept.
Unfortunately there are no good step by step tutorials out there teaching scripting.
Hope this helps.
Comments are welcome.
MatinMystere

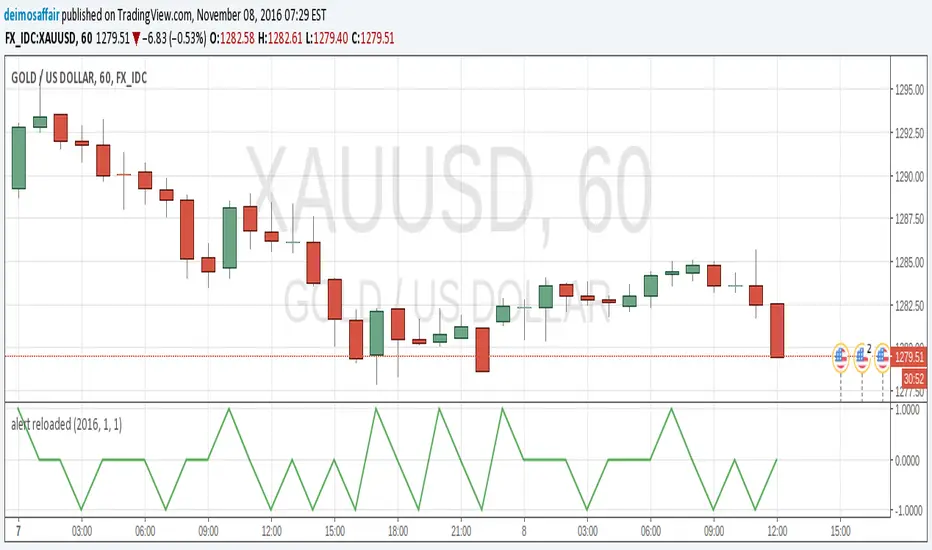
alert reloadedtype: alert creation
required time: 5 minutes
level: easy
Getting alerts for indicators and strats is good to easy the eyes of the charts for a while :)
After my first script itroducing how to do alerts here there is an easier, more clear way to create an alert. It's still good to do it the "old way" to understand/debug an alert, but after that you'll want this extra tool for sure.
I assume you read my previous post, or understand how alerts are set up on a chart.
So, there is this function called alercondition() that does (almost)the whole job for us :)
The function does NOT create the alert automatically, what is does is introducing a new option in the alerts popup. While in the v1.0 of my script the alert was triggered checking for the plot value against 0.9 or -0.9, in this example the alertcondition() function just fires the alert by itself.
Get the script for yourself, in favourites, copy/paste, whatever. Add it to any chart. Then, open the popup to create an alert(the little clock at the top). There will be a drop menu with the options and "Alert reloaded". This is the title provided in the study() parameter. Choose this one.
Now, the second drop menu has the "going UP" and "going DOWN" options. These are the titles from the alertcondition() function. Select one. Make all the aditional choices for the alert you want. Save it.
And that's it, the alert will fire when the conditions become true. You can still keep the plot() for graphical reference, but it's now an extra, removing it will not affect the alert, so more space in the chart. Yey!! :)
Back to zero: Understanding seriestype: pine series basic example
time required: 10 minutes
level: medium (need to know the "array" data variable as a generic programming concept, basic Pine syntax)
tl;dr how variables and series work in Pine
Pine is an array/vector language. That's something that twists how it behaves, and how we have to think about it. A lot of misunderstandings come from forgetting this fact. This example tries to clear that concept.
First, you need to know what an array is, and how it works in a programmig language. Also, having javascript under your belt helps too. If you don't, google "javascript array basic tutorial" is your friend :)
So, in pine arrays are called "series". Every variable is an array with values for each candle in the chart. if we do:
myVar = true
this is not a constant. It is a series of values for each candle, { true, true,....., true }
In practice, the result is the same, but we can access each of the values in the series, like myVar{0}, myVar{7}, myVar{anyNumber}....
Again, it is not a constant, since you can access/modify the each value individually
so, lets show it:
plot (myVar, clolor = gray)
this plots an horizontal line of value 1 ( 1 is equal to true ) so it's all good.
On to a more usual series:
tipicalSeries = close > open ? true : false
plot(tipicalSeries, color= blue)
This gives the expected result, a tipical up and down line with values at 1 or 0. Naturally, "tipicalSeries" is an array, the "ups" and "downs" are all stored under the same variable, indexed by the candles.
In Pine, the ZERO position in the array is the last one, which corresponds to the last candle on the right. Say you have a chart with 12 candles. The close would be the closing value of what we intuitively think as first candle, the one on the left. then close ... and so on.... until close , the value of the "last" candle, the one on the right. It actually helps to start thinking of the positions backwards, counting down to zero, rocket launch style :)
And back to our series. The myVar will also be the same size, from myVar to myVar .
When we do some operation with them, something simple like
if ( myVar == tipicalSeries)
what is really happening is that internally, Pine is checking each of the indexes, as in myVar == tipicalSeries , myVar == tipicalSeries .... myVar == tipicalSeries
And we can store that stuff to check it. simply:
result = (myVar == tipicalSeries) ? true : false //yes, this is the same as tipicalSeries, but we're not in a boolean logic tut ;)
plot (result)
The reason we can plot the result is that it is an array, not a single value. The example indicator i provide shows a plot where the values are obtained from different places in the array, this line here:
mySeries3 = mySeries2 and mySeries1
this creates a series that is the result of the PREVIOUS values stored (the zero index is the one most at the right, or the "current" one), which here just causes a shift in the plotted line by one candle.
Go ahead, grab a copy of my code, try to change the indexes and see the results. Understanding this stuff is critical to go deeper into Pine :)


"Smoothed" CandlesHi!
This new functions plotbar and plotcandle are amazing! Just look at this smoothed candles here)))

Higher Resolution Bars on Intraday ChartHi everybody!
With new plotbar and plotcandle functions you may plot somewhat "stretched" daily bars over intraday chart. Enjoy!

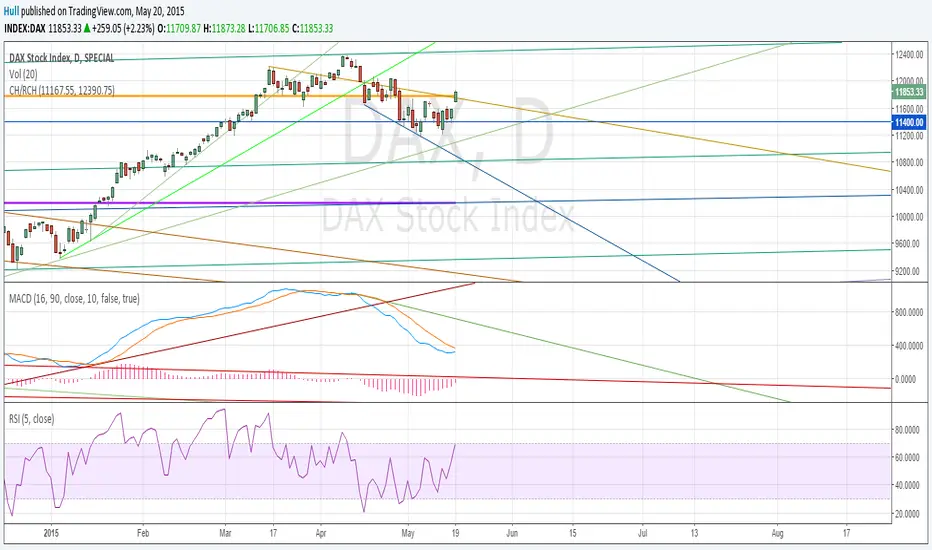
Code for Cup With Handle calculations (using Pine)Cup with Handle formation calculations using Pine.
First of all, ignore all other lines in the example chart except the two FAT lines. The two fat lines are the ones that define the Cup With handle or in the example chart: a Reversed Cup With Handle.
Note: Handle does not always develop and sometimes the final target price is reached without forming any handle.
This script can calculate both Cup With Handle ( CH ) and Reversed Cup With Handle ( RCH ). Just order the input values accordingly.
For more information about Cup With Handle, use google:
www.google.se
The script need two input parameters : The highest price in the Cup formation and the lowest price in the cup formation or vice versa for the Reversed Cup formation.
Best regards,
/Hull, 2015.05.20.16:31
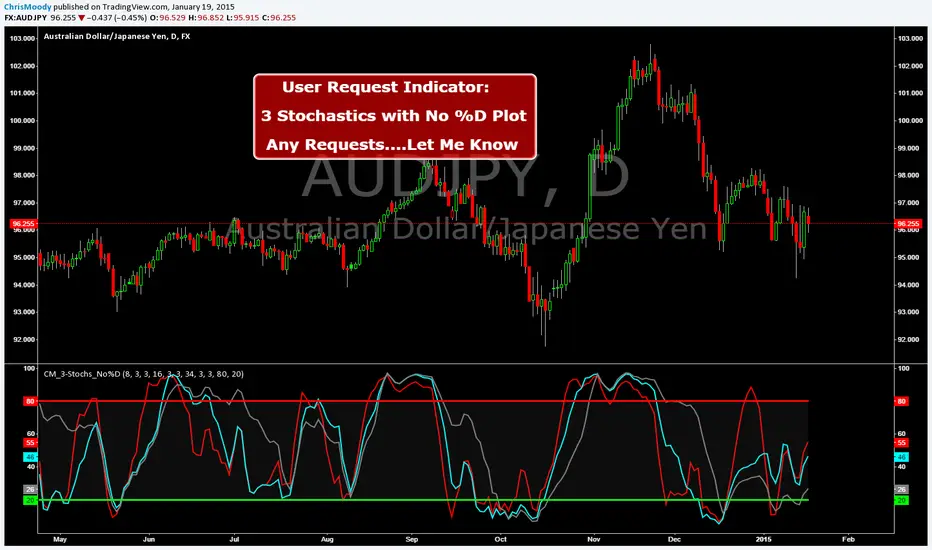
CM_3-Stochastics_No%D_UserRequestCreated By ChrisMoody on 1-19-2014 by User Request
Plots 3 Stochastic Lines.....No %D Lines...by User Request.
CM_Donchian Channels Modified_V2 - Alert CapableCM_Donchian Channels Modified_V2 With Alert Capability
***This Indicator was created by user Request to Add Alerts Capabilities for Donchian Channels.
New Features:
***Alerts Work - Ability To Create Alerts From Main Indicator.
***Can Also Be Used In Conjunction with Lower Indicator - CM_Donchian Channels Modified_V2_Lower_Alert
***Added Ability To Turn On/Off Highlight Bars.
***Added Ability to Turn On/Off Donch Channel Midline
***Added Ability to Turn On/Off Triangles That Plot At Top and Bottom Of Chart When Breakout Condition is TRUE.
Special Indicator Features:
***Ability To Use Different LookBack Period on Upper and Lower Donch Channel Lines.
How To Create Alerts:
***Create Alert by selecting Indicator - Either the name of the Upper Or Lower Indicator...
***Then select either Alert Breakout Upside or Downside(To The Right Of Indicator Name)
***Select Greater Than
***Select Value
***For Value put .99
Original Post Explaining Indicator is -
***If You Need Help Getting Custom Indicators to Trigger Alerts then View This Post.

CM_Donchian Channels Modified_V2_Lower_Alert***This Indicator was created by user Request to Add Alerts Capabilities for Donchian Channels.
New Features:
***Alerts Work - Ability To Create Alerts From Main Indicator.
***Can Also Be Used In Conjunction with Upper Indicator - CM_Donchian Channels Modified_V2 With Alert Capability
***Added Ability To Turn On/Off Highlight Bars.
***Added Ability to Turn On/Off Donch Channel Midline
***Added Ability to Turn On/Off Triangles That Plot At Top and Bottom Of Chart When Breakout Condition is TRUE.
Special Indicator Features:
***Ability To Use Different LookBack Period on Upper and Lower Donch Channel Lines.
How To Create Alerts:
***Create Alert by selecting Indicator - Either the name of the Upper Or Lower Indicator...
***Then select either Alert Breakout Upside or Downside(To The Right Of Indicator Name)
***Select Greater Than
***Select Value
***For Value put .99
Original Post Explaining Indicator is -
***If You Need Help Getting Custom Indicators to Trigger Alerts then View This Post.

CM ATR Stops/Bands - Multi-TimeFrameCM_MTF ATR Bands/Stops
Many Options Available Via Input Tab:
-Chart Defaults to Upper and Lower ATR's Based on Current Chart TimeFrame
-Ability to Plot either Upper and/or Lower ATR's
-Ability to Change the Time Frame ATR's are Based On!
-Ability to change Look Back Period and ATR Multiplier Individually for Both Time Frames
-This Gives you the ability to plot same Time Frame with (for ex.) a 5 ATR with a 1.5 Mult and a 14 ATR with a 2.0 Mult etc.
-Or you can plot Daily ATR's on a 60 minute Chart etc.
-ATR Multipliers are Calculated with Code that allows "Non Whole Numbers" Allowing Ability to use 1.5 ATR's, 1.8 ATR's etc.
***Endless # of Combinations can be used!!!!

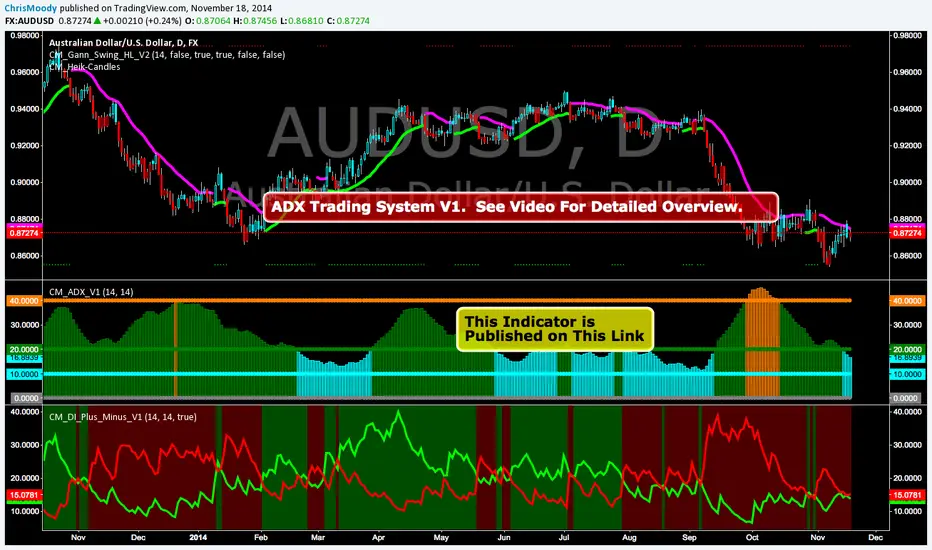
CM_ADX_V1ADX System Overview
So I Came Across Another Trading System for Only $997. However, if you purchased in the next 24hours the whole system could be Yours For Only $497.
So I decided to Code it. This is only Version 1, and I discuss in the Video What I’ve found so for, some plans for Version 2 of the indicator, and I ask for your feedback on anything you find.
Indicators used in System:
CM_DI_Plus_Minus_V1 (Indicator On Bottom).
CM_ADX_V1 (Indicator On 2nd Pane).
CM_Gann_Swing_Hi_Lo (Indicator on Price Pane). This Indicator was published before…Link Below.
CM_DI_Plus_Minus_V1
In Video I go over settings and how to customize charts.
Link To Video:
vimeopro.com
Link To Downloadable PDF Shown in Video:
d.pr
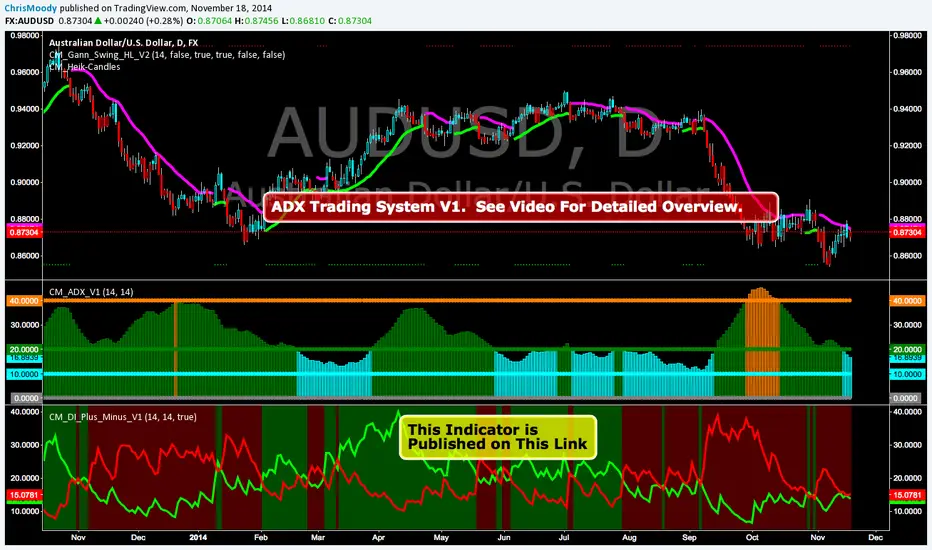
CM_DI_Plus_MinusADX System Overview
So I Came Across Another Trading System for Only $997. However, if you purchased in the next 24hours the whole system could be Yours For Only $497.
So I decided to Code it. This is only Version 1, and I discuss in the Video What I’ve found so for, some plans for Version 2 of the indicator, and I ask for your feedback on anything you find.
Indicators used in System:
CM_DI_Plus_Minus_V1 (Indicator On Bottom).
CM_ADX_V1 (Indicator On 2nd Pane).
CM_Gann_Swing_Hi_Lo (Indicator on Price Pane). This Indicator was published before…Link Below.
In Video I go over settings and how to customize charts.
Link To Video:
vimeopro.com
Link To Downloadable PDF Shown in Video:
d.pr
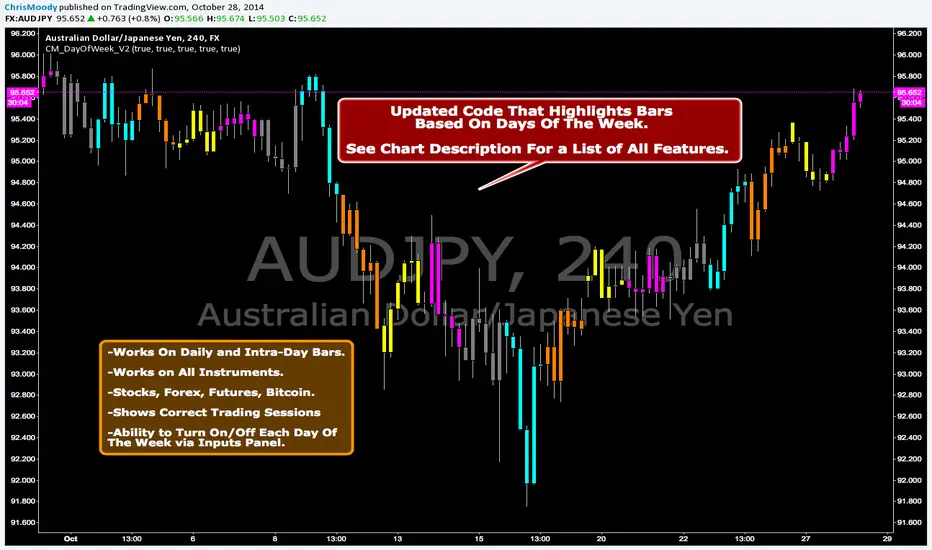
CM_DayOfWeek All Instruments V2Updated Code That Highlights Bars Based On Days Of The Week.
Works On Daily and Intra-Day Bars.
Works on All Instruments. Stocks, Forex, Futures, Bitcoin.
Shows Correct Trading Sessions!!!
Ability to Turn On/Off Each Day Of The Week via Inputs Panel.