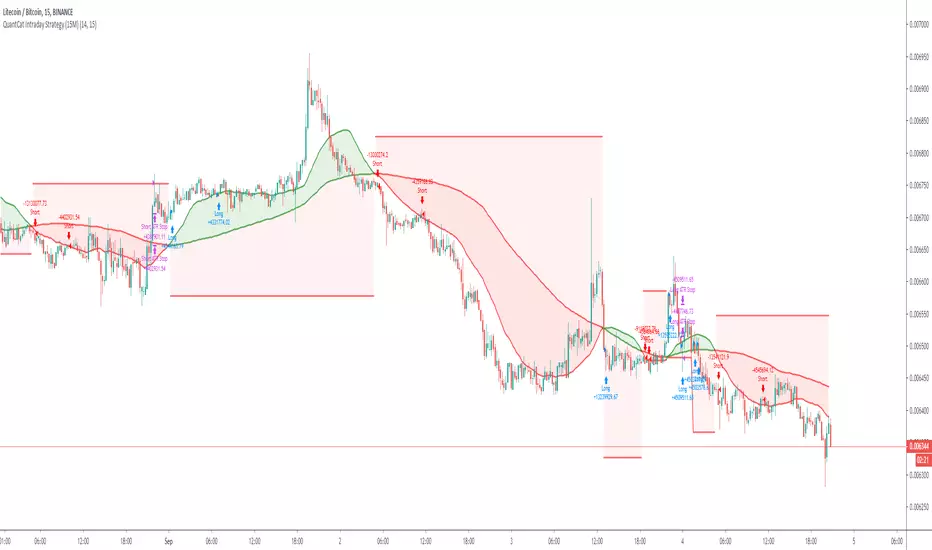
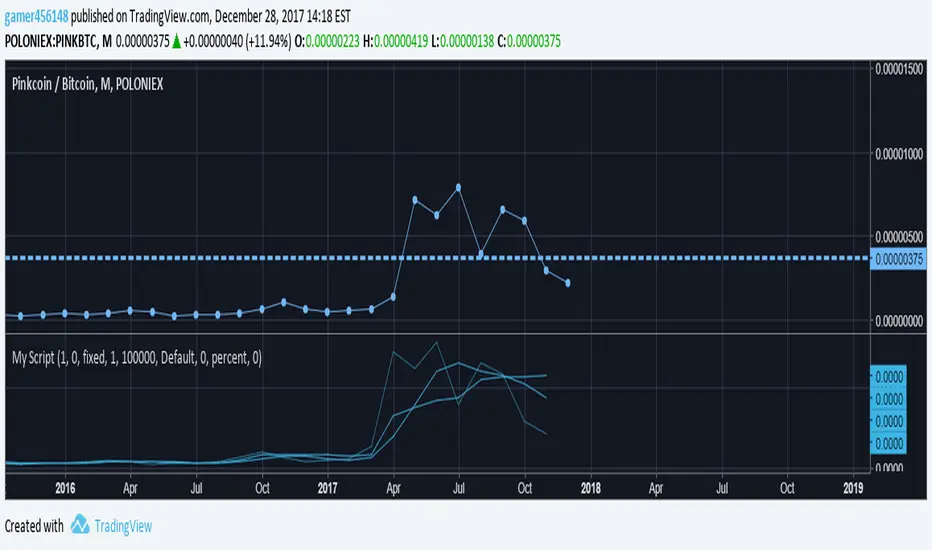
QuantCat Intraday Strategy (15M)QuantCat Intraday Strategy
This strategy is designed to be used on the 15 minute time frame, on liquid x/btc pairs and BTC/USD.
It works by having 2 moving averages, automatic stop loss calculation, and taking positions on MA crosses and MA zone bounces for confirmation.
Stoploss is so crucial to minimise any damage from huge unexpected candles, the strategies can just be used for entries as well, you don't have to stick to the exact formula- of the long and short system, but this by itself is profitable.
The system nets positive results on
-BTC/USD
-ETH/BTC
-LTC/BTC
-XRP/BTC
There is a small element of trend filtering also for the MA's, but I found adding it in actually hindered performance when testing and training the strategies unless it was using a loose value.
You can get live alerts for this strategy and speak to our developers by joining our server on discord! (Link in signature)
Pinescript
Polychromatic Pine MagicFor all Pine Script enthusiasts out there, I present my "Polychromatic Pine Magic" employing PSv4.0. This is NOT an indicator, and I would describe it as an articator that absolutely doesn't indicate anything at all. It's just a display of the " Power of Pine " to inspire other developers and maybe a few members or possibly non-members debating switching platforms to TV. I have long pondered this script as a goal, starting about a year ago, and was unable to conceive of how I might replicate my member avatar in Pine Script... until now!
With recent changes to Pine color, I wanted to explore how far I could take color with Pine. Writing this color coding over the course of a few hours by employing over a hundred separate colors in hex(#XXXXXX) combined with a large amount of conditional ternary operators(?:) in succession, Pine Script version 4.0 seems to handle this monster color script with ease surprisingly. I didn't provide this open source because implementing this kind of color technology would be a burden on the TV servers if everyone started making indicators like this. Sorry in advance, to those of you who are code hungry. Maybe in the future when TV has an abundance of cloud computing power, I shall release it, but I only foresee that occurring in quite a few years to a decade from now.
I would personally like to thank the talented individuals at TV for recently providing us with outstanding color functionality, enabling this pleasing eye candy display above.
Included are a few adjustments listed below for "Settings" that seem fun to play with, for those of you who are curiously minded. I figured that I should have it do something, in order to receive any thumbs up for this script. Imagery is great, but mutating imagery is a short lived thrill to enjoy.
Features List Includes:
"Period" adjustment
"Mutate Color Fill" tweak
"Transparency" control
Showcased in the chart below is my free to use "Enhanced Schaff Trend Cycle Indicator", having a common appeal to TV users frequently. The comments section below is solely just for commenting and other remarks, ideas, compliments, etc... regarding only this indicator, not others. If you do have any general questions or comments regarding this indicator, I will consider your inquiries, thoughts, and ideas presented below in the comments section, when time provides it. As always, "Like" it if you simply just like it with a proper thumbs up, and also return to my scripts list occasionally for additional postings. Have a profitable future everyone!


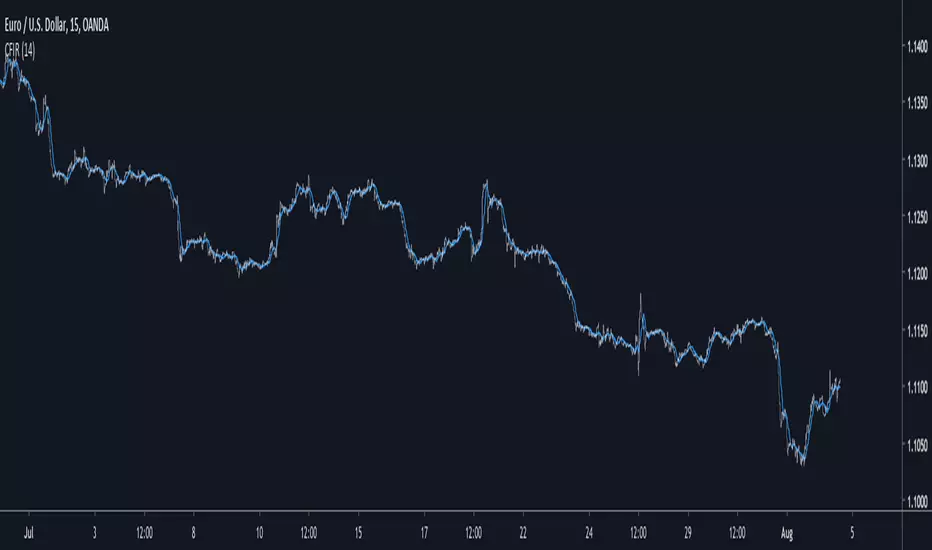
Template For Custom FIR Filters - Make Your Moving AverageIntroduction
FIR filters (finite impulse response) are widely used in technical analysis, there is the simple or arithmetic moving average, the triangular, the weighted, the least squares...etc. A FIR filter is characterized by the fact that its impulse response (the output of a filter using an impulse as input) is finite, this mean that the impulse response won't have infinite outputs unlike IIR filters.
They are extremely simple to design to, even without the Fourier transform, this is why i post this template that will let you create custom filters from step responses. Don't hesitate to post your results.
How It Works
Originally you create your filters from the frequency response you want your filter to have, this is because the inverse Fourier transform of the frequency response is the filter impulse response.
After that step you use convolution (convolution is the sum of the product between the signal and the impulse response) and you will have your filter. But we don't have Fourier transforms in pine so how can we possibly make FIR filters from convolution ? Well here the thing, the impulse response is the derivative of the step response and the step response is the sum of the impulse response, this mean we can create filters from step responses.
Step response of a moving average.
Step responses are easy to design, you just need a function that start at 0 and end up at 1.
How To Use The Template
All the work is done for you, the only thing you need to do is to enter your function at line 5 :
f(x)=> your function
For example if you want your filter to have a step response equal to sqrt(x) just enter :
f(x)=> sqrt(x)
This will give the following filter output :
You can create custom step responses from online graphing tools like fooplot or wolfram alpha, i recommend fooplot.
You can also design your filter step response from the line 14/15/16, b will be your filter step response, just use a , for example b = pow(a,2) , then replace output in plot by b and use overlay false, you can also plot step , if you like your step response copy the content of b and paste after f(x) => .
Filter Characteristics
The impulse response determine how many of a certain signal you want in your filter, this is also called weighting, you can think of filter design as cooking where your ingredients are the the signal at different periods and the impulse response determine how many of an ingredient you must include in the recipe. The step response can also tell you about your filter characteristics, for example :
This one converge faster to the step function, this mean that the filter will have less lag.
However this one converge slower to the step function, this mean the filter might have more lag but could be smoother.
Be aware that you must find a good weighting balance, else you can have output equals to the signal or just a delayed version of the signal without smoothing.
Real Case
Lets design a sine weighted moving average (swma), this FIR filter use the first 180 degrees of a sine wave function as impulse response.
Impulse response of the swma.
We can design it from the step response without much problems, remember that the impulse response is the derivative of the step response, therefore the derivative of the step response is equal to the first 180 degrees of a sine wave, the derivative of the cosine function is a sine function, therefore :
f(x)=> .5*(1 - cos(x*pi))
And voila.
Designing A BandPass Filter
The bandpass filter like a low-pass and high pass filter, you can think of it as a smooth oscillator.
To design a bandpass filter your step response must be bell shaped, or starting at 0 and ending at 0, for example :
f(x)=>sin(x*pi) give :
Conclusion
Just use fooplot and experiment, you could get nice filters, i will try to post some using this template but it would be really nice to have other people use it. If you need further help pm me.
Thanks for reading !
Pinescript v3 Compatibility Framework (v4 Migration Tool)Pinescript v3 Compatibility Framework (v4 Migration Tool)
This code makes most v3 scripts work in v4 with only a few minor changes below. Place the framework code before the first input statement.
You can totally delete all comments.
Pros:
- to port to v4 you only need to make a few simple changes, not affecting the core v3 code functionality
Cons:
- without #include - large redundant code block, but can be reduced as needed
- no proper syntax highlighting, intellisence for substitute constant names
Make the following changes in v3 script:
1. standard types can't be var names, color_transp can't be in a function, rename in v3 script:
color() => color.new()
bool => bool_
integer => integer_
float => float_
string => string_
2. init na requires explicit type declaration
float a = na
color col = na
3. persistent var init (optional):
s = na
s := nz(s , s) // or s := na(s ) ? 0 : s
// can be replaced with var s
var s = 0
s := s + 1
___________________________________________________________
Key features of Pinescript v4 (FYI):
1. optional explicit type declaration/conversion (you still can't cast series to int)
float s
2. persistent var modifier
var s
var float s
3. string series - persistent strings now can be used in cond and output to screen dynamically
4. label and line objects
- can be dynamically created, deleted, modified using get/set functions, moved before/after the current bar
- can be in if or a function unlike plot
- max limit: 50-55 label, and 50-55 line drawing objects in addition to already existing plots - both not affected by max plot outputs 64
- can only be used in the main chart
- can serve as the only output function - at least one is required: plot, barcolor, line, label etc.
- dynamic var values (including strings) can be output to screen as text using label.new and to_string
str = close >= open ? "up" : "down"
label.new(bar_index, high, text=str)
col = close >= open ? color.green : color.red
label.new(bar_index, na, "close = " + tostring(close), color=col, textcolor=color.white, style=label.style_labeldown, yloc=yloc.abovebar)
// create new objects, delete old ones
l = line.new(bar_index, high, bar_index , low , width=4)
line.delete(l )
// free object buffer by deleting old objects first, then create new ones
var l = na
line.delete(l)
l = line.new(bar_index, high, bar_index , low , width=4)

Dragon-Bot - Default ScriptDragon-Script is a framework to make it as easy as possible to test your own strategies and set alerts for external execution bots. This is the alerts version of the script.
The script has many features build in, like:
1) A ping/pong mechanism between longs and shorts
2) A stop-loss
3) Trailing Stops with several ways to calculate them.
4) 2 different ways to flip from long to short.
The script is divided into several parts.
The first part of the script is used to set all the variables. You should normally never change the first part except for the comments at the top.
The second part of the script is the part where you initialise all your indicators. Several indicators can be found on Tradingview and on other sites. Please keep in mind that all the variable names used in the indicator should be unique. (all the … = … parts)
The third part of the script, is the most important part of the script. Here you can create the entry and exit points.
Let’s look at the OPENLONG function to explain this part: The first variables are all the possible entries; These are longentry1 till longentry5. You can add many more if you like.
The variables are all initialised as being false. This way the script can set a value to true if an entry happens.
The if function is the actual logic: You could say “if this is true” then (the line below the if function) longentry1 := (becomes) true.
In this case we have said: “if this is true” then (the line below the if function) longentry1 := (becomes) true when the current close is larger than the close that is 1 back.
The last part is the makelong_funct. This part says that if any of the entries are true, the whole function is true.
The last part of the script is the actual execution. Here the alerts are plotted and the back test strategies are opened and closed.
We hope you guys like it and all feedback is welcome!

Dragon Bot - Default ScriptDragon Script is a framework to make it as easy as possible to test your own strategies and set alerts for external execution bots.
The script has many features build in, like:
1) A ping/pong mechanism between longs and shorts
2) A stop-loss
3) Trailing Stops with several ways to calculate them.
4) 2 different ways to flip from long to short.
The script is divided into several parts.
The first part of the script is used to set all the variables. You should normally never change the first part except for the comments at the top.
The second part of the script is the part where you initialise all your indicators. Several indicators can be found on Tradingview and on other sites. Please keep in mind that all the variable names used in the indicator should be unique. (all the … = … parts)
The third part of the script, is the most important part of the script. Here you can create the entry and exit points.
Let’s look at the OPENLONG function to explain this part: The first variables are all the possible entries; These are longentry1 till longentry5. You can add many more if you like.
The variables are all initialised as being false. This way the script can set a value to true if an entry happens.
The if function is the actual logic: You could say “if this is true” then (the line below the if function) longentry1 := (becomes) true.
In this case we have said: “if this is true” then (the line below the if function) longentry1 := (becomes) true when the current close is larger than the close that is 1 back.
The last part is the makelong_funct. This part says that if any of the entries are true, the whole function is true.
The last part of the script is the actual execution. Here the alerts are plotted and the back test strategies are opened and closed.
We hope you guys like it and all feedback is welcome!

50/100/200 Moving Averages (Pine Script For Copy)by fresca
SCRIPT LANGUAGE
Copy script below and adjust based on your preferences.
-function (change function from "sma" to "ema", "wma" and more)
-length (25 Day, 150 Day or add more averages to the three in this script.)
-color, (red, yellow, etc. or use color hex codes i.e. #FEDA15, #FFAD8F, etc.)
-transparency (set to desired level 1-100)
Or add more options.
RESOURCES
Color hex codes site: www.canva.com
Trading View Pine Script Editor Reference Guide: www.tradingview.com

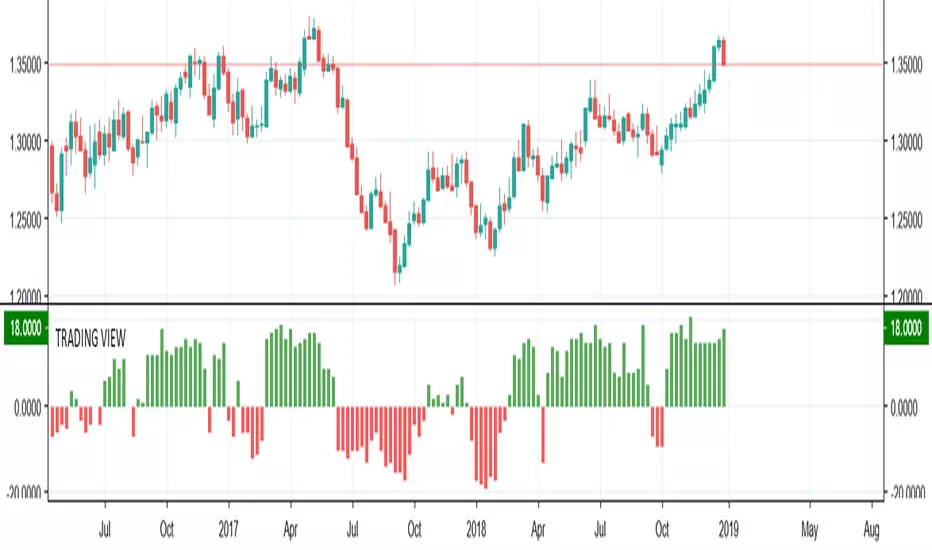
TRADING VIEW INDICATOR - PINE TUTORIAL 5After a long gap, I have written the 5th tutorial for the pine script. You can find the others below, if you read through all of these you should be good to do your own writing.
This script mimics the Trading View Indicator . For example this one below.
www.tradingview.com
It shows the net result of the 28 indicator, either as buy or sell. I have worked hard to make sure it matches the trading view results but I am not in hundred percent agreement with tradingView on SMA, EMA and Ichimoku indicator.
There are many commented plots because I needed to check separately if each indicator is working correctly.
Someone else wrote this code but they did not make it public. It took me about 3 weeks to write this and to be honest it could be cleaner and better commented.
If you find any mistake please let me know. I hope it will be useful in your learning.
Christmas Tree Theme With Open Code To See Pine ScriptI had been trying to code a predictive algorithm working with sine waves, but I got distracted and made some snow and Christmas trees lol. I'm uploading this with the source code because I'm sure someone will be able to learn from it to create something useful.
Please follow me for some actual useful pine scripts and merry Christmas! :)

CryptoSnaxAllinOne > 5 Scripts in 1 > Saving Time and Efficiency5 Scripts in 1 > Saving Time and Efficiency in My Daily Life
Tired of doing those repetivie tasks with Trading View?
- Spending Hours finding Support or Resistance?, Looking for Entry or Exit Signals? Looking for Pivot High/Low?
- Only to do it all again, when changing timeframes or asset!
- Fear Not > My All in One script should help.
Please find an overview of the All in One Script I have been building.
- This is purely for educational purposes.
- This script is not financial advice.
- I hold no responsibility for anyone using this script.
- I do not guarantee lifetime support for this script (if TV update version from 3 to 4, code will need to be updated)
- If you would like to use the script, please message me on TradingView.
- Script One > Give overall direction of trend with
- Script Two > Much Easier to see the Highs and the Lows of the Candles. Easier to Spot Resistance & Support. [Highest High / Lowest Low of Candle/Wick > 20Bars Eitherside)
- Script Three > 1st Confirmation of Pivot High and Low Plot > My 1st Confirmation of High or Low. [Pivot High/Low 20Bars Eitherside > 1st Confirm)
- Script Four > 2nd Confirmation of Pivot High and Low Plot > Entry and Exit > My 2nd Confirmation of High or Low. [Pivot High/Low 10Bars Eitherside > 2nd Confirm)
- Script Five > Plot in the Main Chart Red IF OverBought / Green if OverSold
NOTE > White Support Lines were Manually Drawn. I Drew them from the Script Data. I.e. Looking for Strong Support / Resistance Zones + Possible Fib = Manually Draw and Much Quicker to Make Qualified Decisions on the Probability.

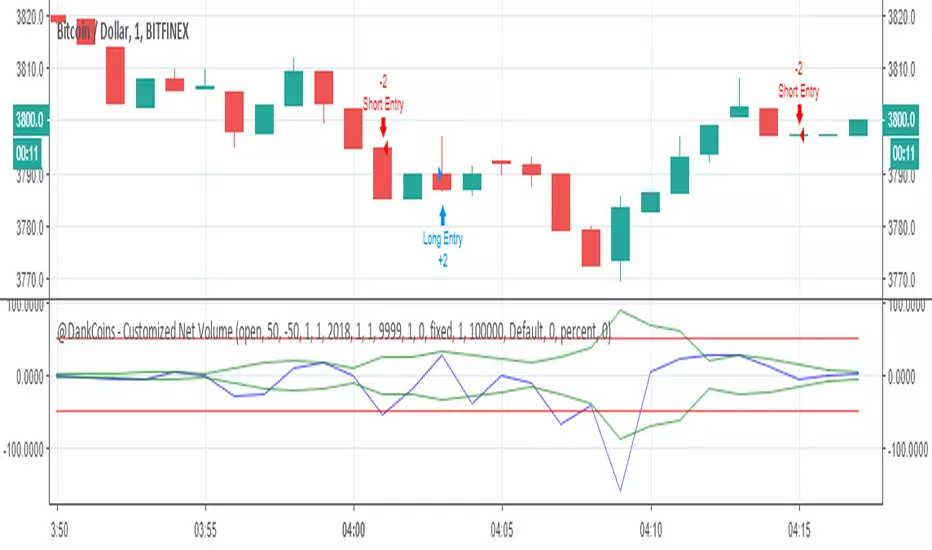
Help Requested - "Time-Slot" Delay for Crossover StrategyHello Tradingview Community,
I've been playing around with some various volume-based indicators, and recently have been experiencing a delay in the entries for my strategy for 2 minutes in this scenario. If the time is adjusted, it also is delayed 2 bars.
In this example, the "Short" position should enter when the blue line Crosses under the upper green line, and visa vera for the "Long" position. A simplified Pine Script is available below as well.
I have Googled this issue and attempted to modify the code with => criteria instead, but too no avail. Would appreciate any help or anyone who could point me in the right direction on this Time Delay Issue. Thanks!
BarstateThe TradingView system has two types of bars. Bars that are historical and bars that are real-time.
When programming complex scripts and strategies that use higher timeframe data there can be difficult programming conditions due to these two bar states.
Especially in the case of after-hours, end of day, low volume trading and thinly traded stocks the bar state status can sometimes be historical and sometimes be real-time in different timeframes or even the same timeframe.
This script displays what state a bar is in by shading the background of the chart.
The script is being made publicly available to help my script users know about and understand 'barstate'. The script allows users to see the 'barstate' in order to help report bugs and conduct their own workarounds.
My testing has indicated that the 'barstate' status is sometimes spurious especially on thinly traded symbols. Additionally, the Tradingview back-end calls the script only after price changes to reduce system load. As a result, these two characteristics can cause unexpected Pine Script results.
Crinkebine
November 2018

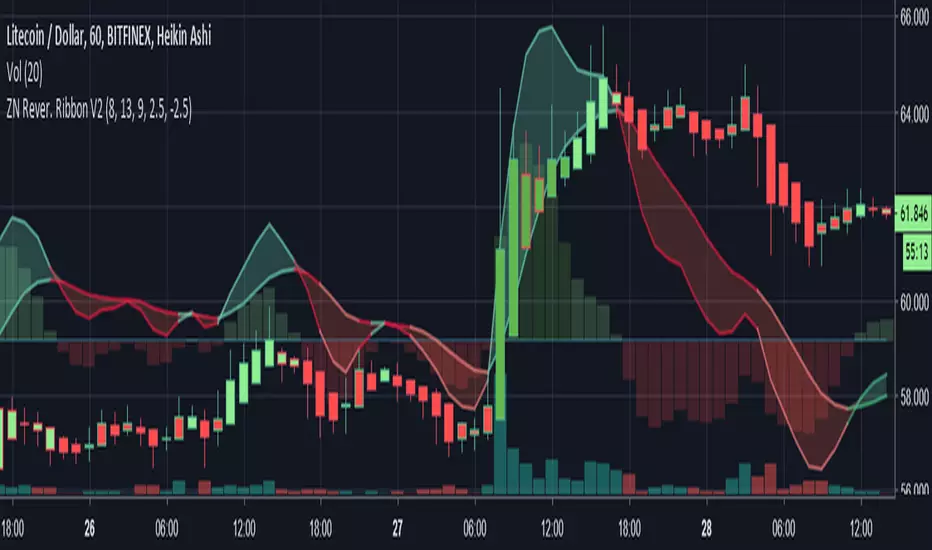
Librehash Reversion Ribbon V2Out of all the indicators created by this brand, this is probably the grandest of them all.
Known as the ‘ZN Reversion Ribbon V2’, for short, this indicator is designed to:
1. Create multiple buy and sell signals
2. Help users gauge the momentum of the price movement.
3. Re-color candles to give users a better understanding of price direction as well as plotting entries and exits.
4. Serve as an enhanced version of the MACD indicator.
5. Effectively gauge buy and sell pressure at any given point in time by using former price data.
There are a lot of moving parts to this indicator, so this guide will be dedicated to dissecting these moving parts, piece by piece.
#1 — Histogram
Perhaps the simplest part of the indicator to dissect at the start is the Histogram. This is also the part of the indicator that can be the most important complement to any other readings that are being made.
You read the histogram in the same manner that you would read the Histogram for the MACD.
The bars in the background are the histogram. Reading this portion of the indicator is fairly simple though.
1. As the green bars get darker, the buy pressure is increasing.
2. As the red bars get darker, the sell pressure is increasing.
3. If the current bar is larger than the last, the trend is sustained. This is the same principle that you would observe in the MACD. The core difference, however, is that this indicator is plugged in with a specific formula (beyond just the basic moving averages), that make them more responsive to price movement in a way that allows for the anticipation of signals being formed.
#2 — Ribbon
The ribbon on this indicator has about 3 different buy/sell signals embedded within it that will allow traders to anticipate an impending change in trend well before it EVER occurs.
This may be the most valuable part of the indicator itself.
Let’s start with the first facet of the ribbon.
A) — The ‘widening’ of the ribbon
When the ribbon ‘expands’, that means that the trend is ‘strengthening’ or growing. When the ribbon narrows or ‘contracts’, that means that the trend is becoming weaker and that this may serve as a warning of impending trend reversal.
In the picture above, you can see the color change of the ribbon itself as well.
You’ll notice that the ribbon transitions from a darker red to a lighter red. That’s a sign of waning sell pressure. You can apply this concept to the green portion of the ribbon too.
B)— The Line Sometimes Signals Before the Cross
This one is a bit harder to explain, but the way that the indicator is programmed is not to turn ‘green’ or ‘red’ based on the crosses, but rather on a mathematical formula.
Now, because of the way the indicator is programmed, the cross often coincides with the color change — but not always.
Below is an example:
Of course, beyond this, there are the usual buy and sell signals that come with the MACD as well.
For instance, there is —
C) The Change in Direction of the is a ‘Buy’ or ‘Sell’ Signal As Well
--------------
Changes in the Candle Colors
Perhaps the most elaborate part of this indicator is the fact that it changes the colors of the candles on the chart in live time without repainting.
In order to understand the candles, here’s a quick guide:
a) dark green with green outline = extreme buy pressure
b) lighter green with green outline = normal buy pressure
c) dark red = heavy sell pressure
d) light red = light sell pressure
e) dark green with red outline = impending reversal downward
f) purple with any outline = ambiguous / neutral
g) light green with red outline = very, very weak sell pressure
h) dark green with red outline = exhausted buy pressure
f) dark red with green outline = exhausted sell pressure
Effectiveness of Indicator
This indicator has the ability to be a ‘game changer’ in terms of its ability to dissect price action.
This next picture is another awesome example of how this indicator works.
Check it out:
Here are the multiple reasons why we could’ve anticipated the reversal in price direction before red candles started showing up:
1. The actual reversion lines themselves began to converge.
2. The Histogram is declining.
3. The bar colors move from dark green to light green.
Now, you may be looking at the above picture and thinking, ‘Well it seems that it didn’t catch the major upswing in the price later though’.
This is true, however —
The gain from this move was preposterous.
Even still, the indicator ensures that we still garner some pretty significant profits.
Conclusion
What you see here sums up this indicator for the most part. However, there are continued updates that will be put out for the indicator in the near future as well.
As always, these can be pushed directly through TradingView (which will happen soon).
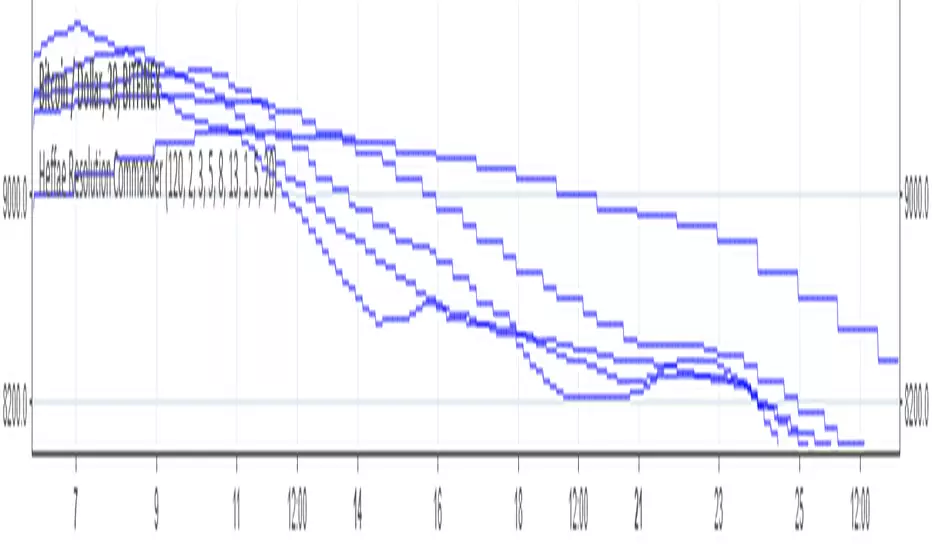
Heffae Resolution Commander (RAW)This is a script to call resolutions with some math on top of your base resolution.
Using the modulo operator to quantize integer values, it works by converting the modified resolution integer to a 4 digit string value.
Use the function within your own scripts to call funny resolutions otherwise difficult to calculate.
You cannot add series expressions to the resolution value since pine does not allow "series" as a resolution for a security call
However, you could easily stack a crapload of these together and use an expression to switch the referenced security function for your purposes.
This is the raw timeframe output as integer, not string.
To go back to string outputs (for use in security calls etc) unslash line 52 //resvalue
For those interested in the verbose version of the timeframe mod function, showing all the steps, here is a pastebin:
pastebin.com
Cheers! Drop a line / comment if you enjoy or have any questions on how to integrate this into your script@!
The Modulo operator is so much fun!
Heffae Resolution CommanderThis is a script to call resolutions with some math on top of your base resolution.
THIS IS NOT AN INDICATOR TO USE ON A CHART!!! The resolution call function is really useful for your own scripting ideas!
Using the modulo operator to quantize integer values, it works by converting the modified resolution integer to a 4 digit string value.
The function within this script is what is valuable, use it within your own scripts to call funny resolutions otherwise difficult to calculate.
You cannot add series expressions to the resolution value since pine does not allow "series " as a resolution for a security call
However, you could easily stack a crapload of these together and use
an expression to switch the referenced security function for your purposes.
The SMA and plot overlay are just there to show a visual example of how the function works.
You can view the raw timeframe output integer by getting rid of tostring(x) and // out the security calls,
plotting the raw function outputs.
For those interested in the verbose version of the timeframe mod function, showing all the steps, here is a pastebin:
pastebin.com
Cheers! Drop a line / comment if you enjoy or have any questions on how to integrate this into your script@!
The Modulo operator is so much fun!
CM_Ultimate_MA_MTF_V2 with Alert Long and Short Hello All,
Here is a scirpt of ChrisMoody modified with the alerts of purchases and sales.
I just have a problem with automation. At the bottom of my script my alerts "Buy1" and "Sell2" give alerts constantly and I wish to have a single alert before the order is completed. Before "Sell1" or Buy2 ".
I found the function "barstate.isfirst" that could possibly work?
Does anyone have an idea ? :)

Script functionality test - work in progress (2RS + BB + MA)This is the first script I've written. Its sole purpose is to make me learn a bit of pine script. Its not intended to trade live.
Feel free to modify it if you wish and let me know if you do it. Also any comments are welcome!
Also i need help in two things:
1. Im unable to print the "in-strategy" rsi on chart
2. I want to ignore the first buy signal after each sell. I was looking to ad a counter to the signals but im unable to do it.
Any help will be greatly appreciated!

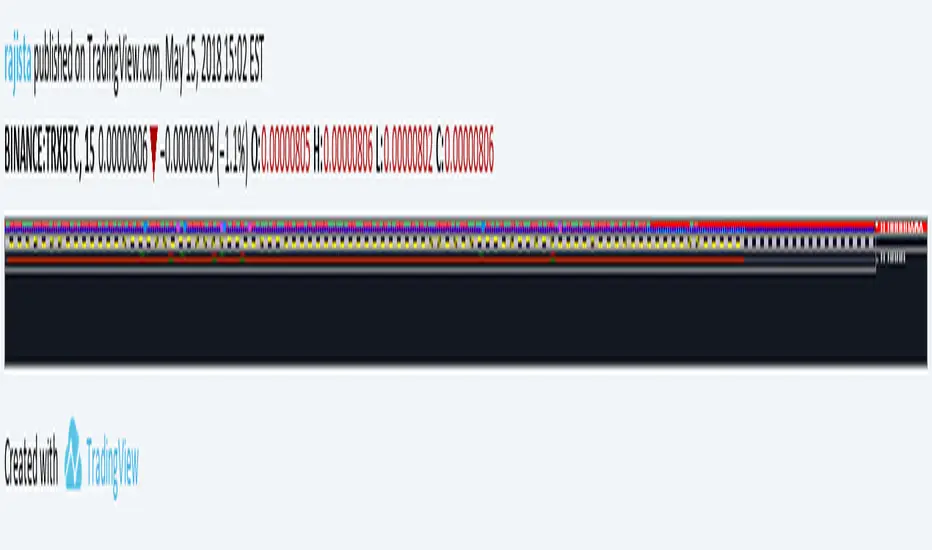
EMAcrossover_RSI Buy/sell signal-TRXBTC_15min by rajista EMAcrossover_RSI Buy/sell signal Strategy
To be used in combination with Alerts script, both can be added to your tradingview charts (Chart time-frame should be set to 15min) like you add any other simple indicator.
Add this script to your favorites and once you have been granted access, you will be notified in your Tradingview notifications section, then you can go ahead and add these two scripts into your charts from your favorite section of Indicator menu in Tradingview.
Benefits of this strategy:
1> Fully automated buy/sell signals 24x7
2>Your trades will always be based on a certain entry and exit plan.
3>No emotions involved with these trading calls, so no chance of FOMO buying/Panic Sell
4>You can fully customize the settings with a simple click(customization details given below)
5>Its completely free of cost!!!
There are two parts of this automated trading call system:
1>Strategy script- Gives the buy/sell signals based on the settings provided.
2>Alert script- Gives Alert notifications in tradingview when a buy/sell call is made.
Principle of working is very simple to understand:
Stragey script makes:
Buy call - When the 9EMA crosses above the 21EMA or RSI level-20 is reached in 15min-Chart.
Sell call -When 9EMA crosses below the 21EMA or RSI level-70 is reached in 15min-Chart.
Above values of EMA's and RSI are default values , which can be changed easily in settings panel of Strategy script.
Alert Script allows you to add Alerts when these buy/sell calls are made.
To create a Buy call alert:
1> Click on the create alert icon in your chart (top-centre)
2>Click on Condition -drop down button and select EMAcross_rsi_Alerts
3>Below that bar you will see another bar titled "Buy"-click on its drop down menu and select "Crossing Down"
4>Below that bar right next to Value change 0 to 0.9.
5>Set expiration date for your alerts as per your wish
6>Ensure "Show Popup" and "Play sound" is checked
7>You can check option of sending the alert to your email also.
Finally click on create.
To create Sell Alert:
Repeat same process, except that, after step 2- Do this- change the "long" option to "short" by clicking on the drop down menu right next to the first bar.
Click on create, Finally both of your automated buy/sell call alerts will be configured.
I know its been 2-3 days since i tweeted about this strategy and now i am making it available, you can understand i had to put in a lot of working hours, towards creating the source code for the strategy script and then for alerts script and even more so towards finding the perfect default settings which can be used straight away by anyone, even if you are new in crypto trading, apart from the time which i dedicate to analyse charts and pass on the knowledge/info to you all.
My next post will be even more helpful to you people as i am currently testing "fully automated trading" yea you heard that right!! - This system will trade 24x7 for you guys/girls no matter wherever you are either you are sleeping or watching a movie, your trades would still be getting executed with a proper entery-exit plan on a crypto exchange.
Volume & Intraday ScriptI am still learning pinescript, and part of this was created using the Pine Script language reference manual. This includes looking at the time series, a fixed length, and the default intraday_loss variables. This also includes the basic fixed lengths for an swma (Symmetrically weighted moving average) and the script to start creating a strategy. All in all this is just a basic sample of pinescript that you can customize for your trading needs. This can work with Cryptocurrency but these moving averages usually work more efficiently for forex.
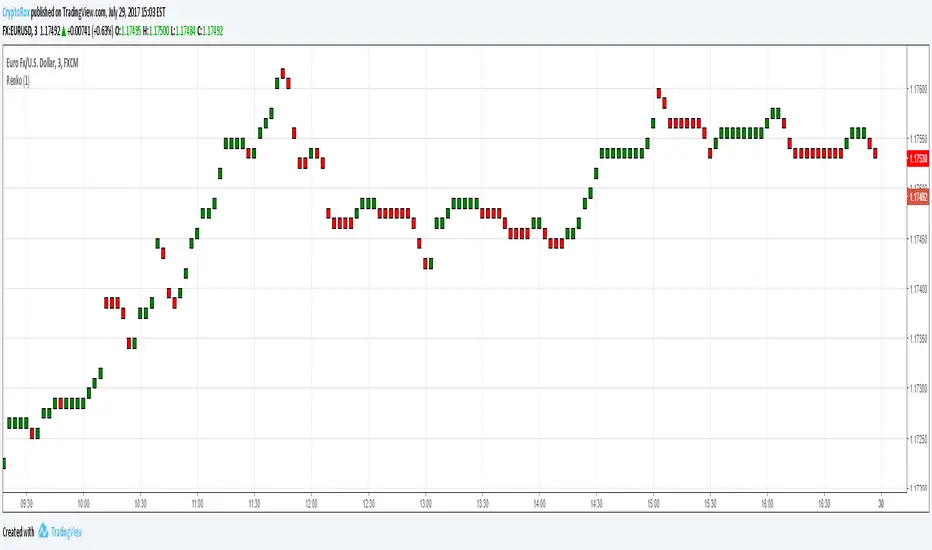
Renko CandlesThis is a script to place Renko candles on your chart alongside another candle type or more importantly, using the variables from this script, you can build a strategy using Renko candles that will depict true/proper entries and exits in a strategy when using the backtest feature.
We hope this helps!
Pine Script Tutorial #2In this second tutorial we build upon the previous tutorial. We add color shading for each different day and highlight Wednesday.
The idea here is to manually count if on Wednesdays close is bigger then open.
Hope it helps.
Feel free to comment.
MartinMystere

My Tutorial #1If you are just like me and cant just get your head around pine script, I have created this simple code so you get the main concept.
Unfortunately there are no good step by step tutorials out there teaching scripting.
Hope this helps.
Comments are welcome.
MatinMystere
