Sharpe Ratio [Alpha Extract]A sophisticated risk-adjusted return measurement system that calculates annualized Sharpe Ratio with dynamic color-coded visualization distinguishing return quality across positive and negative performance regimes. Utilizing rolling period calculations with smoothed moving average comparison, this indicator delivers institutional-grade performance assessment with overbought/oversold threshold detection for extreme risk-adjusted return conditions. The system's four-tier color classification combined with histogram fills and background highlighting provides comprehensive visual feedback on whether current returns justify their volatility risk across varying market cycles.
🔶 Advanced Sharpe Ratio Calculation Engine
Implements classic Sharpe Ratio methodology measuring mean daily return divided by return standard deviation with annualization factor for consistent interpretation. The system calculates daily percentage returns, computes rolling mean and standard deviation over configurable periods, applies square root of 365 scaling for annualized comparison, and generates unbounded ratio values where higher positive readings indicate superior risk-adjusted performance.
// Core Sharpe Ratio Framework
Daily_Return = close / close - 1
Mean_Return = ta.sma(Daily_Return, Period)
StdDev_Return = ta.stdev(Daily_Return, Period)
Sharpe_Ratio = (Mean_Return / StdDev_Return) * sqrt(365)
🔶 Dynamic Four-Tier Color Classification
Features sophisticated color logic distinguishing between strong positive returns (green), weakening positive returns (yellow), weakening negative returns (orange), and strong negative returns (red) based on relationship to smoothed average. The system compares current Sharpe against SMA-smoothed baseline, applying green when positive and accelerating, yellow when positive but decelerating, orange when negative but improving, and red when negative and deteriorating for nuanced regime assessment.
🔶 Smoothed Baseline Comparison Framework
Implements SMA smoothing of Sharpe Ratio with configurable period to establish momentum reference line for trend determination within risk-adjusted returns. The system calculates simple moving average of raw Sharpe values, uses this smoothed line as directional benchmark, and determines whether current risk-adjusted performance is strengthening or weakening relative to recent average for color classification logic.
🔶 Extreme Threshold Detection System
Provides overbought and oversold level identification with configurable upper and lower bounds marking exceptional risk-adjusted return extremes. The system defaults to +4.3 for overbought threshold (extremely favorable risk-return profile) and -2.3 for oversold threshold (severely unfavorable risk-return profile), applying dashed horizontal reference lines and background highlighting when Sharpe breaches these statistical extremes requiring attention.
🔶 Histogram Fill Visualization Architecture
Creates gradient-filled histogram between Sharpe Ratio line and zero baseline using dynamic color matching with 30% transparency for intuitive positive/negative return distinction. The system fills area above zero with bullish colors (green/yellow) and below zero with bearish colors (orange/red), providing immediate visual confirmation of whether returns are compensating for volatility risk or destroying risk-adjusted value.
🔶 Background Zone Highlighting Framework
Implements subtle background coloring when Sharpe enters extreme overbought or oversold zones, alerting traders to statistically significant risk-adjusted return conditions. The system applies semi-transparent red background when ratio exceeds +4.3 (exceptionally strong risk-adjusted returns potentially unsustainable) and green background when below -2.3 (severely poor risk-adjusted returns potentially reversionary), creating visual alerts without obscuring price action.
🔶 Annualization Methodology Integration
Utilizes standard square root of time scaling (sqrt(365)) to convert rolling period Sharpe calculations into annualized format for cross-temporal comparison. The system applies this mathematical transformation ensuring Sharpe values represent expected annual risk-adjusted returns regardless of calculation period length, enabling consistent interpretation whether using 100-day or 200-day rolling windows.
🔶 Zero-Line Reference System
Provides critical zero-line plot serving as boundary between positive risk-adjusted returns (capital allocation justified by return/risk profile) and negative risk-adjusted returns (strategy destroying value on risk-adjusted basis). The system emphasizes this threshold as decision point where values above zero suggest continuation while values below zero indicate reconsideration of exposure.
🔶 Momentum-Based Color
Transitions Implements intelligent color switching logic that considers both absolute Sharpe value and its momentum relative to smoothed average, creating four distinct regimes for granular performance assessment. The system enables identification of bullish acceleration (green), bullish deceleration (yellow), bearish improvement (orange), and bearish acceleration (red) for nuanced position management beyond simple positive/negative classification.
🔶 Configurable Period Optimization
Features adjustable calculation period and smoothing length enabling optimization across different trading timeframes and volatility regimes. The system defaults to 150-period calculation (approximately 6-7 months of daily data) with 30-period smoothing, but allows customization from short-term tactical assessment to long-term strategic evaluation based on investment horizon and strategy requirements.
🔶 Performance Optimization Framework
Employs efficient rolling calculations with streamlined daily return processing and optimized standard deviation computation for smooth real-time updates. The system includes minimal computational overhead through single-pass mean and variance calculations, enabling consistent performance across extended historical periods while maintaining accuracy of risk-adjusted return measurements.
This indicator delivers sophisticated risk-adjusted return analysis through classic Sharpe Ratio methodology with enhanced visual classification distinguishing return quality and momentum. Unlike simple return-focused indicators, Sharpe Ratio penalizes volatility ensuring traders evaluate whether returns justify the risk undertaken. The system's four-tier color coding, smoothed baseline comparison, and extreme threshold detection make it essential for portfolio managers and systematic traders seeking objective performance assessment beyond raw price gains. High positive Sharpe values indicate efficient return generation relative to volatility risk, while negative values signal value destruction on risk-adjusted basis requiring strategy reassessment. The indicator excels at identifying periods when risk-taking is rewarded (green zones) versus periods when volatility exceeds returns (red zones) across cryptocurrency, forex, and equity markets for optimal capital allocation decisions.
Overboughtoversold

Baseline Deviation Oscillator [Alpha Extract]A sophisticated normalized oscillator system that measures price deviation from a customizable moving average baseline using ATR-based scaling and dynamic threshold adaptation. Utilizing advanced HL median filtering and multi-timeframe threshold calculations, this indicator delivers institutional-grade overbought/oversold detection with automatic zone adjustment based on recent oscillator extremes. The system's flexible baseline architecture supports six different moving average types while maintaining consistent ATR normalization for reliable signal generation across varying market volatility conditions.
🔶 Advanced Baseline Construction Framework
Implements flexible moving average architecture supporting EMA, RMA, SMA, WMA, HMA, and TEMA calculations with configurable source selection for optimal baseline customization. The system applies HL median filtering to the raw baseline for exceptional smoothing and outlier resistance, creating ultra-stable trend reference levels suitable for precise deviation measurement.
// Flexible Baseline MA System
ma(src, length, type) =>
if type == "EMA"
ta.ema(src, length)
else if type == "TEMA"
ema1 = ta.ema(src, length)
ema2 = ta.ema(ema1, length)
ema3 = ta.ema(ema2, length)
3 * ema1 - 3 * ema2 + ema3
// Baseline with HL Median Smoothing
Baseline_Raw = ma(src, MA_Length, MA_Type)
Baseline = hlMedian(Baseline_Raw, HL_Filter_Length)
🔶 ATR Normalization Engine
Features sophisticated ATR-based scaling methodology that normalizes price deviations relative to current volatility conditions, ensuring consistent oscillator readings across different market regimes. The system calculates ATR bands around the baseline and uses half the band width as the normalization factor for volatility-adjusted deviation measurement.
🔶 Dynamic Threshold Adaptation System
Implements intelligent threshold calculation using rolling window analysis of oscillator extremes with configurable smoothing and expansion parameters. The system identifies peak and trough levels over dynamic windows, applies EMA smoothing, and adds expansion factors to create adaptive overbought/oversold zones that adjust to changing market conditions.
1D
3D
1W
🔶 Multi-Source Configuration Architecture
Provides comprehensive source selection including Close, Open, HL2, HLC3, and OHLC4 options for baseline calculation, enabling traders to optimize oscillator behavior for specific trading styles. The flexible source system allows adaptation to different market characteristics while maintaining consistent ATR normalization methodology.
🔶 Signal Generation Framework
Generates bounce signals when oscillator crosses back through dynamic thresholds and zero-line crossover signals for trend confirmation. The system identifies both standard threshold bounces and extreme zone bounces with distinct alert conditions for comprehensive reversal and continuation pattern detection.
Bull_Bounce = ta.crossover(OSC, -Active_Lower) or
ta.crossover(OSC, -Active_Lower_Extreme)
Bear_Bounce = ta.crossunder(OSC, Active_Upper) or
ta.crossunder(OSC, Active_Upper_Extreme)
// Zero Line Signals
Zero_Cross_Up = ta.crossover(OSC, 0)
Zero_Cross_Down = ta.crossunder(OSC, 0)
🔶 Enhanced Visual Architecture
Provides color-coded oscillator line with bullish/bearish dynamic coloring, signal line overlay for trend confirmation, and optional cloud fills between oscillator and signal. The system includes gradient zone fills for overbought/oversold regions with configurable transparency and threshold level visualization with automatic label generation.
snapshot
🔶 HL Median Filter Integration
Features advanced high-low median filtering identical to DEMA Flow for exceptional baseline smoothing without lag introduction. The system constructs rolling windows of baseline values, performs median extraction for both odd and even window lengths, and eliminates outliers for ultra-clean deviation measurement baseline.
🔶 Comprehensive Alert System
Implements multi-tier alert framework covering bullish bounces from oversold zones, bearish bounces from overbought zones, and zero-line crossovers in both directions. The system provides real-time notifications for critical oscillator events with customizable message templates for automated trading integration.
🔶 Performance Optimization Framework
Utilizes efficient calculation methods with optimized array management for median filtering and minimal computational overhead for real-time oscillator updates. The system includes intelligent null value handling and automatic scale factor protection to prevent division errors during extreme market conditions.
🔶 Why Choose Baseline Deviation Oscillator ?
This indicator delivers sophisticated normalized oscillator analysis through flexible baseline architecture and dynamic threshold adaptation. Unlike traditional oscillators with fixed levels, the BDO automatically adjusts overbought/oversold zones based on recent oscillator behavior while maintaining consistent ATR normalization for reliable cross-market and cross-timeframe comparison. The system's combination of multiple MA type support, HL median filtering, and intelligent zone expansion makes it essential for traders seeking adaptive momentum analysis with reduced false signals and comprehensive reversal detection across cryptocurrency, forex, and equity markets.

Impulse Volume Oscillator [Alpha Extract]Impulse Volume Oscillator
A sophisticated indicator designed to identify market impulse moves and volume-based momentum shifts, helping traders capture significant price movements with precision.
Combining price deviations with volume analysis, this oscillator dynamically measures market strength and weakness, providing clear signals for potential trend continuations and reversals.
🔶 Volume-Adjusted Normalization
Utilizes a unique normalization technique that incorporates volume impact to enhance signal quality. This approach ensures the indicator responds more strongly to high-volume price movements while filtering out low-volume noise.
vol_ratio = ta.rsi(volume, 14) / 50
vol_factor = vol_impact > 0 ? 1 + (vol_ratio - 1) * vol_impact : 1
raw_normalized = dev / (ta.stdev(source, bars) * mult)
vol_adjusted = raw_normalized * vol_factor
normalized = ta.sma(vol_adjusted, smooth)
🔶 Adaptive Regime Detection
Incorporates threshold-based regime identification that clearly distinguishes between trending and mean-reverting market conditions. The customizable threshold system allows traders to adapt to different market volatilities and timeframes.
🔶 Customizable Parameters
Fine-tune detection sensitivity with adjustable inputs for lookback period, standard deviation multiplier, volume impact, and signal smoothing. These parameters enable traders to optimize the indicator for various trading styles and market conditions.
❓How It Works
🔶 Impulse Calculation
The oscillator measures price deviation from a moving average baseline, normalized by standard deviation, and then adjusts the signal based on relative volume strength. This creates a responsive yet stable indicator that accurately reflects market momentum.
// Calculate the basis using the selected MA
basis = get_ma(source, bars)
// Calculate the normalized value with volume impact
dev = source - basis
🔶 Dynamic Visualization
The histogram changes color based on signal strength, providing instant visual cues about market conditions. Green bars indicate positive momentum while red bars represent negative momentum, with color intensity reflecting signal strength.
🔶 Trend Confirmation
Built-in trend direction analysis provides confluence with the primary signal, helping traders distinguish between counter-trend bounces and genuine trend reversals. This dual-confirmation approach significantly reduces false signals.
🔶 Visual Alerts & Boundary Tracking
Monitors signal extremes and dynamically adjusts visualization transparency based on signal strength. The indicator highlights particularly strong impulse moves with background shading, making potential trading opportunities immediately apparent.
🔶 Custom Candle Coloring
Optional candle coloring applies the same color logic as the histogram directly to price candles, providing a unified visual framework that helps traders correlate indicator signals with price action.
🔶 Momentum Shift Detection
Automatically identifies important zero-line crossovers that often signify the beginning of new impulse moves. These transition points frequently offer favorable risk/reward entry opportunities.
🔶 Snapshot samples
1 Week
1 Day
15 Min
🔶 Why Choose AE - Impulse Volume Oscillator?
This indicator provides a comprehensive approach to identifying significant market moves by combining volume analysis with price momentum. By offering clear visual signals for both trend continuation and reversal scenarios, it empowers traders to make more informed decisions across various market conditions and timeframes.

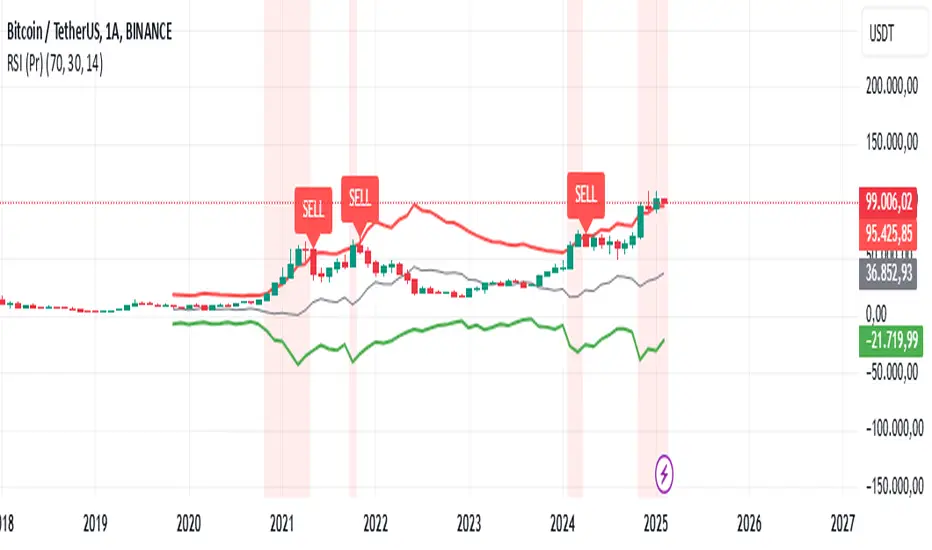
RSI (Pr)The "RSI (Pr)" indicator enhances the traditional Relative Strength Index (RSI) by incorporating dynamic bands and highlighting extreme market conditions directly on the price chart. This approach offers traders a more intuitive visualization of potential overbought and oversold zones, facilitating timely decision-making.
Key Features:
Dynamic RSI Bands: The indicator calculates upper and lower bands based on user-defined overbought and oversold levels. These bands adjust in real-time, providing a responsive measure of market extremes.
Visual Alerts: Background colors change when the price moves outside the RSI bands, offering immediate visual cues of potential market reversals.
Buy/Sell Signals: The script places "BUY" and "SELL" labels on the chart when the price crosses above or below the RSI bands, assisting traders in identifying potential entry and exit points.
How It Works:
RSI Calculation: The script computes the RSI based on the closing price and a user-defined length (default is 14 periods).
Exponential Moving Averages (EMA): It calculates the EMA of the maximum gains and losses to smooth out the data, enhancing the reliability of the RSI bands.
Upper and Lower Bands: Using the smoothed data, the script determines the upper (resistance) and lower (support) bands, which represent dynamic overbought and oversold levels.
Visual Indicators: The script plots the upper and lower bands, as well as a midline, directly on the price chart. Background colors change when the price exceeds these bands, and "BUY" or "SELL" labels appear at crossover points.
Usage:
Overbought Conditions: When the price crosses above the upper band, it may indicate an overbought condition, suggesting a potential selling opportunity.
Oversold Conditions: When the price crosses below the lower band, it may indicate an oversold condition, suggesting a potential buying opportunity.
Customization:
Users can adjust the following parameters to suit their trading preferences:
RSI Overbought Level: Default is 70.
RSI Oversold Level: Default is 30.
RSI Length: Default is 14 periods.
Disclaimer:
This indicator is designed for educational purposes and should not be construed as financial advice. Trading involves significant risk, and it's essential to conduct thorough research and consider your financial situation before making trading decisions. Past performance is not indicative of future results.
By integrating dynamic RSI bands and clear visual signals directly onto the price chart, this indicator aims to provide traders with actionable insights into market conditions, enhancing the traditional RSI analysis.