Overbought Oversold CandlesA simple script that indicates the overbought and oversold area of the rsi by coloring the candlesticks
Overbought-oversold

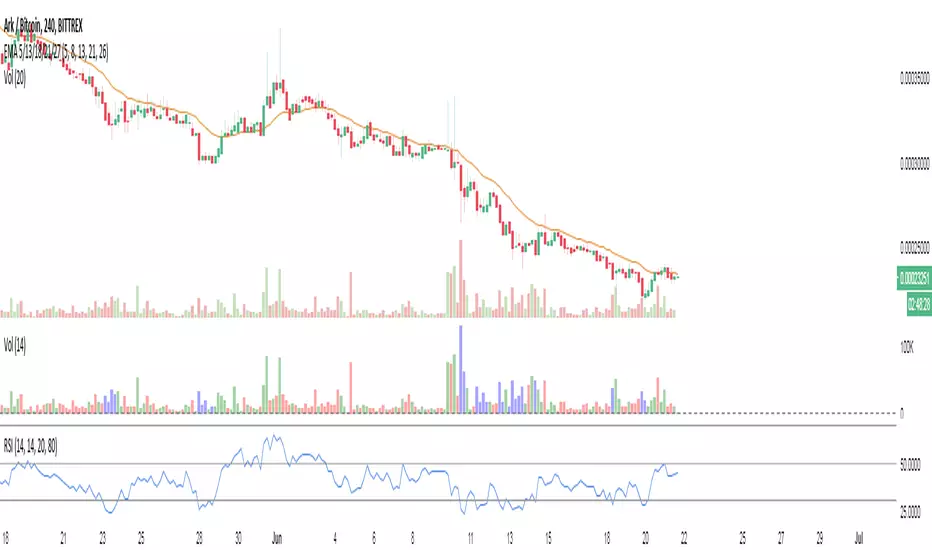
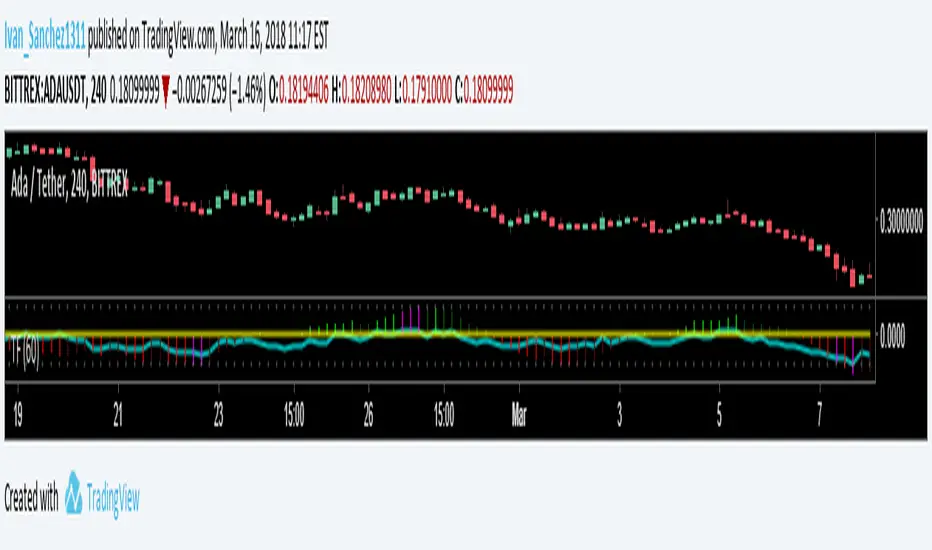
Volume/Rsi Overbought/oversoldI present you my last indicator. A volume indicator that indicates overbought and oversold based on the rsi, I chose the rsi because the most used surment, this indicator allows you to identify the overbought and oversold areas of the rsi with the colors blue (oversold) and orange (overbought ) on the volume indicator! Hoping that you are useful
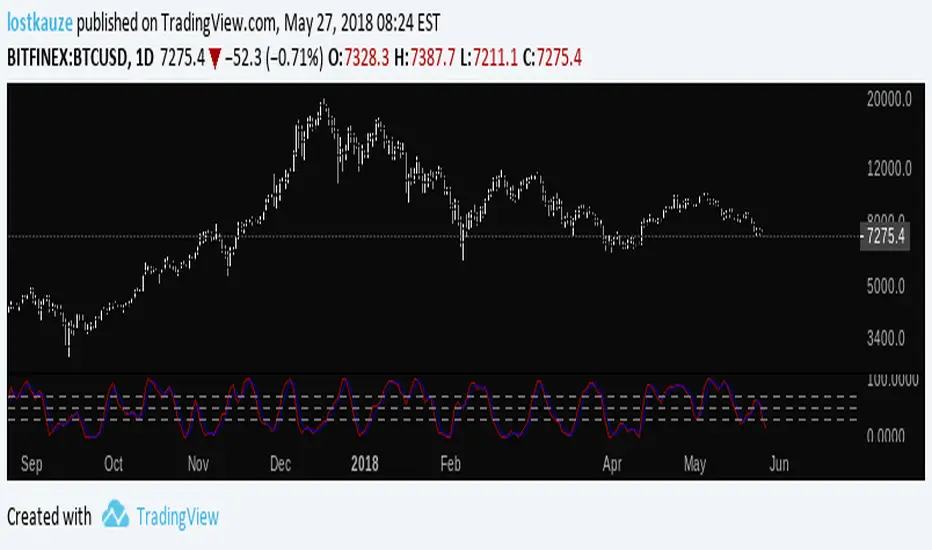
Stoch BitfinexSimilar to RSI Bitfinex , but Stoch version.
It applies Stochastic Oscillator to BTC longs/shorts ratio on Bitfinex. You can use the oscillator as you'd use Stoch:
- Divergences
- Oversold/overbought signals
- R/S on the indicator
- Trend indication
- etc
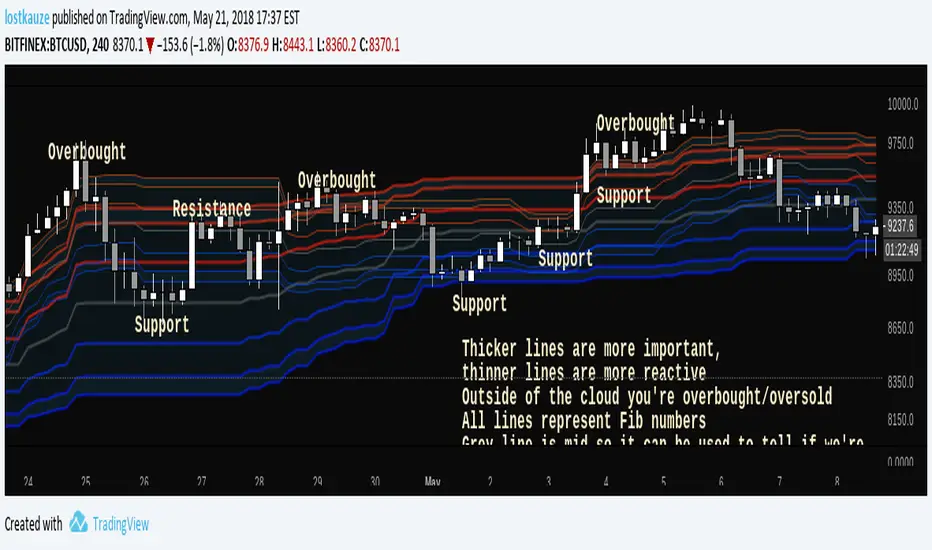
Fibonacci CloudInspired by Ichimoku Fibonacci Hybrid , this indicator is for those who don't mind a lot of lines. All lines represent Fib ratios: thicker lines are fibs for a longer period, while thinner lines are fibs for a shorter period.
- Dynamic S/R
- Overbought/Oversold zones
- Trend indicator
- Customisable periods
- Fast/Slow crossovers
See what works for you!
Ichimoku Fibonacci HybridHey guys, this is a variation of Ichimoku using Fibonacci principles.
Overview
As you may know, Ichimoku uses in its calculations (high + low)/2 to calculate Tenkan-sen (Conversion line) and Kijun-sen (Base line) for different periods: Tenkan is a shorter period, so it reacts faster to reversals, while Kijun is slower, so it reacts slower, and it is contextually more reliable due to how conservative it is.
Why does the Ichimoku Cloud works? My theory that inspired this indicator is that it works because it looks at 50% retracements from highest point to the lowest point. In other words, Tenkan plots the 50% line between the peak and the trough from the recent period, which has proven to often be a good estimation for retracements. Similarly, Kijun applies the same, but for a longer period*.
However, if we look at Fibonacci retracement, it is often the case that price retracts to those magical percentages: 23.6%, 38.2%, 50%, 61.8%, and sometimes even 88.6% and 78.6%. Why this happens is largely unknown to the academic community, but, empirically, it often seems that these numbers just work.
Therefore, I wanted to apply this principle to Ichimoku calculations, and instead of calculating (high + low)/2, I calculated both (high + low) * 0.382 and (high + low) * 0.618. These lines should provide pessimistic/bearish estimations, and optimistic/bullish estimations, respectively. Naturally, these results in 4 extra lines: a bearish Tenkan/Kijun pair and a bullish Tenkan/Kijun pair.
Therefore, applying this indicator will crowd the chart quite a bit: you have 6 lines on the chart among which 2 of them are the original Tenkan and Kijun lines, and the other 4 are Fib-inspired Tenkan/Kijun lines.
Usage
As with most indicators, usage is subjective to the user and relative to the chart. However, some ways in which this indicator can be used are as follows:
In a strong uptrend, price is typically above both Ichi Kijun and Tenkan. In this case, you can use this indicator to provide you with a new pair of bullish Kijun/Tenkan that provide the same usage as before. Similarly, in a downtrend, the bearish Kijun/Tenkan apply.
Using the new lines, one can apply R/S levels, crossover signals, overbought/oversold areas, price channels, retracement levels, and trend indications.
One may simply use it out of convenience, as it automatically computes potential areas of interest without having to perform manual work.
Please note that because the indicator was so full, I did not keep the Cloud, nor did I keep the Chikou span (Lagging span.) These can be easily implemented, but it would crowd the chart to an extent that it would be difficult to gauge much information. However, I did consider adding them as optional indicators that are disabled by default, and I may potentially do so in the future. For reference, this would help by simply disabling everything else besides the "bullish Ichi" in an uptrend.
Footnotes
* I have heard people referring to Ichimoku Cloud as "a glorified average mean," but, mathematically, I don't believe there is much relationship between MAs and Ichimoku Cloud. However, I acknowledge the visual similarity between the two and the potential to use both in a similar fashion, so one may interpret this indicator as such if they please.

RSI Plus (RSI+)Same RSI you love, but with a candle highlighter, control over Overbought & Oversold Line placement, and Alert Conditions for Overbought & Oversold, built right in.
Set the Overbought/Oversold Lines anywhere you want... use them to create RSI+ Alerts.

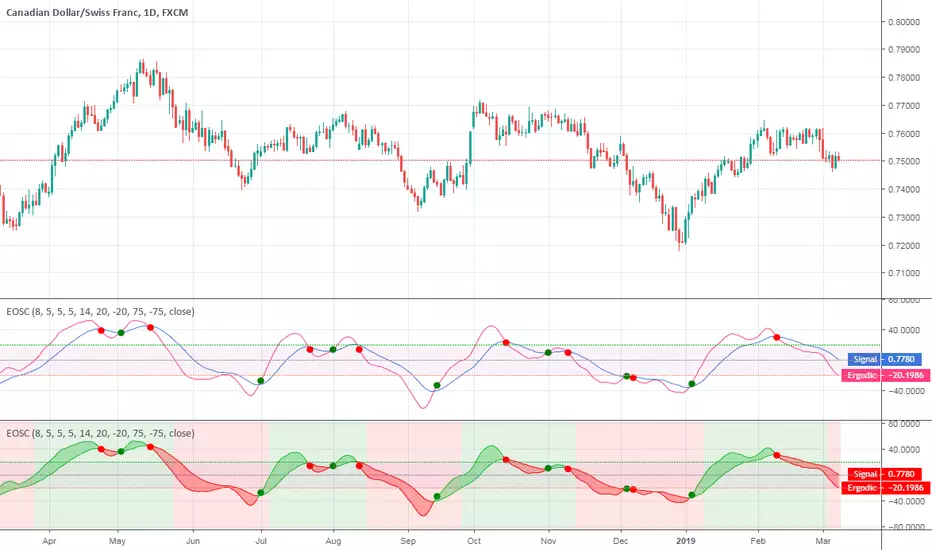
Ergodic OscillatorErgodic Oscillator indicator script.
Ergodic Oscillator is based on True Strength Index (TSI) by William Blau.
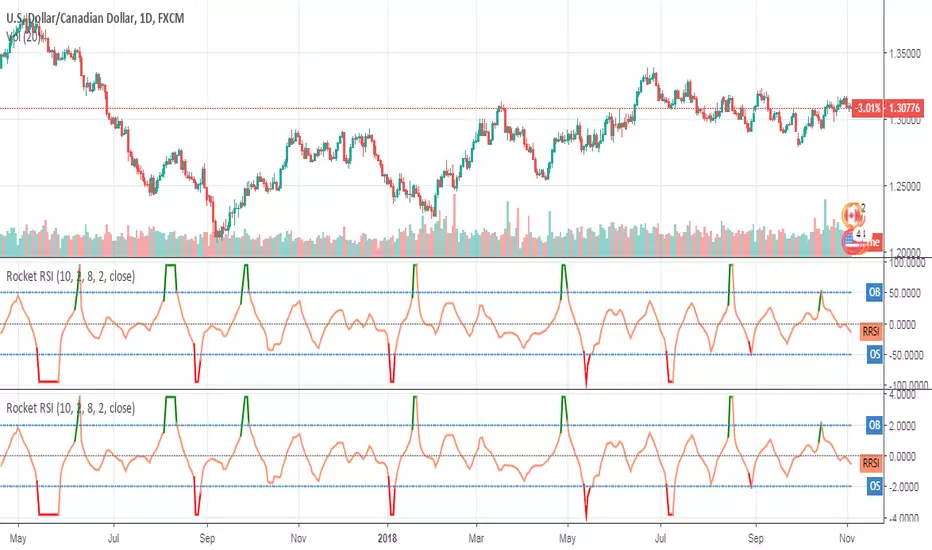
Rocket RSIRocket RSI indicator script.
This indicator was originally developed by John Ehlers (Stocks & Commodities V.36:6, RocketRSI - A Solid Propellant For Your Rocket Science Trading).
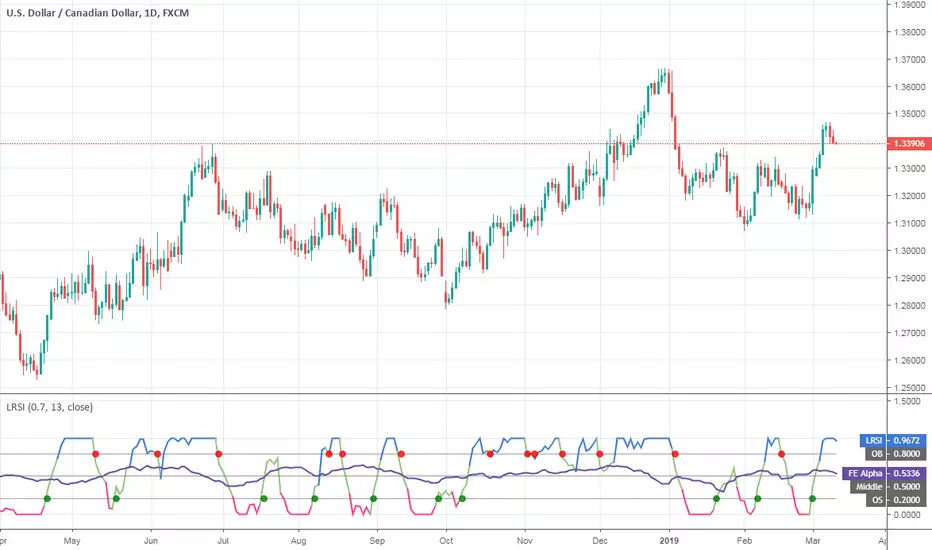
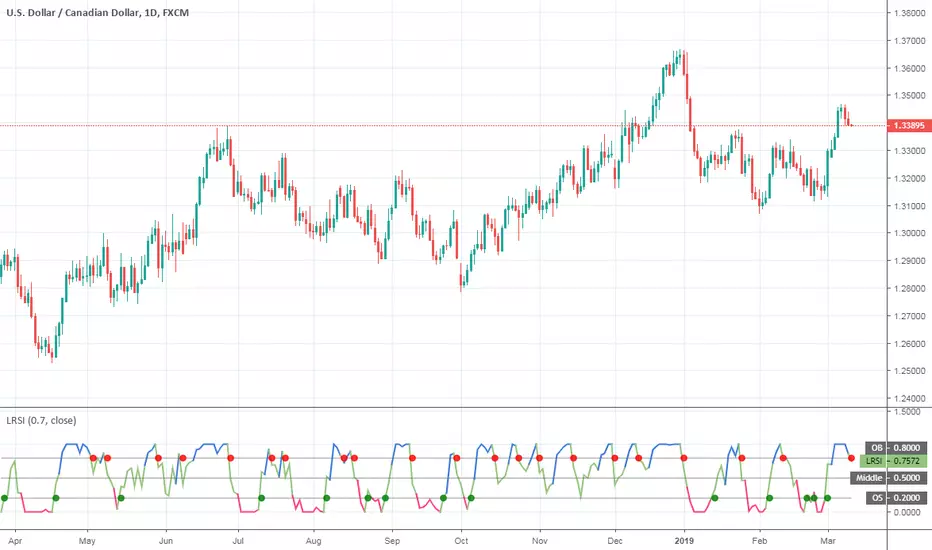
Laguerre RSI (Self Adjusting Alpha with Fractals Energy)Laguerre RSI (Self Adjusting Alpha with Fractals Energy) indicator script. I adopted idea from www.prorealcode.com and
If you disable `Apply Fractals Energy` option, you will get the original Laguerre RSI.
Relative Volatility IndexCorrected Relative Volatility Index. This indicator was originally developed by Donald Dorsey (Stocks & Commodities V.11:6 (253-256): The Relative Volatility Index).
The indicator was revised by Dorsey in 1995 (Stocks & Commodities V.13:09 (388-391): Refining the Relative Volatility Index).
I suggest the refined RVI with optional settings. If you disabled Wilder's Smoothing and Refined RVI you will get the original version of RVI (1993, as built-in).
Also, you can choose an algorithm for calculating Standard Deviation.

Rova MTF SMI MinuteStochastic Momentum Index is used to find oversold and overbought zones. It also helps to figure out whether to enter short trade or long trade.
Red Shade in the Top indicates that the stock is oversold and the Blue shade in the bottom indicates overbought.
The lighter color indicates that the trend is continuing while the darker color indicates the trend is reversing.
This indicator shows 3 Stochastic Momentum Index of 3 different Time Frames (with 1 minute as their base resolution) in one windows.

Relative Momentum IndexRelative Momentum Index indicator script. This indicator was originally developed by Roger Altman (Stocks & Commodities V. 11:2 (57-60)).
RMI with momentum period of 1 will be equal to an RSI when they have the same period and source price.

Trend FollowerTrend Follower (Follower)
The Trend Follower is a powerful trading tool, which helps us to control our operations.
This tool performs different calculations based on market movements, so it becomes a very versatile and reliable indicator.
This indicator tells us NOT to do and at what time it is prudent to leave an operation or take a share of profits.
If you have any questions, please let me know by private chat.
Regards!
CMYK RMI◊ Introduction
I started using this script because of its fast reaction, and good tell for buy/sell moments on a short timescale.
For larger timescales, the overall trend should be taken into account regarding the levels.
In the future i will update this indicator, to automatically adjust those.
◊ Origin
The Relative Momentum Index was developed by Roger Altman and was introduced in his article in the February, 1993 issue of Technical Analysis of Stocks & Commodities magazine.
While RSI counts up and down days from close to close, the Relative Momentum Index counts up and down days from the close relative to a close x number of days ago.
This results in an RSI that is smoother.
◊ Adjustments
CMYK color theme applied.
Four levels to indicate intensity.
Two Timescales, to overview the broader trend, and fast movements.
◊ Usage
RMI indicates overbought and oversold zones, and can be used for divergence and trend analysis.
◊ Future Prospects
Self adjusting levels, relative to an SMA trend.
Alternative RMI, which functions as an overlay.
◊ ◊ ◊ ◊ ◊ ◊ ◊ ◊ ◊ ◊ ◊ ◊ ◊ ◊ ◊ ◊ ◊ ◊ ◊ ◊ ◊ ◊ ◊ ◊ ◊ ◊ ◊ ◊ ◊ ◊ ◊ ◊ ◊ ◊ ◊ ◊ ◊ ◊ ◊ ◊ ◊ ◊ ◊ ◊ ◊ ◊ ◊ ◊ ◊ ◊ ◊ ◊ ◊ ◊ ◊ ◊ ◊ ◊ ◊ ◊ ◊ ◊ ◊ ◊ ◊ ◊ ◊ ◊ ◊ ◊ ◊ ◊ ◊ ◊ ◊ ◊ ◊ ◊ ◊ ◊ ◊ ◊ ◊ ◊ ◊ ◊ ◊ ◊ ◊ ◊ ◊ ◊ ◊ ◊ ◊ ◊ ◊ ◊ ◊ ◊ ◊ ◊ ◊ ◊ ◊ ◊

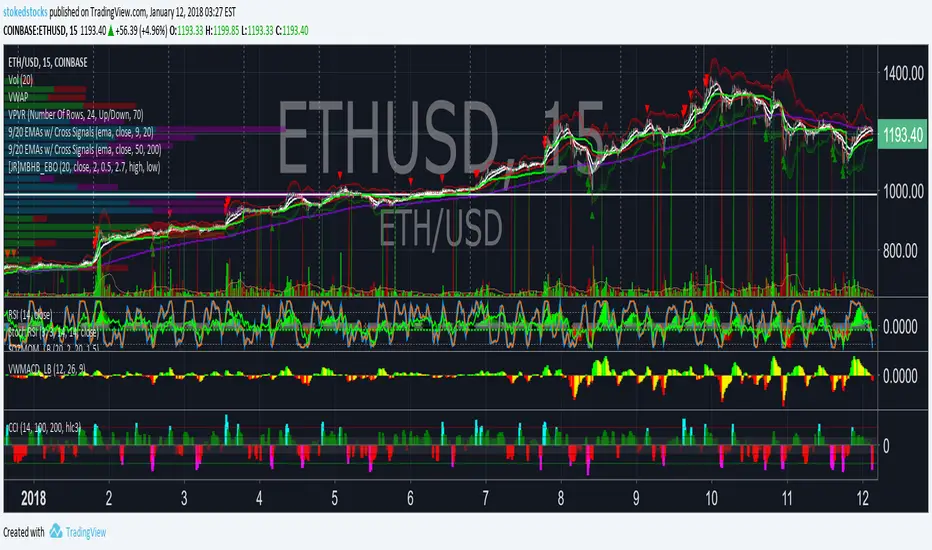
CCI Histogram w/ Color STOKEDSTOCKSCCI Histogram w/ Color Has EMA option to calculate CCI STOKEDSTOCKS
Finds oversold and Overbought conditions
stochifyStochastic RSI reflected in candles. Adds an element of caution when overbought, and an element of opportunity when oversold. BTFD.

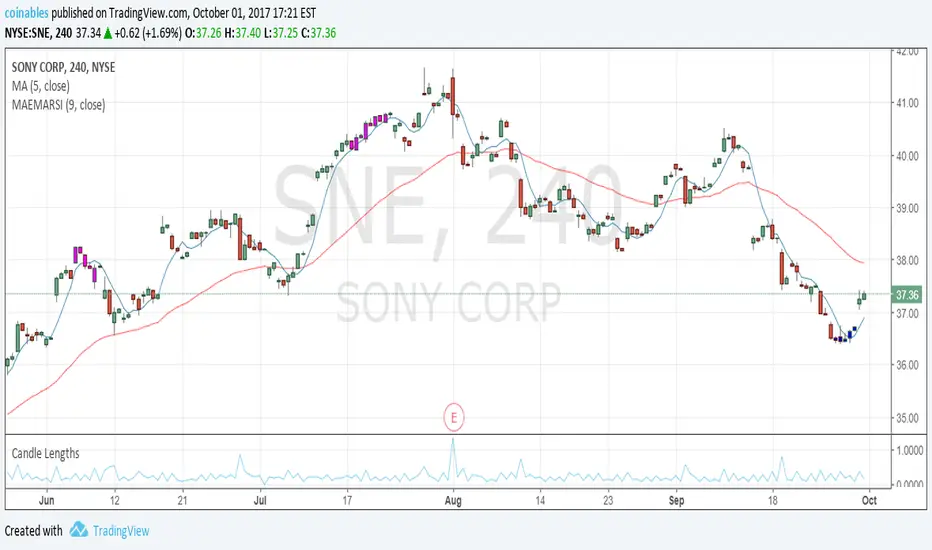
MA EMA RSICombining EMA and MA over-extension with RSI to help narrow down overbought and oversold opportunities.
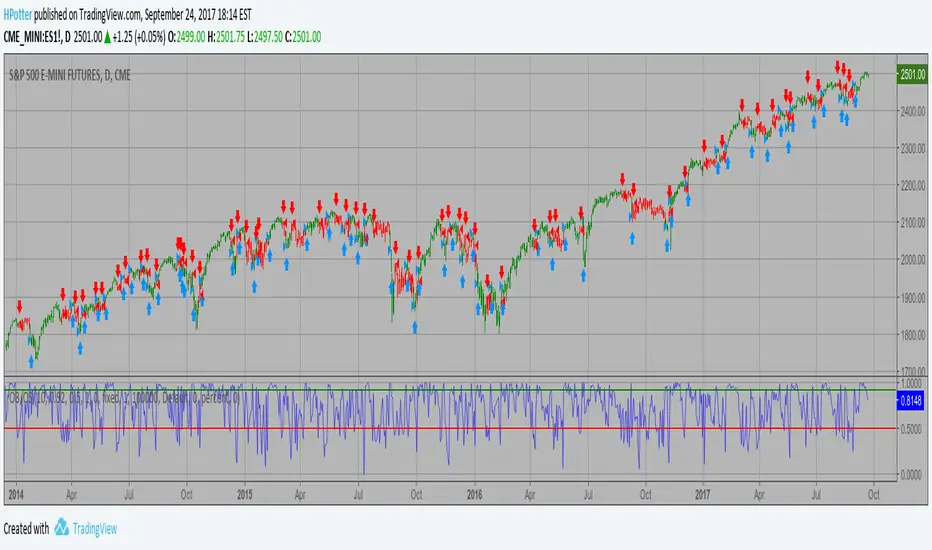
Overbought/Oversold Simple Overbought/Oversold indicator
You can change long to short in the Input Settings
WARNING:
- For purpose educate only
- This script to change bars colors.
Overbought/Oversold Simple Overbought/Oversold indicator
WARNING:
This script to change bars colors.

Colored Williams %RThis script is the same as Williams %R except that on green days we plot green and red on red days. If a bar opens and closes the same, we plot black.

Number Indicatorbased on indicator created by coinsheet.org created by autemox
tells you when 9 candles in a row are green or red candles (this indicates price may be oversold or overbought)

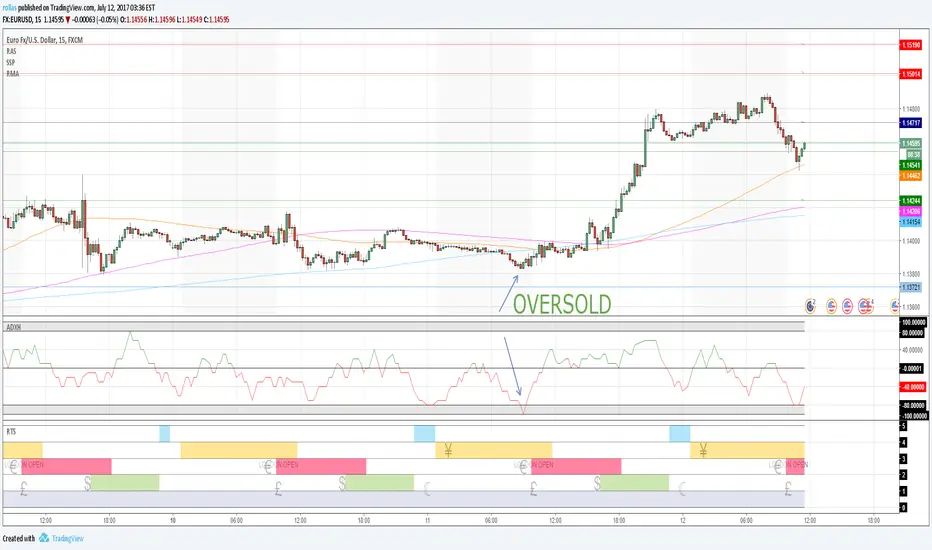
HYPER ADXADX typically shows the strength of a trend. Hyper ADX is specially coded for showing intraday overbought and oversold conditions.