SPY/QQQ Customizable Price ConverterThis is a minimalist utility tool designed for Index traders (SPX, NDX, RUT). It allows you to monitor the price of a reference asset (like SPY, QQQ) directly on your main chart without cluttering your screen.
Key Features:
1.🖱️ Crosshair Sync for Historical Data (Highlight): Unlike simple info tables that only show the latest price, this script allows for historical inspection.
· How it works: Simply move your mouse crosshair over ANY historical candle on your chart.
· The script will instantly display the closing price of the reference asset (e.g., SPY) for that specific time in the Status Line (top-left) or the Data Window. Perfect for backtesting and reviewing price action.
2.🔄 Fully Customizable Ticker: Default is set to SPY, but you can change it to anything in the settings.
e.g.
· Trading NDX Change it to QQQ.
· Trading RUT Change it to IWM.
3.📊 Clean Real-Time Dashboard:
· A floating table displays the current real-time price of your reference asset.
· Color-coded text (Green/Red) indicates price movement.
· Fully customizable size, position, and colors to fit your layout.
NASDAQ 100 CFD

TriAnchor Elastic Reversion US Market SPY and QQQ adaptedSummary in one paragraph
Mean-reversion strategy for liquid ETFs, index futures, large-cap equities, and major crypto on intraday to daily timeframes. It waits for three anchored VWAP stretches to become statistically extreme, aligns with bar-shape and breadth, and fades the move. Originality comes from fusing daily, weekly, and monthly AVWAP distances into a single ATR-normalized energy percentile, then gating with a robust Z-score and a session-safe gap filter.
Scope and intent
• Markets: SPY QQQ IWM NDX large caps liquid futures liquid crypto
• Timeframes: 5 min to 1 day
• Default demo: SPY on 60 min
• Purpose: fade stretched moves only when multi-anchor context and breadth agree
• Limits: strategy uses standard candles for signals and orders only
Originality and usefulness
• Unique fusion: tri-anchor AVWAP energy percentile plus robust Z of close plus shape-in-range gate plus breadth Z of SPY QQQ IWM
• Failure mode addressed: chasing extended moves and fading during index-wide thrusts
• Testability: each component is an input and visible in orders list via L and S tags
• Portable yardstick: distances are ATR-normalized so thresholds transfer across symbols
• Open source: method and implementation are disclosed for community review
Method overview in plain language
Base measures
• Range basis: ATR(length = atr_len) as the normalization unit
• Return basis: not used directly; we use rank statistics for stability
Components
• Tri-Anchor Energy: squared distances of price from daily, weekly, monthly AVWAPs, each divided by ATR, then summed and ranked to a percentile over base_len
• Robust Z of Close: median and MAD based Z to avoid outliers
• Shape Gate: position of close inside bar range to require capitulation for longs and exhaustion for shorts
• Breadth Gate: average robust Z of SPY QQQ IWM to avoid fading when the tape is one-sided
• Gap Shock: skip signals after large session gaps
Fusion rule
• All required gates must be true: Energy ≥ energy_trig_prc, |Robust Z| ≥ z_trig, Shape satisfied, Breadth confirmed, Gap filter clear
Signal rule
• Long: energy extreme, Z negative beyond threshold, close near bar low, breadth Z ≤ −breadth_z_ok
• Short: energy extreme, Z positive beyond threshold, close near bar high, breadth Z ≥ +breadth_z_ok
What you will see on the chart
• Standard strategy arrows for entries and exits
• Optional short-side brackets: ATR stop and ATR take profit if enabled
Inputs with guidance
Setup
• Base length: window for percentile ranks and medians. Typical 40 to 80. Longer smooths, shorter reacts.
• ATR length: normalization unit. Typical 10 to 20. Higher reduces noise.
• VWAP band stdev: volatility bands for anchors. Typical 2.0 to 4.0.
• Robust Z window: 40 to 100. Larger for stability.
• Robust Z entry magnitude: 1.2 to 2.2. Higher means stronger extremes only.
• Energy percentile trigger: 90 to 99.5. Higher limits signals to rare stretches.
• Bar close in range gate long: 0.05 to 0.25. Larger requires deeper capitulation for longs.
Regime and Breadth
• Use breadth gate: on when trading indices or broad ETFs.
• Breadth Z confirm magnitude: 0.8 to 1.8. Higher avoids fighting thrusts.
• Gap shock percent: 1.0 to 5.0. Larger allows more gaps to trade.
Risk — Short only
• Enable short SL TP: on to bracket shorts.
• Short ATR stop mult: 1.0 to 3.0.
• Short ATR take profit mult: 1.0 to 6.0.
Properties visible in this publication
• Initial capital: 25000USD
• Default order size: Percent of total equity 3%
• Pyramiding: 0
• Commission: 0.03 percent
• Slippage: 5 ticks
• Process orders on close: OFF
• Bar magnifier: OFF
• Recalculate after order is filled: OFF
• Calc on every tick: OFF
• request.security lookahead off where used
Realism and responsible publication
• No performance claims. Past results never guarantee future outcomes
• Fills and slippage vary by venue
• Shapes can move during bar formation and settle on close
• Standard candles only for strategies
Honest limitations and failure modes
• Economic releases or very thin liquidity can overwhelm mean-reversion logic
• Heavy gap regimes may require larger gap filter or TR-based tuning
• Very quiet regimes reduce signal contrast; extend windows or raise thresholds
Open source reuse and credits
• None
Strategy notice
Orders are simulated by TradingView on standard candles. request.security uses lookahead off where applicable. Non-standard charts are not supported for execution.
Entries and exits
• Entry logic: as in Signal rule above
• Exit logic: short side optional ATR stop and ATR take profit via brackets; long side closes on opposite setup
• Risk model: ATR-based brackets on shorts when enabled
• Tie handling: stop first when both could be touched inside one bar
Dataset and sample size
• Test across your visible history. For robust inference prefer 100 plus trades.

ProbRSI Adaptive SPY and QQQ Swing One Hour Strategy Summary in one paragraph
A probabilistic RSI engine for large cap ETFs and index names on intraday and swing timeframes. It converts ATR scaled returns into a 0 to 100 probability line, adapts its smoothing from path efficiency, and gates flips with simple percent levels. It is original because it fuses three pieces that traders rarely combine in one signal line: ATR normalized return probability, curvature compression, and per bar adaptive EMA. Add it to a clean chart, keep the default one hour signal on QQQ, and read the entry and exit markers generated by the strategy. For conservative alerts select on bar close.
Scope and intent
• Markets. Major ETFs and large cap equities. Index futures. Liquid crypto. Major FX pairs
• Timeframes. One minute to daily. Defaults to one hour for swing pace
• Default demo used in this publication. SPY/QQQ on one hour
• Purpose. Reduce false flips by adapting to path efficiency and by gating long and short separately
• Limits. This is a strategy. Orders are simulated on standard candles only
Originality and usefulness
• Unique fusion. Logistic probability of ATR scaled returns with arcsine pre transform, optional curvature compression, and per bar adaptive EMA steered by an efficiency ratio
• Failure mode addressed. Fast whips in congestion and late entries after spikes
• Testability. Each component has a named input and can be tuned directly. Entry names Long and Short are visible in the list of trades
• Portable yardstick. ATR scaled return is a common unit across symbols and venues
• Protected rationale. The code stays protected to preserve implementation details of the adaptive engine and curvature assist while the method and usage are fully explained here for community review
Method overview in plain language
You convert raw returns into a probability scale, adapt the smoothing to the straightness of the path, and only allow flips when a simple gate is satisfied. The probability line crosses its own EMA to generate signals. When the cross happens below a short gate or above a long gate, the flip is allowed. Otherwise it is ignored.
Base measures
• Return basis. Close minus prior close normalized by ATR, then arcsine to damp large steps. ATR window is set by ATR length. Sensitivity is adjusted by an ATR scale input
• Probability map. A logistic function maps the normalized return to 0 to 1 which becomes 0 to 100 after scaling
Components
• Probability core. Logistic probability of ATR scaled returns. Higher values imply upside pressure. Smoothed by an adaptive EMA
• Curvature assist optional. A curvature proxy compresses extreme spikes toward neutral. Useful after news bars. Weight controls strength
• Efficiency ratio. A path efficiency score from 0 to 1 extends the smoothing length during noisy paths and shortens it during directional paths
• Signal line. An EMA of the probability line creates the reference for cross up and cross down
• Gates. Two simple percent levels define when long and short flips are allowed
Fusion rule
• The adaptive EMA length is computed as a linear map between a minimum and a maximum bound based on one minus efficiency
• If curvature assist is enabled the probability is adjusted by a small counter spike term
• Final probability is compared to its EMA
Signal rule
• Long. A long entry is suggested when probability crosses above the signal line and the current probability is above the Long gate level
• Short. A short entry is suggested when probability crosses below the signal line and the current probability is below the Short gate level
• Exit and flip. When an opposite entry condition appears the current position is closed and a new position opens in the opposite direction
What you will see on the chart
• Strategy markers on suggestion bars. Orders named Long and Short
• Exit marker when the opposite signal closes the open side
• No table by design. All tuning lives in Inputs for a clean chart
Inputs with guidance
Market TF
• Symbol. Series used for oscillator computation. Use the instrument you trade or a close proxy
• Signal timeframe. Timeframe where the oscillator is evaluated. Leave blank to follow the chart
Core
• Price source. Series used for returns. Typical choice close
• Base length. Fallback EMA length used when adaptation is off. Typical range 20 to 200. Larger smooths more
• ATR length. Window for ATR that scales returns. Typical range 10 to 30. Larger normalizes more and lowers sensitivity
• Logit sharpness. Steepness of the logistic link. Typical range 1 to 8. Raising it reacts more to the same input
• ATR scale. Extra divisor on ATR. Typical range 0.5 to 2. Smaller is more sensitive
• Signal length. EMA of the probability line. Typical range 5 to 20. Larger gives fewer flips
• Long gate. Allow long flips only above this level. Typical range 20 to 40
• Short gate. Allow short flips only below this level. Typical range 20 to 40
Adaptive
• Adaptive smoothing. If on, the efficiency ratio controls the per bar EMA length
• Min effective length. Lower bound of adaptive EMA. Typical range 5 to 50
• Max effective length. Upper bound of adaptive EMA. Typical range 50 to 300
• Efficiency window. Window for efficiency ratio. Typical range 30 to 100
Shape Assist
• Curvature influence. If on, extreme spikes are nudged toward neutral
• Curvature weight. Strength of compression. Typical range 0.1 to 0.3
Properties visible in this publication
• Initial capital. 25000
• Base currency. USD
• request.security lookahead off everywhere
• Commission. 0.03 percent
• Slippage. 5 ticks
• Default order size method percent of equity with value 3 for realistic testing
• Pyramiding 0
• Process orders on close ON
• Bar magnifier OFF
• Recalculate after order is filled OFF
• Calc on every tick OFF
Realism and responsible publication
• No performance claims. Past results never guarantee future outcomes
• Shapes can move while a bar forms and settle on close
• Strategies use standard candles for signals and orders only
Honest limitations and failure modes
• Economic releases and thin liquidity can break assumptions behind the curvature assist
• Gap heavy symbols may prefer a longer ATR window
• Very quiet regimes can reduce signal contrast. Consider higher gates or longer signal length
• Session time follows the exchange of the chart and can change symbol to symbol
• Symbol sensitivity is expected. Use the gates and length inputs to find stable settings
• Past results never guarantee future outcomes
Open source reuse and credits
• None
Mode
Public protected. Source is hidden while access is free. Implementation detail remains private. Method and use are fully disclosed here
Legal
Education and research only. Not investment advice. You are responsible for your decisions. Test on historical data and in simulation before any live use. Use realistic costs.

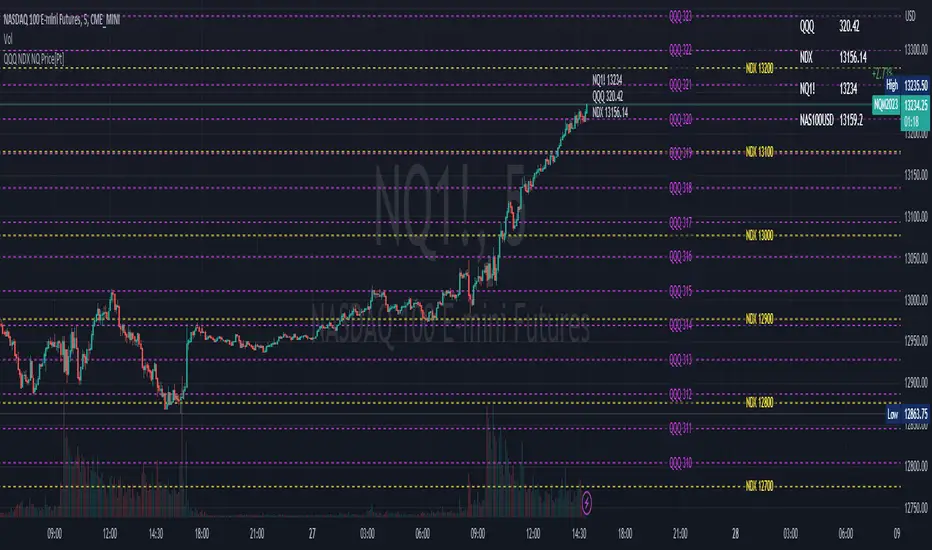
NDX Ladder → Adjusted to Active Ticker (5s & 10s)This indicator allows you to a grid of NDX levels directly on the NQ! (E-mini NASDAQ 100 Futures) chart, automatically adjusting for the spread between NDX and NQ1!. This is particularly useful for traders who perform technical analysis on SPX but execute trades on NQ1!.
Features:
Renders every 5 and 10 points steps of the NDX in your current chart.
The script adjusts these levels in real-time based on the current spread between NDX and NQ / MNQ
Plots updated horizontal lines that move with the spread

NDX Levels Adjusted to Active TickerThis indicator allows you to plot custom NDX levels directly on the NQ1! (E-mini NASDAQ-100 Futures) chart, automatically adjusting for the spread between NDX and NQ1!. This is particularly useful for traders who perform technical analysis on NDX but execute trades on NQ1!.
Features:
Input up to three NDX key levels to track (e.g., 23000, 24000, 25000).
The script adjusts these levels in real-time based on the current spread between NDX and NQ1!
Displays the spread in the chart header for quick reference
Plots updated horizontal lines that move with the spread
Includes optional labels showing the spread periodically to reduce clutter
Supports Multiple Tickers: NQ1!, QQQ, NAS100 and NAS100USD.
Ideal for futures traders who want SPX context while trading NQ1!, QQQ, NAS100 or NAS100USD..

Intraday Trend LinesTradingView Indicator Description: Options-Based Swing Range Forecast
Core Mechanism
This indicator calculates expected price swing ranges for key assets using daily post-market options block trade data, projecting high (resistance) and low (support) levels for:
Next Trading Day (T+1)
Two Days Ahead (T+2)
End of Current Week (Friday)
End of Next Week (Next Friday)
Dual horizontal lines connect the prediction start time (16:00 EST) to the target date's close time (16:00 EST), marking the forecasted range.
Supported Assets
Direct Calculation Indirect Derivation*
SPY SPX (via SPY data)
IWM NDX (via QQQ data)
QQQ IXIC (via QQQ data)
DIA RUT (via IWM data)
TLT SOX
*Indices derived from ETF options data using volatility conversion.
Key Features
Dynamic Updates:
New ranges calculated daily after market close.
Click the 🌀 Refresh button next to the indicator name to load latest data.
Visual Clarity:
Resistance (blue) and support (purple) lines with semi-transparent labels.
Hover labels show date range and swing metrics (e.g., Swing: 36.1 (2.5%)).
Algorithm Basis
Options Gamma Exposure: Identifies high gamma strike clusters.
Volatility Surface Fitting: Derives expected move boundaries.
ETF-to-Index Conversion: SPX/NDX/IXIC ranges scaled from SPY/QQQ data.
Usage Notes
⚠️ Critical Reminders:
SPX/NDX/IXIC: Ranges inferred from ETF liquidity (not direct options data).
Intraday Expiry: Lines auto-expire at 16:00 EST on target dates.
Market Risks: Ranges reflect options trader consensus, not guarantees. Combine with volume/trend analysis.
Compliance Statement
Closed-source logic compliant with TradingView rules.
Core methodology reviewed by moderators (gamma/volatility analysis).

QQQ NDX NQ Price Converter+ [Pt]This is a + version of my original QQQ NDX NQ Price Converter indicator
Description
The QQQ NDX NQ Price Converter is a powerful and easy-to-use tool that allows traders to view corresponding price levels for linked instruments in real-time. This includes QQQ, NDX, NQ, and NAS100USD. Although these instruments often move in sync, differences in price movements, volume, and trading hours can create unique key levels and support/resistance areas for each. By mapping these levels on the same chart, traders can more easily spot trading opportunities and improve their chances of success.
Customizable features
- multiplier from the closest whole number price level
- line color
- line style
- label position / size
- # of levels to display
- toggle current price display table
|| ------------------------------------------------------------------------------------------------------------------------------------------------------------------------------------||
This script includes the following premium unique features.
QQQ / NDX Gaps detector
A gap is an area on a chart where the price between two bars changes significantly without any trades happening between them. Such gaps often occur when a strong shift in sentiment happens during the hours when markets are usually closed. This indicator highlights these gaps on the chart and extends them further until they have been covered (i.e., when a newer bar has crossed that gap).
Overnight gaps from QQQ or NDX can be mapped directly onto NQ chart
VWAPs
VWAPs of these linked instruments can be mapped onto the chart. For example, NQ VWAP mapped onto QQQ chart, or vise versa. This allows for clear visualization of the price action near these VWAP levels.
Custom Cross Instruments Price Targets
Want to trade QQQ options while watching NQ chart or vise versa? You can set upto 8 price targets and see the corresponding converted price level. No need to switch between charts to try to figure out which price level corresponds to which.
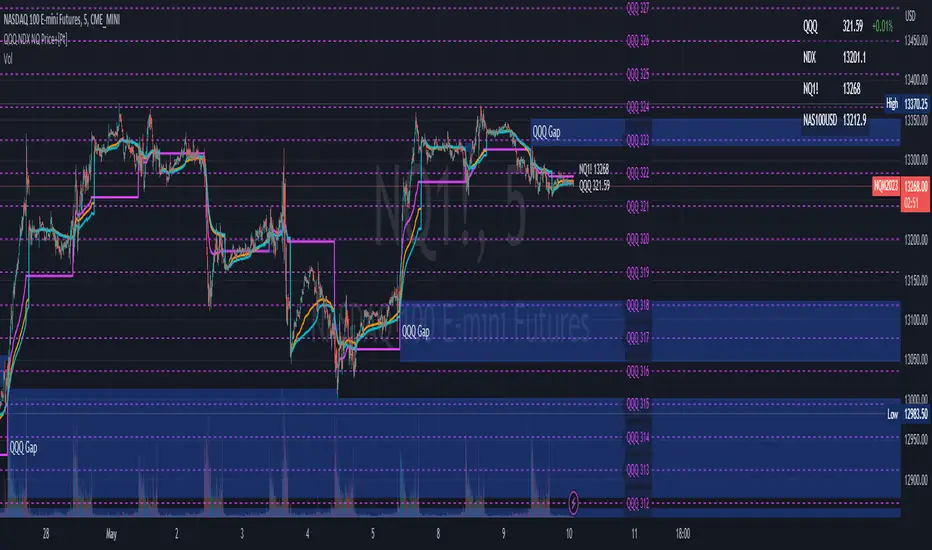
QQQ NDX NQ Price Converter [Pt]A must have tool for QQQ NDX NQ traders~!!!
Description
The QQQ NDX NQ Price Converter is a powerful and easy-to-use tool that allows traders to view corresponding price levels for linked instruments in real-time. This includes QQQ, NDX, NQ, and NAS100USD. Although these instruments often move in sync, differences in price movements, volume, and trading hours can create unique key levels and support/resistance areas for each. By mapping these levels on the same chart, traders can more easily spot trading opportunities and improve their chances of success.
Customizable features
- multiplier from the closest whole number price level
- line color
- line style
- label position / size
- # of levels to display
- toggle current price display table
Price Distance RatioThis study plots the ratio between current price and the price N days ago.
With N input that is configurable, users can find optimal long/short entries when price is in an established trend and price has diverge far from a given local peak or all time high.
With many years of stock trading the analysis indicates a connection between the distance of price and subsequent returns.
Portfolios of stocks with lower price to local highes ratios generally underperformed portfolios of stocks with higher prices to peaks reached similar N days ago.
The highest returns to previous peak are recorded when buying at the biggest dip.
For example, the purchase at 20% drawdown could generate 25% when price returns to the peak. The purchase at 50% drawdown could generate bigger, i.e. 100% return, when price returns to the peak. And the purchase at 90% drawdown could generate much bigger, i.e. 900% return, in a case the price returns to the peak.
However, buying very far below local peaks on almost all holding periods produces lower CAGR returns because of "timing adjustment". In simple words, typically the drawdown takes less time vs. further recovery.
For example:
👉 The largest BTC drawdown in 2013-2015 took 410 days (Peak-to-Valley) . And the recovery of BTC to new highs took 771 days (Valley-to-Peak) after that.
👉 The 3rd longest drawdown in BTC took 363 days (observed from December 17, 2017 to December 15, 2018). And further recovery in BTC to its new high took almost two years - 716 days .
👉The 4th longest drawdown in BTC took 162 days (observed from June 08, 2011 to November 17, 2011). And further recovery in BTC to its new high took more than a year - 469 days .
The concept of this study could recognizes at least 4 different modes of action.
👉 In a clearly established upward trend traders should be buying (following the trend) when Ratio is above 100% and reducing the size when Ratio turns below 100%.
👉 Conversely, in a clearly established downward trend traders should be shorted when Ratio is below 100% and covering when the Ratio turns back to 100%.
👉 In a sideways movement traders are advised to wait carefully if the Ratio near 100% for a long time, and take a position the trend is clear.
👉 Chartists can analyze the dynamic of the indicator - both in terms of trends and overall level. For example as it shown at the chart.
The understading of the study and rules of "timing adjustments" could genarate the awesome opportunities for stock options traders also, with strategies of selling uncovered call options and vertical call spreads.
// Many thanks to @HPotter and @Wheeelman wizards for their continious support and assistance.

US Market Balance of Power Heikin Ashi Swing StrategyThis is a swing strategy, using the power of correlation, mainly designed for an investment approach for the US Market.
It uses the original OBV formula, which has been adapted to monthly heikin ashi candles values, which are taken from the correlated asset, in this case we are using QQQ chart for testing, but internally we are using the logic from SPY chart for calculations.
Once we that value, we make a moving average of it with the length of half of a year to have an idea about the overall price trend during that period of time.
After that, we are going to apply a percentile formula for the OBV value, and we are going to look for the percentile near 100th rank of the entire history of that data.
Finally once we have the top percentile values, we are going to create different formulas for long and short entries:
Short Entry/ Long exit = Current top percentile is higher than the previous top percentile value
Long Entry/ Short Exit = Current obv value is negative and the top percentile is smaller than the previous one or we are near the top values for the OBV oscillators ( crossing upwards previous candle/downwards current candle)
The strategy has been tested using 25% of the entire initial capital available in order to have an idea about the compound effect over the entire history of time which was selected.
From the test which can determine, that on average when we have strong bullish trends, the initial buy n hold strategy outperforms us, however the strategy is definitely a winner when there are side market/ bearish periods of time since it will help cut losses during these periods.
If you have any questions, please let me know !

Scallop Pattern built for scalping NQ & MNQ
The Scallop Pattern identifies momentum reversal.
The pattern consists of two candles and the direction to trade is confirmed in the following candle.
An example trade is shown in the picture. s3.tradingview.com
A Stop Limit order is generally used to enter the long position.

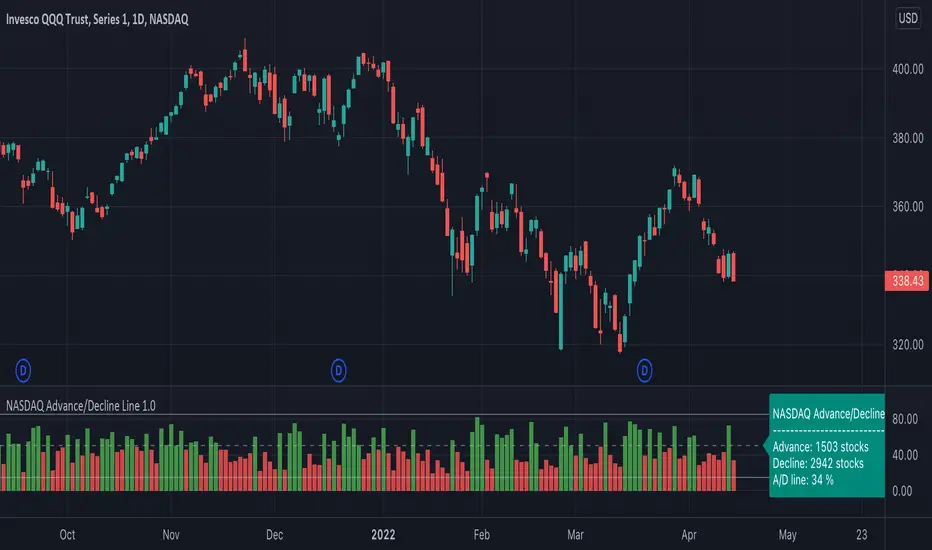
NASDAQ Advance/Decline Line 1.0NASDAQ Advance/Decline Line is a Market Breath indicator.
Brought to you by IQ-trading (Andrei Bogdan) via Trading View Pine script. If you find this helpful in anyway, please leave a like!
A/D line calculates a ratio between total number of NASDAQ stocks advancing and total number of NASDAQ stocks in one day, providing another way to grasp the market breath at any moment.A
Green columns mean more than 50% of NASDAQ stocks are advancing, red columns mean more than 50% of NASDAQ stocks are declining.
Green values above the top band mean correlation to the upside, red values bellow the low band mean correlation to the downside.
Correlation means rising probability of capitulation (to the upside or to the downside).
For a better interpretation, NASDAQ Advance/Decline Line should be used in conjunction with other indicators (volatility, volume, etc.).
--------------------
NASDAQ here refers to the totality of assets listed on the NASDAQ exchange, not to the Nasdaq Composite index or the Nasdaq100 index.
NASDAQ is the second-largest stock exchange on earth, and operates the two major stock indexes based on companies that trade on its exchange: the Nasdaq Composite and the Nasdaq 100.
The Nasdaq Composite tracks the performance of more than 3,000 stocks listed on the Nasdaq while the Nasdaq 100 captures the performance of the exchange’s largest non-financial companies.
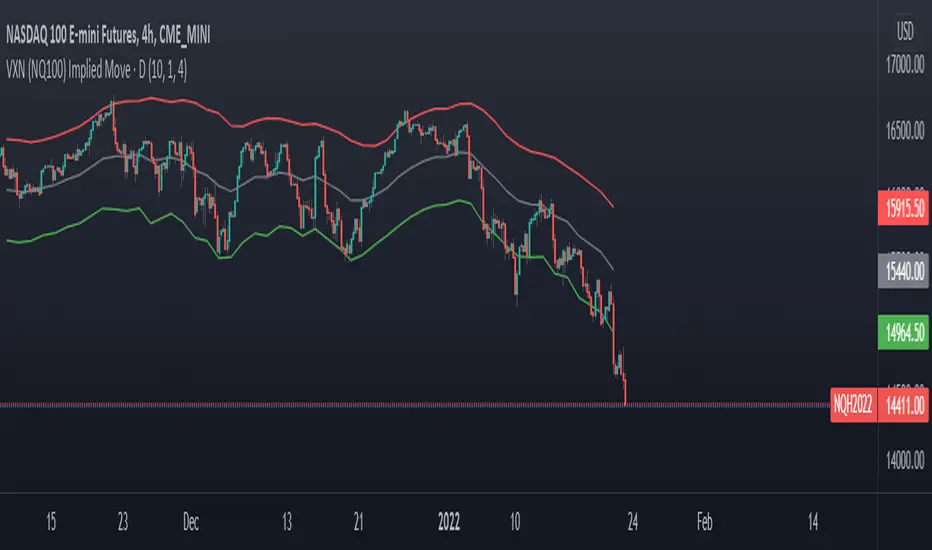
VXN (NQ100 VIX) Implied Move Bands for NQ futures.A spin-off of my similar script for ES futures. This script uses the VXN Index instead of the VIX, which represents the 30-day implied volatility of Nasdaq-100 options and then uses that value to plot bands on the chart, helping traders identify price extremes as identified by the options market. Users can modify the moving average, bands multiplier, and number of lookback days used in the calculation to suit their trading style.
Trend System Oscillator Averages RatingThis is a trend system made with multiple oscillator averages designed especially for trending markets such as stocks or crypto.
It can be used with any timeframe.
Its made of multiple moving oscillators such as
RSI
Stochastic
ADX
CCI
AO
MACD
MOM
STOCH RSI
WPR
BP
UO
Avg of all oscillators
It has also a rating, making an avg from all of the oscillators , going from -100 (all ma's are telling to go short ) to 100 ( all ma are telling to go long).
If you have any questions let me know !

Improved Bollinger Swing Strategy Stock NasdaqThis is an improved bollinger band strategy adapted to Nasdaq Index/Stocks.
The new update include a multiple logic calculation BB adapted for long and short, together with a risk management using movement in %.
Rules for entry
For long we have a crossover between the close and the lower band from the bb
For long we have a crossover between the close and the upper band from the bb
Rules for exit
We exit when we either find a reverse condition, or if we hit the take profit/stop loss levels.
If you have any questions, let me know !

Stock trending strategy This is a long only strategy designed maily for stock markets and futures. In general it works best with 1h, however it can be optimized with other timeframes as well.
Components:
VWAP
MACD histogram
EMA 9
Rules for entry
Long :
For VWAP: close is above the vwap daily
EMA: close is above the moving average
MACD histogram is above 0
Short:
For VWAP: close is belowthe vwap daily
EMA: close is below the moving average
MACD histogram is below 0
Rules for exit
This strategy does not have any risk management inside. Instead it exits whenver it receives an opposite signal form the original one used for entry.
If you have any questions let me know !

Ichimoku with MACD/ CMF/ TSIThis is a very powerful trend strategy designed for markets such as stocks market , stock index and crypto.
For time frames I found out that 1h seems to do the trick.
Components:
Ichimoku full pack
MACD histogram
CMF oscillator
TSI oscillator
Rules for entry
Long :
For Ichimoku:Tenkan part of cloud is bigger than kijun, Chikou is above 0 , close of a candle is above the Senkou
MACD histogram is above 0
CMF oscillator is positive and bigger than 0.1
TSI oscillator is above 0
Short:
For Ichimoku:Tenkan part of cloud is smaller than kijun, Chikou is below 0 , close of a candle is belowthe Senkou
MACD histogram is below 0
CMF oscillator is negative and below -0.1
TSI oscillator is below 0
Rules for exit
This strategy does not have any risk management inside. Instead it exits whenver it receives an opposite signal form the original one used for entry.
If you have any questions let me know !

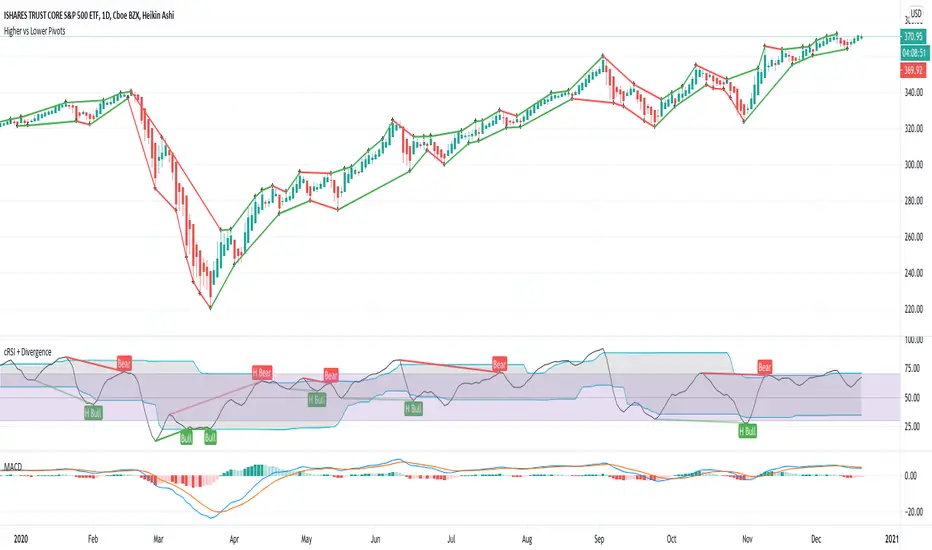
Higher vs Lower Pivots overlayA simple script that I made that draws lines between the high and low pivots. The color of the line define if the pivot is higher or lower than the previous pivot. The main thing to tune is the pivot look back vs look ahead, which are the same params used by the tradingview pivot indicator. There are several other params you can tweaks to get the look you want.
SMI-VIX-SPY-NDX-Index
This script offers an SMI index of VIX, SPY, and NDX. Rather than overlaying VIX, NDX and SPY on the same chart.
It's much easier to see the correlation between VIX's price and NDX / SPY price in this manner.
Thanks to Buckkets & William Blau for the TSI smoothing method.
