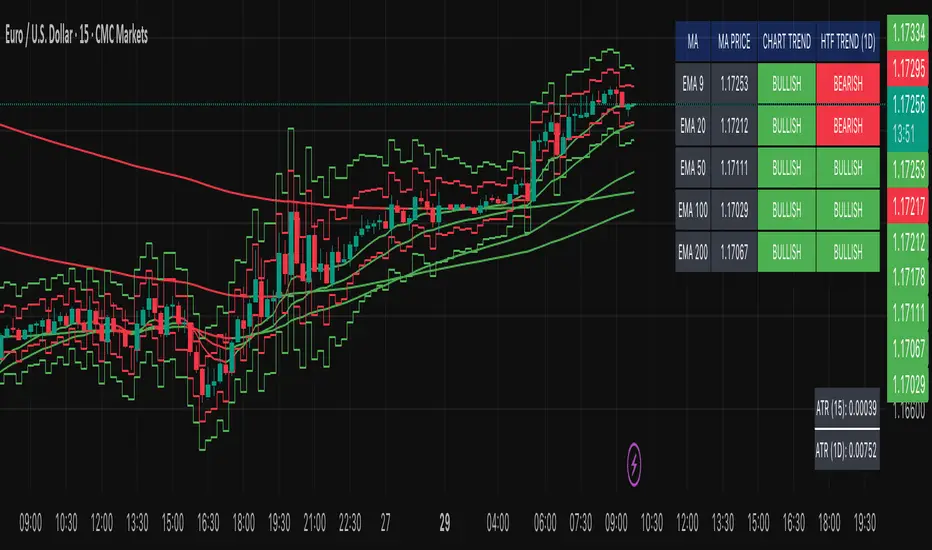
Multi-MA Trend Indicator with ATR by nkChartsThe MMA-ATR is a powerful all-in-one tool that combines multi-timeframe Moving Averages with ATR-based Stop Loss & Take Profit levels. It is designed to help traders quickly assess trend direction, volatility, and potential trade levels in one clean visual setup.
Key Features
Multi-MA Trend Detection
Plots 5 customizable moving averages (choose from EMA, SMA, RMA, WMA, VWMA).
Automatic color coding: Bullish (green), Bearish (red), Neutral (gray).
MA Trend Table with:
MA values
Current chart trend
Higher timeframe (Daily) trend confirmation
ATR-Based Trade Levels
Dynamic Stop Loss (SL) and Take Profit (TP) levels based on ATR multipliers.
Separate visual lines for long and short setups.
ATR Table with:
ATR value for the current chart timeframe
ATR value for the Daily timeframe
Customizations
Choose MA type, length, and price source.
Customize bullish, bearish, and neutral colors.
Adjustable table position and text size.
Fully configurable ATR length, multipliers, and colors.
How to Use
Add the indicator to your chart.
Use the MA Trend Table to identify short-term and higher timeframe trend direction.
Refer to ATR-based SL/TP levels to manage risk and potential profit targets.
Combine both to filter entries and improve trade timing.
Best For
Swing traders and intraday traders who rely on trend confirmation and volatility-based risk management.
Traders looking for a multi-timeframe confirmation system that reduces noise.
⚠️ Disclaimer: This indicator is for educational purposes only. It does not provide financial advice or guarantee profits. Always perform your own analysis before making trading decisions.
Multi
AstraAlgo BacktesterOVERVIEW
The AstraAlgo Backtester allows traders to simulate and evaluate trading strategies directly on TradingView. By simulating trades across different timeframes and markets, it provides valuable insights into win rates, drawdowns, and overall strategy effectiveness.
SIGNAL MODES
Signal Modes generate proprietary trade signals based on live price data. Users can choose between Off, Basic, Advanced, or Custom modes to evaluate strategies under different conditions and refine their trading approach.
ADJUSTABLE BACKTESTING
Parameters for historical simulations can be customized to test different market conditions and trading scenarios. This allows traders to measure strategy performance, including win rate, profit/loss, and risk/reward ratios, helping refine and optimize strategies before live execution.
BAR COLORING
Bar Coloring highlights bullish and bearish bars on historical charts, allowing traders to visually assess trend direction and trade outcomes during backtesting. This makes it easier to analyze momentum and strategy effectiveness at a glance.
ASTRA CLOUD
Astra Cloud overlays dynamic support and resistance levels on live price data. These zones adapt automatically to past market movements, helping traders identify areas where trades would have reacted, aiding strategy evaluation and optimization.

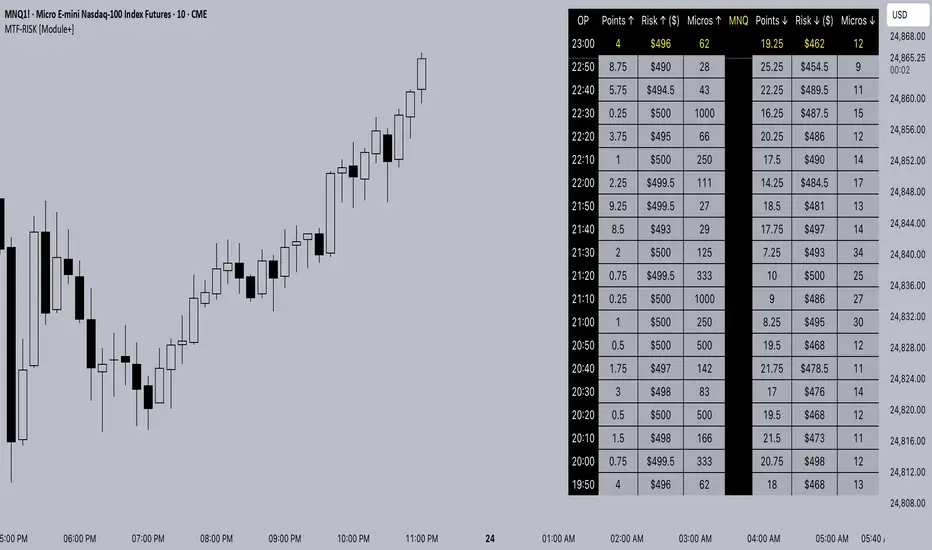
MTF-RISK [Module+]Description
MTF-RISK is a futures risk management tool that calculates standardized position sizing across multiple CME micro contracts, anchored to higher-timeframe structure. By combining multi-timeframe reference levels with a contract-based dollar-per-point model, it allows traders to maintain consistent risk across different futures markets.
Example:
User has selected the 1H timeframe for the risk table. Once an hourly candle closes, the high and low of that completed hour are locked as reference boundaries.
Lower timeframe candles (e.g., 1m, 5m, 15m) reference these established 1H boundaries to calculate:
Distance in points from the current close to the HTF high or low.
Corresponding dollar risk based on the user-defined Max Risk per Trade ($) setting.
The risk table updates in real-time, showing the current stop distance, calculated contract size, and resulting risk in dollars for both upward and downward directions.
Benefit: Traders always maintain a fixed dollar risk, regardless of intraday price movement, while using HTF structure as the anchor for accurate and consistent position sizing.
1. Higher Timeframe Anchor
Always uses the last fully closed candle from the selected higher timeframe (default: 60m).
Captures the prior HTF high and low as reference boundaries.
Lower timeframe closers (e.g., 1m, 5m, 15m bars) reference these established HTF boundaries to measure stop distances and calculate risk.
Use: Ensures all position sizing is tied to completed HTF structure, providing a consistent framework for intraday trades.
2. Risk Model Engine
Traders define maximum dollar risk per trade.
The system calculates allowable micro contracts based on stop distance (current close → HTF high/low).
Supported contracts and their point values:
MNQ (Micro Nasdaq 100): $2.00 per point
MES (Micro S&P 500): $5.00 per point
MYM (Micro Dow Jones): $0.50 per point
MGC (Micro Gold): $10.00 per point
Formula:
Contracts = Max Risk ÷ (Stop Distance × TSE:VALUE per Point)
Risk ↑: Based on distance to HTF high.
Risk ↓: Based on distance to HTF low.
Use: Provides consistent dollar risk sizing across different futures contracts and multiple intraday timeframes.
3. Risk Table Overlay
Compact, real-time on-chart table with customizable styling.
Columns:
OP: Operation time (adjusted by user’s timezone offset).
Points ↑ / ↓: Stop distances in points relative to HTF boundaries.
Risk ↑ / ↓ ($): Dollar exposure at those stops.
Micros ↑ / ↓: Allowable contract count.
Asset: Displays selected futures contract in the header.
Custom features:
Independent text/background colors per column.
Highlighted latest row for clarity.
Adjustable outline, row colors, and text size.
Use: Gives traders immediate insight into position sizing without leaving the chart.
Intended Use:
This is a risk visualization module, not a trade signal generator. Traders can use it to:
Standardize risk sizing across multiple CME micro futures.
Quickly evaluate trade setups relative to HTF structure.
Measure stop distances from lower timeframe closes while referencing HTF boundaries.
Maintain consistency in risk management regardless of the instrument traded.
Limitations & Disclaimers:
Calculations assume standard CME tick values for MNQ, MES, MYM, and MGC.
Other markets may not align with these dollar-per-point values.
This indicator does not predict direction, generate entries, or guarantee outcomes.
For educational and informational purposes only.
Trading involves risk; always use proper risk management.
Closed-source (Protected): Logic is visible on charts, but source code is hidden.
Trend Compass (Manual)## Trend Compass (Manual) - A Discretionary Trader's Dashboard
### Summary
Trend Compass is a simple yet powerful dashboard designed for discretionary traders who want a constant, visual reminder of their market analysis directly on their chart. Instead of relying on automated indicators, this tool gives you **full manual control** to define the market state across different timeframes or conditions.
It helps you stay aligned with your higher-level analysis (e.g., HTF bias, current market structure) and avoid making impulsive decisions that go against your plan.
### Key Features
- **Fully Manual Control:** You decide the trend. No lagging indicators, no confusing signals. Just your own analysis, displayed clearly.
- **Multiple Market States:** Define each row as an `Uptrend`, `Downtrend`, `Pullback`, or `Neutral` market.
- **Customizable Rows:** Display up to 8 rows. You can label each one however you like (e.g., "D1", "H4", "Market Structure", "Liquidity Bias").
- **Flexible Panel:** Change all colors, text sizes, and place the panel in any of the 9 positions on your chart.
- **Clean & Minimalist:** Designed to provide essential information at a glance without cluttering your chart.
### How to Use
1. **Add to Chart:** Add the indicator to your chart.
2. **Open Settings:** Go into the indicator settings.
3. **Configure Rows:**
- In the "Rows (Manual Control)" section, set the "Number of rows" you want to display.
- For each row, give it a custom **Label** (e.g., "m15").
- Select its current state from the dropdown menu (`Uptrend`, `Downtrend`, etc.).
- To remove a row, simply set its state to `Hidden`.
4. **Customize Style:**
- In the "Panel & Visual Style" section, adjust colors, text sizes, and the panel's position to match your chart's theme.
This tool is perfect for price action traders, ICT/SMC traders, or anyone who values a clean chart and a disciplined approach to their analysis.

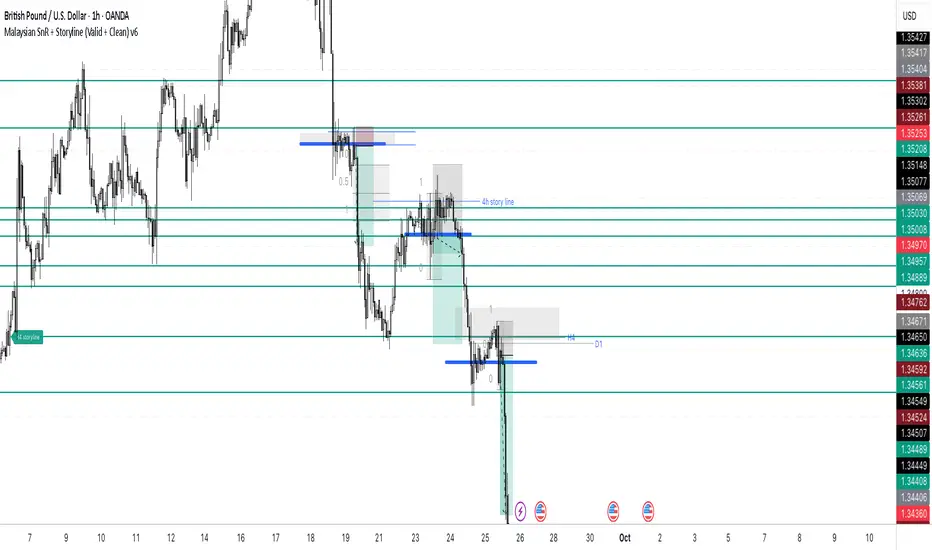
Malaysian SnR + Storyline This indicator combines the Malaysian Support & Resistance (SnR) method with a Multi-Timeframe Storyline view.
🔹 Malaysian SnR (A/V levels)
Plots Support & Resistance using candlestick bodies only (close → open).
“A” shape = Resistance (bullish close → bearish open).
“V” shape = Support (bearish close → bullish open).
Supports Fresh/Unfresh logic with wick-touch validation.
🔹 Storyline (W/D/H4/H1 bias lines)
Weekly = Big map / macro bias.
Daily = Medium trend / retracement.
H4 = Intraday bias confirmation.
H1 = Execution bias (entry filter).
Lines extend forward and only update when a new pivot confirms.
🔹 Extra Features
Alignment Rule: option to hide A/V levels when TF biases don’t align (e.g. W=D=H4=H1).
Story Labels: optional text labels describing each TF storyline.
History filter: show storyline for the last X days only, for cleaner charts.
This script is designed for price action traders who want to combine body-based SnR levels with a clear multi-timeframe bias storyline, making it easier to align intraday execution with higher timeframe context.
Multi EMA Pack (Full, Custom Multi-Cross)Exponential Moving Average (EMA) is a trend-following indicator that smooths price data by applying more weight to recent prices. It reacts faster to market changes than a Simple Moving Average (SMA). Traders often use multiple EMAs with different lengths to identify trend direction, spot crossovers as trade signals, and define dynamic support or resistance zones.

EMA 200 MultiTF G/R + Cross Alerts by LifeHack Trader1. Indicator Setup
The script starts by defining the version of Pine Script (v5) and creating an indicator called "EMA 200 MultiTF G/R + Cross Alerts by LifeHack Trader."
The overlay=true parameter ensures that the indicator is plotted directly on the price chart.
2. Function to Get EMA200
A custom function getEma200 is defined to retrieve the 200-period Exponential Moving Average (EMA) for a specified timeframe (tf).
This function uses the request.security function to fetch the close price's EMA from different timeframes.
3. Calculate EMA200 for Multiple Timeframes
The script calculates the EMA200 for four timeframes: 15 minutes ("15"), 1 hour ("60"), 4 hours ("240"), and 1 day ("D").
These values are stored in variables (ema15, ema1h, ema4h, ema1d) and represent the EMA for each timeframe.
4. Determine Price Above or Below EMA200 (G/R)
For each timeframe, the script checks whether the closing price is above or below the EMA200.
It uses boolean checks to determine if the price is above the EMA200, assigning the status "G" (Green) for above and "R" (Red) for below.
5. Cross Signal Detection (Up/Down)
The script detects crossovers and crossunders between the price and EMA200 for each timeframe.
A crossover signal is detected when the price crosses above the EMA200 (bullish), and a crossunder signal is detected when the price crosses below the EMA200 (bearish).
These signals are stored in separate variables (crossUp, crossDown).
6. Display a Table with G/R Status and Cross Alerts
A table is created and displayed in the top-right corner of the chart. The table shows the status (G or R) for each timeframe and the cross signal (▲ for crossover, ▼ for crossunder, or - for no cross event).
The table is updated with the respective values for each timeframe every time a new bar is formed.
7. Alert Conditions
The script defines alert conditions based on the crossovers and crossunders.
When a price crosses above the EMA200 (cross-up), an alert is triggered for a potential buy opportunity. When the price crosses below the EMA200 (cross-down), an alert is triggered for a potential sell opportunity.
Alerts are configured for each timeframe (15 minutes, 1 hour, 4 hours, and 1 day).
This script provides a comprehensive system for monitoring price action relative to the EMA200 on multiple timeframes, highlighting crossovers, and delivering visual feedback and alerts based on the price's relationship with the EMA.

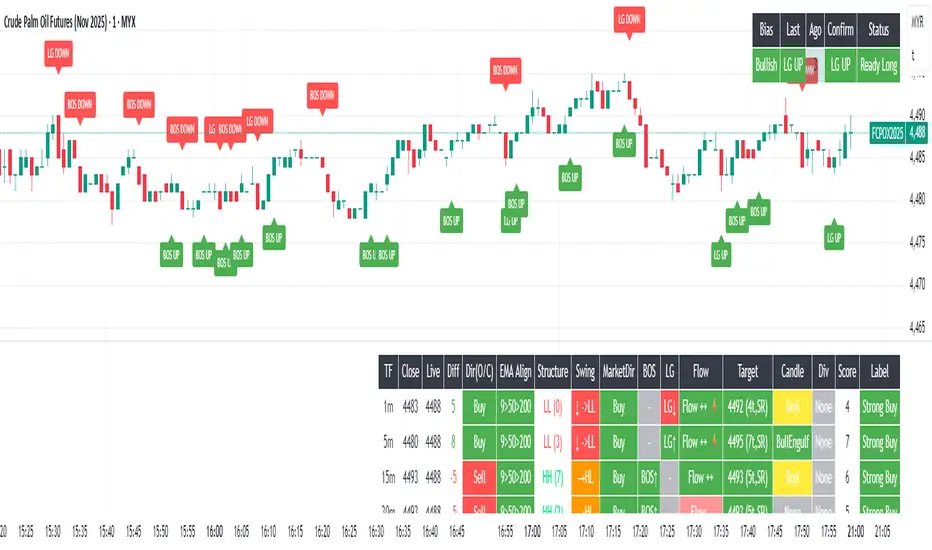
Multi-Timeframe Dashboard INDIpendence AAZ is a powerful Multi-Timeframe Dashboard that provides real-time readings of:
✔ Market Structure
✔ Market Direction
✔ Entry Signals
This tool is designed for Derivatives (Soy, FCPO, etc.), Forex, Crypto, and Global Markets.
Perfect for new traders and those who do not have the time to study charts in detail.
⚠️ Disclaimer: This indicator is for educational and analytical purposes only. All trading decisions and risks remain with the user.
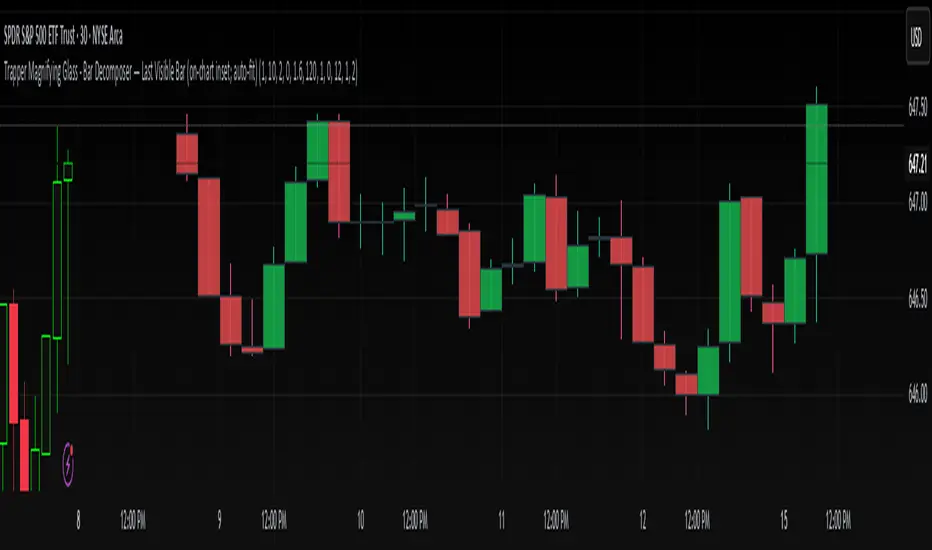
Trapper Magnifying Glass - Bar Decomposer — Last Visible BarHeadline
Decompose any higher-timeframe bar into lower-timeframe candles directly on the chart. Zoom/pan reactive, session-accurate, auto-fit inset, and compliant with TradingView placement limits.
Quick Start
Add the indicator and choose a Child TF (minutes) (e.g., 1, 5, 10, 15).
The inset follows the last visible bar on your screen. Adjust Right separation / Mini width / Gap / Vertical exaggeration as needed.
Leave Show HUD label OFF by default. Turn it on only if you want a compact readout.
Overview
This tool draws a miniature, on-chart inset of lower-timeframe candles that make up the currently viewed higher-timeframe bar. It stays on the main price chart (not in a separate pane), respects zoom/pan, compresses itself to fit available space, and adheres to TradingView’s 500-bar object placement limit.
The design goal is micro-structure inspection without changing the chart timeframe.
What Makes It Different
On-chart inset (not a separate indicator panel) for true visual context.
Zoom/Pan reactive to the last visible bar — works naturally as you navigate.
Auto-fit logic keeps the inset readable while staying inside TradingView’s future-bars limit.
Session-accurate decomposition: uses TradingView’s own lower-timeframe OHLC, exactly within the parent bar’s time window.
Strictly compliant: no synthetic bars, no repaint tricks, no lookahead.
How It Works
Child data is fetched with request.security_lower_tf(syminfo.tickerid, , open/high/low/close).
Only closed lower-TF bars inside the parent bar’s time window are returned by TradingView.
The script maps each child bar to an inset candle (body + wick) scaled to the parent bar’s price range and placed to the right of the parent’s position.
The inset tracks the last visible bar so it always stays relevant to what you’re inspecting.
Inputs (Defaults)
Timeframes
Child TF (minutes): 1 (min 1, max 1440)
Layout
Right separation (bars): 10
Mini candle width (bars): 2
Gap between mini candles (bars): 0
Vertical exaggeration ×: 1.6
Auto-Fit
Auto-fit inset width: ON
Max bars ahead to use: 120
Minimum mini width: 1
Minimum gap: 0
Style
Bull/Bear colors: ON
Body Bull / Body Bear / Wick Bull / Wick Bear: configurable
Body Fill Opacity (0–100): 12
Outline color: dark grey
Outline width: 1
Wick width: 2
HUD
Show HUD label: OFF (recommended default; enable only when you need a summary)
Session Behavior (Important)
TradingView constructs bars strictly by exchange sessions. For US equities (regular session 09:30–16:00, 390 minutes):
On a 1h chart you will see 7 bars per day:
09:30–10:00 (30 minutes)
10:00–11:00, 11:00–12:00, 12:00–13:00, 13:00–14:00, 14:00–15:00 (five full hours)
15:00–16:00 (full hour)
Decomposing the 09:30–10:00 bar into 1m returns 30 minis (not 60).
Decomposing 10:00–11:00 returns 60 minis, as expected.
The last hour (15:00–16:00) decomposes to 60 minis once they exist (i.e., immediately after each child bar closes). If you are mid-session, you will see only the minis that have closed so far.
This is by design and ensures the inset reflects the true lower-timeframe structure TradingView has for that exact bar window. Nothing is synthesized.
Live vs Confirmed Bars
Confirmed bars (historical) always decompose to a full, correct count of child minis for that parent window.
Live bars (currently forming) only return child minis that have already closed. Mid-hour on a 1h chart with 10m children, you might see 3, 4, or 5 minis depending on elapsed time.
This script’s default experience focuses on the last visible bar and displays whatever the platform provides at that moment. The HUD (when enabled) includes the parent bar duration in minutes to make short session bars explicit.
Auto-Fit and Placement Limits
TradingView prevents drawing objects beyond 500 bars into the future. The inset’s right edge is automatically clamped to stay within that boundary. If the requested number of minis would overflow the allowed space, the script proportionally compresses mini width/gap (down to your configured minimums). If necessary, it draws only as many minis as safely fit — favoring stability over clutter.
Styling Tips
For dense decompositions (e.g., 1m inside 1h), set:
Mini width = 1, Gap = 0, Auto-fit = ON, Right separation = 7–12.
Increase Vertical exaggeration to highlight wick-to-body differences when the parent bar is narrow.
Keep HUD OFF for publishing and screenshots unless you’re highlighting counts or session duration.
Notes & Limitations
Child arrays show closed bars only. No forming mini is displayed to avoid misleading totals.
If you reload a chart or switch symbols/timeframes, the most recent confirmed bar’s arrays may be empty on the very first calculation frame; the script guards against this and will draw on the next update.
The tool is an overlay visualization, not a signal generator; there are no alerts or trading advice.
Performance: heavy decompositions on very fast symbols/timeframes can add many objects. Auto-fit and minimal widths help.
Compliance
Uses only native TradingView data (request.security_lower_tf).
No repainting and no lookahead.
No external feeds, synthetic candles, or hidden calculations that would misrepresent the underlying data.
Fully respects TradingView’s object placement constraints.
Recommended Defaults (for broad usability)
Child TF: 5 or 15 (depending on your HTF).
Right separation: 7–12
Mini width / Gap: 2 / 0 for clarity, 1 / 0 for dense fits.
Auto-fit: ON
HUD: OFF
Troubleshooting
“Why aren’t there 60 one-minute minis in this 1h bar?”
Either the parent bar is a session-short bar (09:30–10:00 = 30 minutes) or you are viewing a live bar mid-hour; only closed minis appear.
Inset clipped or not visible to the right:
Increase Max bars ahead to use (Auto-Fit group), reduce Mini width/Gap, or reduce Right separation.
Nothing draws on first load:
Wait for the next bar update, or navigate the chart so the last visible bar changes; arrays refresh as data becomes available.
Change Log
v1.0 – Initial public release.
On-chart inset, zoom/pan reactive, auto-fit width.
Session-accurate lower-TF decomposition.
HUD label toggle (off by default) with child TF, bar count, and parent duration.
Hardened array handling for confirmed snapshots.
Disclaimer
This script is provided strictly for educational and informational purposes only.
It does not constitute financial advice, investment advice, trading signals, or a recommendation to buy or sell any security, asset, or instrument. Trading and investing involve risk; always do your own research and consult with a licensed financial professional before making decisions.
Zone Cluster Confluence ProWhat it does
Zone Cluster Confluence Pro automatically finds price “zones” via equal-frequency clustering of HLC3 values and wraps each cluster center with an ATR-based band. Zones are color-coded by a 0–100 Strength % and can optionally highlight confluence with a higher timeframe (HTF) right on your chart.
Key features
• Adaptive Depth by Volatility (ATR regime): zone width scales down in calm markets and widens in volatile regimes.
• Strength % scoring with color mapping (Strong / Work / Mid / Weak). The score blends:
• number of touches (with tolerance),
• dwell time inside the zone (penalized),
• confirmed breakouts (penalized),
• average overshoot beyond the band (penalized),
• recency bonus,
• optional volume-boosted touches (volume > SMA × multiplier).
• HTF Confluence Overlay: computes zones on a higher TF (multiplier of the source TF or a specific TF) and highlights the intersection of LTF zones with the nearest HTF zone (white fill).
• Presets per TF: Aggressive / Stable / Anti-pierce profiles with hand-tuned params for 15/30/60/120/240m; or run fully Manual.
• Clean visuals: centers, borders, filled bands; strength labels with auto-contrast text.
How it works (high level)
• Clustering method: choose K-median or K-means (median/mean of equal-frequency buckets) to place zone centers.
• Zone width = ATR × Depth; Depth becomes Adaptive when the ATR regime deviates from its long SMA.
• Strength % is computed over a lookback window using the components listed above; touches can earn an extra bonus on elevated volume.
Inputs (most useful)
• Source TF: inherit from chart or pick a specific TF.
• Zones (k): 2–5 clusters.
• Presets: Aggressive / Stable / Anti-pierce, or Manual control of Candles Back, ATR length, Depth.
• Adaptive Depth: on/off, regime thresholds & multipliers.
• Strength %: profile (Conservative/Neutral/Optimistic), lookback, breakout/overshoot/touch tolerance.
• Volume boost: SMA length, spike multiplier, weight.
• HTF Confluence: on/off, TF multiplier, HTF preset/method/params, and whether HTF k mirrors LTF k.
Reading the chart
• Zone fills are colored by Strength %:
• 80–100 Strong, 60–80 Work, 40–60 Mid, <40 Weak.
• White fills mark LTF×HTF intersections (confluence areas).
• Strength labels (Z1…Z5) show the current score; label background matches the strength color.
Tips
• Use Stable for most markets, Aggressive for fast intraday, Anti-pierce to reduce whipsaw.
• Turn on HTF confluence to filter LTF zones down to areas aligned with the larger trend structure.
• If you scalp, keep volume boost on; for thin markets consider lowering the spike multiplier.
Notes
• No lookahead is used for HTF data (request.security with lookahead_off).
• Zones update as new bars arrive and as the lookback window rolls; this is not a fixed S/R drawing tool.
• Works on any symbol/timeframe; parameter tuning is encouraged.
Access
This script is Invite-Only.
Disclaimer
For educational purposes only. Not financial advice. Trading involves risk.

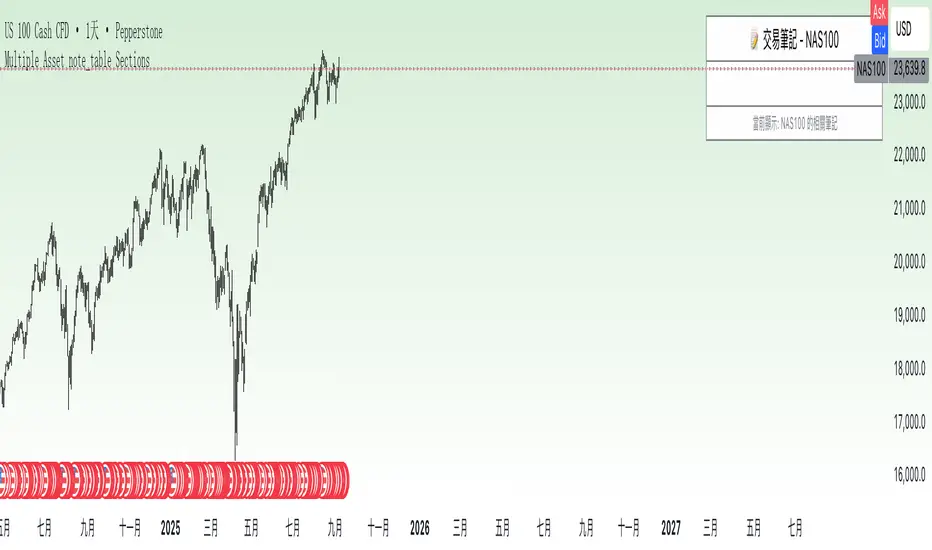
Multiple Asset note_table Sections### Features
- **Expanded to 10 independent Sections**: Each Section has a title, content, and associated asset
- **Asset-based filtering**: Section only displays when the Section's asset name is empty or matches the current chart asset
- **Empty asset setting retained**: If Section asset name is left blank, that Section will display across all assets
- **Automatic display of current asset**: Current asset name is automatically shown in the header and footer
### Usage Instructions
1. Each Section can be assigned a specific asset name, such as "BTCUSDT", "ETHUSDT", etc.
2. A Section will only display when the current chart asset matches the asset specified for that Section
3. If you want a Section to display across all assets, simply leave the asset name blank for that Section
4. Each Section has independent title and content that can be customized as needed
5. When switching to different trading instruments, the indicator automatically displays notes relevant to the current instrument
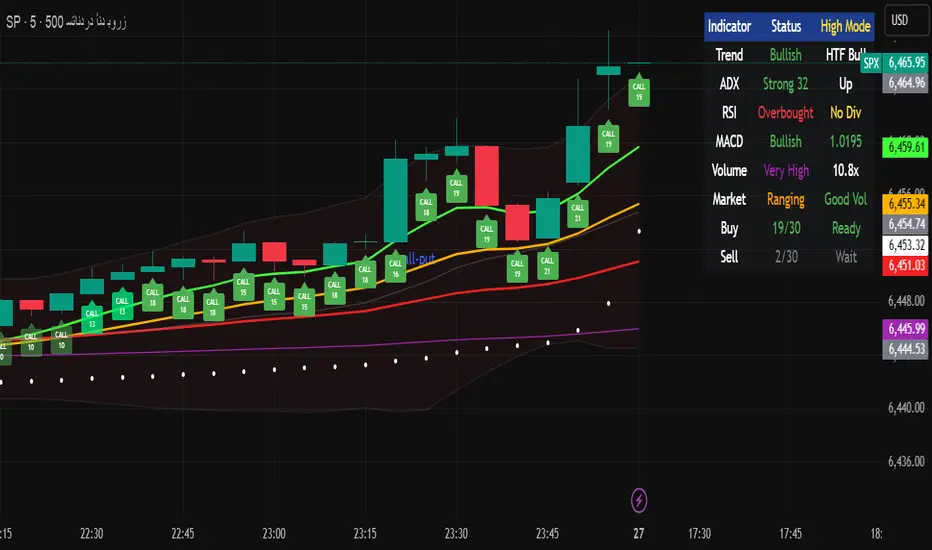
Multi-Timeframe Options Strategy with Dynamic Scoring System## Multi-Timeframe Options Strategy with Dynamic Scoring System
### Overview
This indicator combines 12 technical analysis tools using a proprietary 30-point scoring system to generate options trading signals (CALL/PUT). It's designed for traders seeking confluence-based entries with multiple confirmation layers.
### How the Scoring System Works
The indicator evaluates market conditions across three categories:
**Trend Analysis (9 points maximum):**
- EMA Alignment (9, 21, 50, 200): Checks if moving averages are properly stacked (3 points)
- ADX Trend Strength: Confirms trend momentum above 25 threshold (3 points)
- Higher Timeframe Confirmation: Validates signals against larger timeframe trend (3 points)
**Momentum Indicators (7 points maximum):**
- RSI Position & Direction: Optimal zones 40-65 for buys, 35-60 for sells (2 points)
- MACD Signal Line Cross: Momentum confirmation (2 points)
- Stochastic Oscillator: Overbought/oversold conditions (2 points)
- Bollinger Band Position: Price relative to middle band (1 point)
**Market Quality Filters (4 points maximum):**
- Volume Confirmation: 1.5x average volume requirement (2 points)
- VWAP Position: Trend alignment check (1 point)
- ATR Volatility: Ensures adequate price movement (1 point)
### Key Features
**1. Fair Value Gaps (FVG)**
- Identifies price inefficiencies between candles
- Bullish FVG: Current low > high (potential support)
- Bearish FVG: Current high < low (potential resistance)
- Visual representation with colored boxes on chart
**2. Three Operating Modes**
- Normal Mode: Minimum 10 points - balanced signal frequency
- High Mode: Minimum 15 points - fewer but stronger signals
- Ultra Mode: Minimum 20 points - only highest quality setups
**3. Protection Mechanisms**
- Bollinger Band squeeze detection avoids ranging markets
- Prevents conflicting signals (no simultaneous CALL/PUT)
- 5-bar minimum cooldown between signals
- Filters extreme RSI readings (>75 or <25)
**4. Risk Management**
- Three profit targets: 0.5%, 1%, 1.5%
- Stop loss: 0.5% or ATR-based
- Visual target lines with entry/exit levels
### How Components Work Together
The indicator creates a comprehensive market analysis by combining:
- **EMAs** provide the trend structure framework
- **Oscillators** (RSI, Stochastic) identify optimal entry timing
- **ADX** confirms trend strength to filter weak signals
- **Volume** validates institutional participation
- **Higher timeframe** acts as a directional filter
Each component contributes points to either bullish or bearish scoring. Signals only generate when one direction significantly outweighs the other and meets minimum thresholds.
### Usage Instructions
1. **Select Mode**: Choose Normal/High/Ultra based on your trading style
2. **Monitor Dashboard**: Check real-time scoring and market conditions
3. **Wait for Signals**: Main BUY/SELL labels appear when criteria met
4. **Follow Targets**: Use automated TP and SL levels for risk management
5. **Candle Labels**: Optional CALL/PUT labels show building momentum
### Dashboard Information
The dashboard displays:
- Current trend direction and HTF confirmation
- ADX strength and direction
- RSI status with divergence detection
- MACD momentum state
- Volume multiplier
- Market condition (trending/ranging)
- Live scoring for both directions
### Important Notes
- This is a technical analysis tool, not financial advice
- Past performance does not guarantee future results
- Always use proper risk management
- Test thoroughly on demo before live trading
### Originality
This indicator's unique value comes from:
1. The 30-point weighted scoring system that prioritizes different factors
2. Integration of Fair Value Gaps with traditional indicators
3. Multi-mode operation allowing traders to adjust signal frequency
4. Higher timeframe validation system
5. Comprehensive filtering to reduce false signals
The combination creates a systematic approach to options trading that goes beyond simple indicator mashups by providing clear, scored reasoning for each signal.
---
### Updates and Support
For questions or suggestions, please comment below. The indicator will be updated based on community feedback while maintaining compliance with all platform rules.
Multi HTF High/Low LevelsThis indicator plots the previous high and low from up to four user-defined higher timeframes (HTF), providing crucial levels of support and resistance. It's designed to be both powerful and clean, giving you a clear view of the market structure from multiple perspectives without cluttering your chart.
Key Features:
Four Customizable Timeframes: Configure up to four distinct higher timeframes (e.g., 1-hour, 4-hour, Daily, Weekly) to see the levels that matter most to your trading style.
Automatic Visibility: The indicator is smart. It automatically hides levels from any timeframe that is lower than your current chart's timeframe. For example, if you're viewing a Daily chart, the 4-hour levels won't be shown.
Clean On-Chart Lines: The high and low for each timeframe are displayed as clean, extended horizontal lines, but only for the duration of the current higher-timeframe period. This keeps your historical chart clean while still showing the most relevant current levels.
Persistent Price Scale Labels: For easy reference, the price of each high and low is always visible on the price scale and in the data window. This is achieved with an invisible plot, giving you the accessibility of a plot without the visual noise.
How to Use:
Go into the indicator settings.
Under each "Timeframe" group, check the "Show" box to enable that specific timeframe.
Select your desired timeframe from the dropdown menu.
The indicator will automatically calculate and display the previous high and low for each enabled timeframe.

Frozen 4H VWAP – Precision AnchoredFrozen 4H VWAP – Precision Anchored Like Ice
The Frozen 4H VWAP – Precision Anchored delivers a clean, stable, and reliable view of the 4-hour Volume Weighted Average Price, designed for traders who want higher timeframe insights without intrabar noise or repainting.
🔹 Key Features:
Non-Repainting: VWAP value is “frozen” at the close of each 4H candle — no mid-bar updates or flickering.
4H Timeframe Anchoring: Seamlessly pulls 4-hour VWAP values into any timeframe you’re trading on.
Clear Trend Reference: Updates only when a new 4H candle begins, acting as a trustworthy anchor for support/resistance.
Custom Source Option: Choose from different price sources (default: HLC3) to fit your strategy.
Whether you're scalping, day trading, or swing trading, this indicator gives you a powerful edge by grounding your decisions in higher timeframe VWAP data — clear, calm, and frozen in time.

Vantage-XVANTAGE-X – The Market. Decoded.
Your vantage point between bull & bear — clarity, precision, and high-probability trading signals.
VANTAGE-X is a high-probability trading system designed to cut through the noise and deliver clarity at a glance.
🔹 What It Does
• EMA 20 (1H), EMA 50 (4H), EMA 200 (chart timeframe) → Instant bullish/bearish signals
• VWAP → Bullish/Bearish/Neutral, based on last 5 candles for precision
• Daily Bias → Bullish or Bearish without switching charts
• Chop Filter → Detects if market is trending or choppy (last 10 candles)
• Works across all assets on TradingView — futures, forex, stocks, crypto, options
🔹 Why Traders Use It
• Eliminates chart clutter and analysis paralysis
• No more flipping timeframes — dashboard updates automatically
• Clear signals = faster decisions, cleaner trades
🚨 Subscription Access Only – Invite-Only Script
This indicator is available exclusively to subscribed members of VANTAGE-X. Access is tied to your TradingView username and managed manually by our team.
👉 Website coming soon

Multi-Timeframe Bollinger BandsMy hope is to optimize the settings for this indicator and reintroduce it as a "strategy" with suggested position entry and exit points shown in the price pane.
I’ve been having good results setting the “Bollinger Band MA Length” in the Input tab to between 5 and 10. You can use the standard 20 period, but your results will not be as granular.
This indicator has proven very good at finding local tops and bottoms by combining data from multiple timeframes. Use timeframes that are lower than the timeframe you are viewing in your price pane. Be cognizant that the indicator, like other oscillators, does occasionally produce divergences at tops and bottoms.
Any feedback is appreciated.
Overview
This indicator is an oscillator that measures the normalized position of the price relative to Bollinger Bands across multiple timeframes. It takes the price's position within the Bollinger Bands (calculated on different timeframes) and averages those positions to create a single value that oscillates between 0 and 1. This value is then plotted as the oscillator, with reference lines and colored regions to help interpret the price's relative strength or weakness.
How It Works
Bollinger Band Calculation:
The indicator uses a custom function f_getBBPosition() to calculate the position of the price within Bollinger Bands for a given timeframe.
Price Position Normalization:
For each timeframe, the function normalizes the price's position between the upper and lower Bollinger Bands.
It calculates three positions based on the high, low, and close prices of the requested timeframe:
pos_high = (High - Lower Band) / (Upper Band - Lower Band)
pos_low = (Low - Lower Band) / (Upper Band - Lower Band)
pos_close = (Close - Lower Band) / (Upper Band - Lower Band)
If the upper band is not greater than the lower band or if the data is invalid (e.g., na), it defaults to 0.5 (the midline).
The average of these three positions (avg_pos) represents the normalized position for that timeframe, ranging from 0 (at the lower band) to 1 (at the upper band).
Multi-Timeframe Averaging:
The indicator fetches Bollinger Band data from four customizable timeframes (default: 30min, 60min, 240min, daily) using request.security() with lookahead=barmerge.lookahead_on to get the latest available data.
It calculates the normalized position (pos1, pos2, pos3, pos4) for each timeframe using f_getBBPosition().
These four positions are then averaged to produce the final avg_position:avg_position = (pos1 + pos2 + pos3 + pos4) / 4
This average is the oscillator value, which is plotted and typically oscillates between 0 and 1.
Moving Averages:
Two optional moving averages (MA1 and MA2) of the avg_position can be enabled, calculated using simple moving averages (ta.sma) with customizable lengths (default: 5 and 10).
These can be potentially used for MA crossover strategies.
What Is Being Averaged?
The oscillator (avg_position) is the average of the normalized price positions within the Bollinger Bands across the four selected timeframes. Specifically:It averages the avg_pos values (pos1, pos2, pos3, pos4) calculated for each timeframe.
Each avg_pos is itself an average of the normalized positions of the high, low, and close prices relative to the Bollinger Bands for that timeframe.
This multi-timeframe averaging smooths out short-term fluctuations and provides a broader perspective on the price's position within the volatility bands.
Interpretation
0.0 The price is at or below the lower Bollinger Band across all timeframes (indicating potential oversold conditions).
0.15: A customizable level (green band) which can be used for exiting short positions or entering long positions.
0.5: The midline, where the price is at the average of the Bollinger Bands (neutral zone).
0.85: A customizable level (orange band) which can be used for exiting long positions or entering short positions.
1.0: The price is at or above the upper Bollinger Band across all timeframes (indicating potential overbought conditions).
The colored regions and moving averages (if enabled) help identify trends or crossovers for trading signals.
Example
If the 30min timeframe shows the close at the upper band (position = 1.0), the 60min at the midline (position = 0.5), the 240min at the lower band (position = 0.0), and the daily at the upper band (position = 1.0), the avg_position would be:(1.0 + 0.5 + 0.0 + 1.0) / 4 = 0.625
This value (0.625) would plot in the orange region (between 0.85 and 0.5), suggesting the price is relatively strong but not at an extreme.
Notes
The use of lookahead=barmerge.lookahead_on ensures the indicator uses the latest available data, making it more real-time, though its effectiveness depends on the chart timeframe and TradingView's data feed.
The indicator’s sensitivity can be adjusted by changing bb_length ("Bollinger Band MA Length" in the Input tab), bb_mult ("Bollinger Band Standard Deviation," also in the Input tab), or the selected timeframes.

Multi-Timeframe Bollinger Band PositionBeta version.
My hope is to optimize the settings for this indicator and reintroduce it as a "strategy" with suggested position entry and exit points shown in the price pane.
Any feedback is appreciated.
Overview
This indicator is an oscillator that measures the normalized position of the price relative to Bollinger Bands across multiple timeframes. It takes the price's position within the Bollinger Bands (calculated on different timeframes) and averages those positions to create a single value that oscillates between 0 and 1. This value is then plotted as the oscillator, with reference lines and colored regions to help interpret the price's relative strength or weakness.
How It Works
Bollinger Band Calculation:
The indicator uses a custom function f_getBBPosition() to calculate the position of the price within Bollinger Bands for a given timeframe.
Price Position Normalization:
For each timeframe, the function normalizes the price's position between the upper and lower Bollinger Bands.
It calculates three positions based on the high, low, and close prices of the requested timeframe:
pos_high = (High - Lower Band) / (Upper Band - Lower Band)
pos_low = (Low - Lower Band) / (Upper Band - Lower Band)
pos_close = (Close - Lower Band) / (Upper Band - Lower Band)
If the upper band is not greater than the lower band or if the data is invalid (e.g., na), it defaults to 0.5 (the midline).
The average of these three positions (avg_pos) represents the normalized position for that timeframe, ranging from 0 (at the lower band) to 1 (at the upper band).
Multi-Timeframe Averaging:
The indicator fetches Bollinger Band data from four customizable timeframes (default: 30min, 60min, 240min, daily) using request.security() with lookahead=barmerge.lookahead_on to get the latest available data.
It calculates the normalized position (pos1, pos2, pos3, pos4) for each timeframe using f_getBBPosition().
These four positions are then averaged to produce the final avg_position:avg_position = (pos1 + pos2 + pos3 + pos4) / 4
This average is the oscillator value, which is plotted and typically oscillates between 0 and 1.
Moving Averages:
Two optional moving averages (MA1 and MA2) of the avg_position can be enabled, calculated using simple moving averages (ta.sma) with customizable lengths (default: 5 and 10).
These can be potentially used for MA crossover strategies.
What Is Being Averaged?
The oscillator (avg_position) is the average of the normalized price positions within the Bollinger Bands across the four selected timeframes. Specifically:It averages the avg_pos values (pos1, pos2, pos3, pos4) calculated for each timeframe.
Each avg_pos is itself an average of the normalized positions of the high, low, and close prices relative to the Bollinger Bands for that timeframe.
This multi-timeframe averaging smooths out short-term fluctuations and provides a broader perspective on the price's position within the volatility bands.
Interpretation:
0.0 The price is at or below the lower Bollinger Band across all timeframes (indicating potential oversold conditions).
0.15: A customizable level (green band) which can be used for exiting short positions or entering long positions.
0.5: The midline, where the price is at the average of the Bollinger Bands (neutral zone).
0.85: A customizable level (orange band) which can be used for exiting long positions or entering short positions.
1.0: The price is at or above the upper Bollinger Band across all timeframes (indicating potential overbought conditions).
The colored regions and moving averages (if enabled) help identify trends or crossovers for trading signals.
Example:
If the 30min timeframe shows the close at the upper band (position = 1.0), the 60min at the midline (position = 0.5), the 240min at the lower band (position = 0.0), and the daily at the upper band (position = 1.0), the avg_position would be:(1.0 + 0.5 + 0.0 + 1.0) / 4 = 0.625
This value (0.625) would plot in the orange region (between 0.85 and 0.5), suggesting the price is relatively strong but not at an extreme.
Notes:
The use of lookahead=barmerge.lookahead_on ensures the indicator uses the latest available data, making it more real-time, though its effectiveness depends on the chart timeframe and TradingView's data feed.
The indicator’s sensitivity can be adjusted by changing bb_length ("Bollinger Band MA Length" in the Input tab), bb_mult ("Bollinger Band Standard Deviation," also in the Input tab), or the selected timeframes.

VWAP Multi-TimeframeThis is a multi-timeframe VWAP indicator that provides volume weighted average price calculations for the following time periods:
15min
30min
1H
2H
4H
6H
8H
12H
1D
1W
1M
3M
6M
1Y
You can use the lower timeframes for short term trend control areas and use the longer timeframes for long term trend control areas. Trade in the direction of the trend and watch for price reactions that you can trade when price gets close to or touches any of these levels.
This indicator will provide a data plot value of 1 for bullish when price is above all VWAPs that are turned on, -1 for bearish when price is below all VWAPs that are turned on and 0 for neutral when price is not above or below all VWAPs. Use this 1, -1, 0 value as a filter on your signal generating indicators so that you can prevent signals from coming in unless they are in the same direction as the VWAP trend.
Features
Trend direction value of 1, -1 or 0 to send to external indicators so you can filter your signal generating indicators using the VWAP trend.
Trend table that shows you whether price is above or below all of the major VWAPs. This includes the daily, weekly, monthly and yearly VWAPs.
Trend coloring between each VWAP and the close price of each candle so you can easily identify the trend direction.
Customization
Set the source value to use for all of the VWAP calculations. The default is HLC3.
Turn on or off each VWAP.
Change the color of each VWAP line.
Change the thickness of each VWAP line.
Turn on or off labels for each VWAP or turn all labels on or off at once.
Change the offset length from the current bar to the label text.
Change the label text color.
Turn on or off trend coloring for each VWAP.
Change the color for up trends and down trends.
Turn on or off the trend direction display table.
Change the location of the trend direction display table.
Adjust the background and text colors on the trend direction display table.
How To Use The Trend Direction Filtering Feature
The indicator will provide a data plot value of 1 for bullish when price is above all of the VWAPs that are turned on, a value of -1 for bearish when price is below all of the VWAPS that are turned on and a value of 0 for neutral when price is above and below some of the VWAPs that are turned on.
The name of the value to use with your external indicators will show up as: VWAP Multi-Timeframe: Trend Direction To Send To External Indicators
Make sure to use that as your source on your external indicators to get the correct values.
This 1, -1 or 0 value can then be used by another external indicator to tell the indicator what is allowed to do. For instance if you have another indicator that provides buy and sell signals, you can use this trend direction value to prevent your other indicator from giving a sell signal when the VWAP trend is bullish or prevent your other indicator from giving a buy signal when the VWAP trend is bearish.
You will need to program your other indicators to use this trend filtering feature, but this indicator is already set up with this filtering code so you can use it with any other indicator that you choose to filter(if you know how to customize pine script).
Markets You Can Use This Indicator On
This indicator uses volume and price to calculate values, so it will work on any chart that provides volume and price data.

Complete HTF Candles by InzaghiThis indicator overlays Higher Time Frame (HTF) candles directly onto your lower-timeframe charts, providing a seamless multi-timeframe perspective.
Key Features:
1. HTF Candles with LTF Period Separators & Text Labels
2. CISD (Change in State of Delivery) – A toggleable feature that can be turned on/off in settings to instantly enhance price action interpretation.
3. Custom Watermark – Add your own title and subtitle, while also displaying the current date and symbol information directly on the chart.

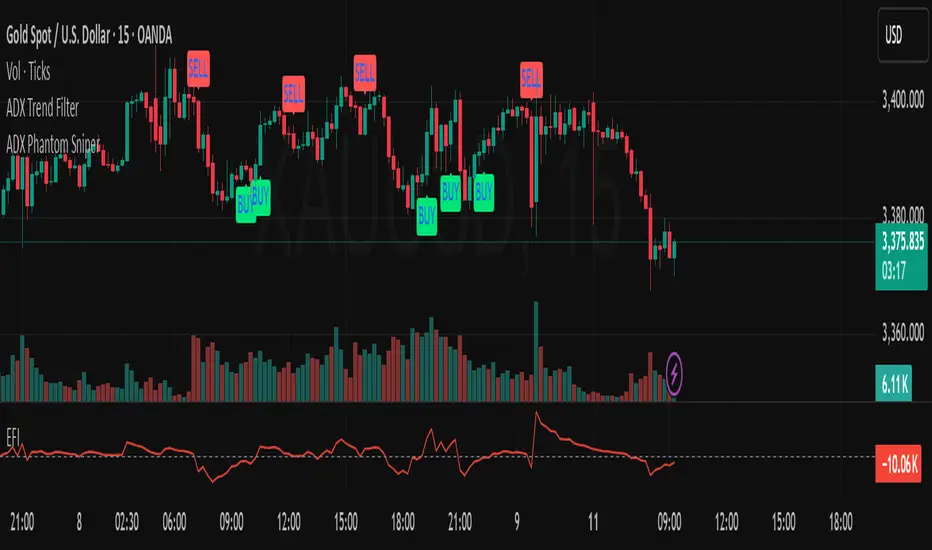
ADX Phantom SniperADX Phantom Sniper is a precision trend-following tool that combines three powerful forces:
1. ADX & DI Crossover Trigger – Detects strong directional moves only when the trend strength exceeds a defined threshold.
2. Multi-Timeframe (MTF) Confirmation – Executes on the current chart timeframe (e.g., M15) only if the higher timeframe (H1) confirms the same trend direction.
3. Force Index Momentum Filter – Filters entries based on bullish/bearish momentum to avoid weak signals.
Signal Logic:
BUY: EMA14 > EMA100, price above EMA14, +DI crosses above -DI, ADX > threshold, Stochastic crosses above signal line in the bullish zone (>50), MTF trend aligned, Force Index > 0 (optional).
SELL: EMA14 < EMA100, price below EMA14, -DI crosses above +DI, ADX > threshold, Stochastic crosses below signal line in the bearish zone (<50), MTF trend aligned, Force Index < 0 (optional).
Features:
Noise filtering with trend structure + higher timeframe alignment
On-chart BUY/SELL labels for easy signal spotting
Optional Force Index filter toggle
Adjustable ADX threshold, EMA lengths, Stochastic settings, and higher timeframe choice
Suitable for scalping and swing entries depending on timeframe
Recommended Setup:
Primary chart: M15
Higher timeframe confirmation: H1
Combine with your preferred risk management rules.
Disclaimer:
This tool is for educational purposes only and is not financial advice. Past performance does not guarantee future results. Use at your own risk.
Mutanabby_AI | Fresh Algo V24Mutanabby_AI | Fresh Algo V24: Advanced Multi-Mode Trading System
Overview
The Mutanabby_AI Fresh Algo V24 represents a sophisticated evolution of multi-component trading systems that adapts to various market conditions through advanced operational configurations and enhanced analytical capabilities. This comprehensive indicator provides traders with multiple signal generation approaches, specialized assistant functions, and dynamic risk management tools designed for professional market analysis across diverse trading environments.
Primary Signal Generation Framework
The Fresh Algo V24 operates through two fundamental signal generation approaches that accommodate different market perspectives and trading philosophies. The Trending Signals Mode serves as the primary trend-following mechanism, combining Wave Trend Oscillator analysis with Supertrend directional signals and Squeeze Momentum breakout detection. This mode incorporates ADX filtering that requires values exceeding 20 to ensure sufficient trend strength exists before signal activation, making it particularly effective during sustained directional market movements where momentum persistence creates profitable trading opportunities.
The Contrarian Signals Mode provides an alternative approach targeting reversal opportunities through extreme market condition identification. This mode activates when the Wave Trend Oscillator reaches critical threshold levels, specifically when readings surpass 65 indicating potential bearish reversal conditions or drop below 35 suggesting bullish reversal opportunities. This methodology proves valuable during overextended market phases where mean reversion becomes statistically probable.
Advanced Filtering Mechanisms
The system incorporates multiple sophisticated filtering mechanisms designed to enhance signal quality and reduce false positive occurrences. The High Volume Filter requires volume expansion confirmation before signal activation, utilizing exponential moving average calculations to ensure institutional participation accompanies price movements. This filter substantially improves signal reliability by eliminating low-conviction breakouts that lack adequate volume support from professional market participants.
The Strong Filter provides additional trend confirmation through 200-period exponential moving average analysis. Long position signals require price action above this benchmark level, while short position signals necessitate price action below it. This ensures strategic alignment with longer-term trend direction and reduces the probability of trading against major market movements that could invalidate shorter-term signals.
Cloud Filter Configuration System
The Fresh Algo V24 offers four distinct cloud filter configurations, each optimized for specific trading timeframes and market approaches. The Smooth Cloud Filter utilizes the mathematical relationship between 150-period and 250-period exponential moving averages, providing stable trend identification suitable for position trading strategies. This configuration generates signals exclusively when price action aligns with cloud direction, creating a more deliberate but highly reliable signal generation process.
The Swing Cloud Filter employs modified Supertrend calculations with parameters specifically optimized for swing trading timeframes. This filter achieves optimal balance between responsiveness and stability, adapting effectively to medium-term price movements while filtering excessive market noise that typically affects shorter-term analytical systems.
For active intraday traders, the Scalping Cloud Filter utilizes accelerated Supertrend calculations designed to capture rapid trend changes effectively. This configuration provides enhanced signal generation frequency suitable for compressed timeframe strategies. The advanced Scalping+ Cloud Filter incorporates Hull Moving Average confirmation, delivering maximum responsiveness for ultra-short-term trading while maintaining signal quality through additional momentum validation processes.
Specialized Assistant Functionality
The system includes two distinct assistant modes that provide supplementary market analysis capabilities. The Trend Assistant Mode activates advanced cloud analysis overlays that display dynamic support and resistance zones calculated through adaptive volatility algorithms. These levels automatically adjust to current market conditions, providing visual guidance for identifying trend continuation patterns and potential reversal areas with mathematical precision.
The Trend Tracker Mode concentrates on long-term trend identification by displaying major exponential moving averages with color-coded fill areas that clarify directional bias. This mode maintains visual simplicity while providing comprehensive trend context evaluation, enabling traders to quickly assess broader market direction and align shorter-term strategies accordingly.
Dynamic Risk Management System
The integrated risk management system automatically adapts across all operational modes, calculating stop loss and take profit targets using Average True Range multiples that adjust to current market volatility. This approach ensures consistent risk parameters regardless of selected operational mode while maintaining relevance to prevailing market conditions.
Stop loss placement occurs at dynamically calculated distances from entry points, while three progressive take profit targets establish at customizable ATR multiples respectively. The system automatically updates these levels upon trend direction changes, ensuring current market volatility influences all risk calculations and maintains appropriate risk-reward ratios throughout trade management.
Comprehensive Market Analysis Dashboard
The sophisticated dashboard provides real-time market analysis including volatility measurements, institutional activity assessment, and multi-timeframe trend evaluation across five-minute through four-hour periods. This comprehensive market context assists traders in selecting appropriate operational modes based on current market characteristics rather than relying exclusively on historical performance data.
The multi-timeframe analysis ensures mode selection considers broader market context beyond the primary trading timeframe, improving overall strategic alignment and reducing conflicts between different temporal market perspectives. The dashboard displays market state classification, volatility percentages, institutional activity levels, current trading session information, and trend pressure indicators with professional formatting and clear visual hierarchy.
Enhanced Trading Assistants
The Fresh Algo V24 includes specialized trading assistant features that complement the primary signal generation system. The Reversal Dot functionality identifies potential reversal points through Wave Trend Oscillator analysis, displaying visual indicators when crossover conditions occur at extreme levels. These reversal indicators provide early warning signals for potential trend changes before they appear in the primary signal system.
The Dynamic Take Profit Labels feature automatically identifies optimal profit-taking opportunities through RSI threshold analysis, marking potential exit points at multiple levels for long positions and corresponding levels for short positions. This automated profit management system helps traders optimize exit timing without requiring constant manual monitoring of technical indicators.
Advanced Alert System
The comprehensive alert system accommodates all operational modes while providing granular notification control for various signal types and risk management events. Traders can configure separate alerts for normal buy signals, strong buy signals, normal sell signals, strong sell signals, stop loss triggers, and individual take profit target achievements.
Cloud crossover alerts notify traders when trend direction changes occur, providing early indication of potential strategy adjustments. The alert system includes detailed trade setup information, timeframe data, and relevant entry and exit levels, ensuring traders receive complete context for informed decision-making without requiring constant chart monitoring.
Technical Foundation Architecture
The Fresh Algo V24 combines multiple proven technical analysis components including Wave Trend Oscillator for momentum assessment, Supertrend for directional bias determination, Squeeze Momentum for volatility analysis, and various exponential moving averages for trend confirmation. Each component contributes specific market insights while the unified system provides comprehensive market evaluation through their mathematical integration.
The multi-component approach reduces dependency on individual indicator limitations while leveraging the analytical strengths of each technical tool. This creates a robust analytical framework capable of adapting to diverse market conditions through appropriate mode selection and parameter optimization, ensuring consistent performance across varying market environments.
Market State Classification
The indicator incorporates advanced market state classification through ADX analysis, distinguishing between trending, ranging, and transitional market conditions. This classification system automatically adjusts signal sensitivity and filtering parameters based on current market characteristics, optimizing performance for prevailing conditions rather than applying static analytical approaches.
The volatility measurement system calculates current market activity levels as percentages, providing quantitative assessment of market energy and helping traders select appropriate operational modes. Institutional activity detection through volume analysis ensures signal generation aligns with professional market participation patterns.
Implementation Strategy Considerations
Successful implementation requires careful matching of operational modes to prevailing market conditions and individual trading objectives. Trending modes demonstrate optimal performance during directional markets with sustained momentum characteristics, while contrarian modes excel during range-bound or overextended market conditions where reversal probability increases.
The cloud filter configurations provide varying degrees of confirmation strength, with smoother settings reducing false signal occurrence at the expense of some responsiveness to price changes. Traders must balance signal quality against signal frequency based on their risk tolerance and available trading time, utilizing the comprehensive customization options to optimize performance for their specific requirements.
Multi-Timeframe Integration
The system provides seamless multi-timeframe analysis through the integrated dashboard, displaying trend alignment across multiple time horizons from five-minute through four-hour periods. This analysis helps traders understand broader market context and avoid conflicts between different temporal perspectives that could compromise trade outcomes.
Session analysis identifies current trading session characteristics, providing context for expected market behavior patterns and helping traders adjust their approach based on typical session volatility and participation levels. This geographic market awareness enhances strategic decision-making and improves timing for trade execution.
Advanced Visualization Features
The indicator includes sophisticated visualization capabilities through gradient candle coloring based on MACD analysis, providing immediate visual feedback on momentum strength and direction. This enhancement allows rapid market assessment without requiring detailed indicator analysis, improving efficiency for traders managing multiple instruments simultaneously.
The cloud visualization system uses color-coded fill areas to clearly indicate trend direction and strength, with automatic adaptation to selected operational modes. This visual clarity reduces analytical complexity while maintaining comprehensive market information display through professional chart presentation.
Performance Optimization Framework
The Fresh Algo V24 incorporates performance optimization features including signal strength classification, automatic parameter adjustment based on market conditions, and dynamic filtering that adapts to current volatility levels. These optimizations ensure consistent performance across varying market environments while maintaining signal quality standards.
The system automatically adjusts sensitivity levels based on selected operational modes, ensuring appropriate responsiveness for different trading approaches. This adaptive framework reduces the need for manual parameter adjustments while maintaining optimal performance characteristics for each operational configuration.
Conclusion
The Mutanabby_AI Fresh Algo V24 represents a comprehensive solution for professional trading analysis, combining multiple analytical approaches with advanced visualization and risk management capabilities. The system's strength lies in its adaptive multi-mode design and sophisticated filtering mechanisms, providing traders with versatile tools for various market conditions and trading styles.
Success with this system requires understanding the relationship between different operational modes and their optimal application scenarios. The comprehensive dashboard and alert system provide essential market context and trade management support, enabling systematic approach to market analysis while maintaining flexibility for individual trading preferences.
The indicator's sophisticated architecture and extensive customization options make it suitable for traders at all experience levels, from those seeking systematic signal generation to advanced practitioners requiring comprehensive market analysis tools. The multi-timeframe integration and adaptive filtering ensure consistent performance across diverse market conditions while providing clear guidelines for strategic implementation.

Fundur - Market Sentiment BIndicator Overview
The Market Sentiment B indicator is a sophisticated multi-timeframe momentum oscillator that provides comprehensive market analysis through advanced wave theory and sentiment measurement. Unlike traditional single-timeframe indicators, Market Sentiment B analyzes 11 different timeframes simultaneously to create a unified view of market momentum and sentiment.
What Makes Market Sentiment B Unique
Multi-Timeframe Convergence : The indicator combines data from 11 different periods (8, 13, 21, 34, 55, 89, 144, 233, 377, 610, 987) based on mathematical sequences that naturally occur in market cycles.
Advanced Wave Analysis : The histogram component tracks momentum waves with precise peak and trough identification, allowing traders to spot both major moves and smaller precursor waves.
Sentiment Extremes Detection : When all 11 timeframes reach extreme levels simultaneously, the indicator highlights these rare conditions with background coloring, signaling potential major reversals.
Dynamic Zone Analysis : The indicator divides market conditions into Premium (80+), Discount (20-), and Liquidity zones (40-60), providing clear context for trade entries and exits.
Core Components
1. Market Sentiment B Line (Main Signal)
The primary oscillator line that represents the averaged sentiment across all timeframes. This line uses advanced mathematical filtering to smooth out noise while preserving important trend changes.
Key Features:
Oscillates between 0-100
Color-coded: Green when rising, Red when falling
Shows divergences with colored dots
Premium zone: 80+, Discount zone: 20-
2. Momentum Waves (Secondary Signal)
A smoothed version of the Market Sentiment B line that acts as a trend-following component. This line helps identify the underlying momentum direction.
Key Features:
Blue coloring during bullish expansion (above 50 and rising)
Orange coloring during bearish expansion (below 50 and falling)
Filled areas show expansion and contraction phases
Critical 50-line crossovers signal momentum shifts
3. Histogram (Wave Analysis)
The difference between Market Sentiment B and Momentum Waves, displayed as a histogram that reveals the relationship between current sentiment and underlying momentum.
Key Features:
Green bars: Positive momentum (Market Sentiment above Momentum Waves)
Red bars: Negative momentum (Market Sentiment below Momentum Waves)
Wave height labels show the strength of each wave
Divergence patterns identify potential reversals
4. Divergence System
Advanced divergence detection that identifies both regular and hidden divergences, with special "Golden Divergences" for the strongest signals.
Types:
Regular Divergences : Price makes new highs/lows while indicator doesn't
Hidden Divergences : Continuation patterns in trending markets
Golden Divergences : High-probability reversal signals (orange dots)
5. Zone Analysis
The indicator divides market conditions into distinct zones:
Premium Zone (80-100) : Potential selling area
Liquidity Zone (40-60) : Neutral/consolidation area (highlighted in orange)
Discount Zone (0-20) : Potential buying area
Extreme Conditions : Background coloring when all timeframes align
Setup Guide
Initial Installation
Open TradingView and navigate to your desired chart
Click the "Indicators" button or press "/" key
Search for "Fundur - Market Sentiment B"
Click on the indicator to add it to your chart
The indicator will appear in a separate pane below your chart
Essential Settings Configuration
Main Settings
Show Histogram Wave Values : Enable to see wave strength numbers
Wave Value Text Size : Choose from tiny, small, normal, or large
Wave Label Offset : Adjust label positioning (default: 2)
Market Sentiment Thresholds
Only Show Indicators at Market Sentiment Extremes : Filter signals to extreme zones only
Extreme levels are automatically set at 80 (high) and 20 (low)
Small Wave Strategy
Enable Small Wave Swing Strategy : Focus on smaller, early-warning waves
Small Wave Label Color : Customize the color for small wave labels
Divergence Analysis
Show Regular Divergences : Enable standard divergence detection
Show Gold Divergence Dots : Enable high-probability golden signals
Show Divergence Dots : Show all divergence markers
Histogram Settings
Enable Histogram : Toggle the histogram display
Divergence Types : Choose which types to display (Bullish/Bearish Reversals and Continuations)
Recommended Initial Setup
Enable all main components (Histogram, Divergences, Momentum Waves)
Set wave value text size to "small" for clarity
Enable golden divergence dots for premium signals
Start with all alert categories enabled, then customize based on your trading style
Basic Trading Guide
Understanding the Zones
Premium Zone Trading (80-100)
When to Consider Selling:
Market Sentiment B enters 80+ zone
Bearish divergences appear
Histogram shows weakening momentum (smaller green waves)
Background turns red (extreme conditions)
What to Look For:
Bearish pivot signals (orange triangles pointing down)
Golden divergence dots at tops
Momentum Waves turning bearish
Discount Zone Trading (0-20)
When to Consider Buying:
Market Sentiment B enters 0-20 zone
Bullish divergences appear
Histogram shows strengthening momentum (smaller red waves)
Background turns green (extreme conditions)
What to Look For:
Bullish pivot signals (blue triangles pointing up)
Golden divergence dots at bottoms
Momentum Waves turning bullish
Liquidity Zone Trading (40-60)
Consolidation and Breakout Zone:
Orange-filled area indicates neutral sentiment
Wait for clear breaks above 60 or below 40
Use for range-bound trading strategies
Look for momentum wave direction changes
Key Signal Types
1. Zone Crossovers
Above 60 : Bullish momentum building
Below 40 : Bearish momentum building
50-line crosses : Primary trend changes
2. Divergence Signals
Golden dots : Strongest reversal signals that align accross different timeframes
Colored dots : Standard divergence warnings
Hidden divergences : Trend continuation signals
3. Histogram Patterns
Increasing green bars : Building bullish momentum
Increasing red bars : Building bearish momentum
Smaller waves : Early warning signals of deteriorating interest
Basic Entry Rules
Long Entries
Market Sentiment B in discount zone (0-20) OR
Bullish divergence confirmed OR
Break above 40 from oversold conditions OR
Golden divergence dot at bottom
Short Entries
Market Sentiment B in premium zone (80-100) OR
Bearish divergence confirmed OR
Break below 60 from overbought conditions OR
Golden divergence dot at top
Exit Rules
Exit longs when entering premium zone
Exit shorts when entering discount zone
Close positions on opposite divergence signals
Use histogram wave tops/bottoms for fine-tuning exits
Advanced Analysis Setups
Setup 1: Scalping Configuration
Purpose : Quick intraday trades focusing on small moves
Settings :
Enable Small Wave Strategy
Show indicators only at extremes: OFF
Combine multiple alerts: ON
Focus on 1-5 minute timeframes
Signals to Watch :
Small wave histogram peaks/troughs
Quick zone crossovers (40/60 line breaks)
Momentum wave direction changes
Short-term divergences
Setup 2: Swing Trading Configuration
Purpose : Medium-term trend following and reversal trading
Settings :
Show indicators only at extremes: ON
Enable all divergence types
Focus on 15-minute to 4-hour timeframes
Golden divergence alerts: HIGH priority
Signals to Watch :
Premium/discount zone entries
Golden divergence signals
Extreme condition backgrounds
Major histogram wave formations
Setup 3: Position Trading Configuration
Purpose : Long-term trend identification and major reversal spots
Settings :
Only alert in extremes: ON
Focus on golden divergences only
Use daily and weekly timeframes
Minimize noise with extreme filtering
Signals to Watch :
Extreme condition backgrounds (red/green)
Major golden divergence signals
Long-term momentum wave trends
Weekly/monthly zone transitions
Setup 4: Reversal Hunting Configuration
Purpose : Catching major market turns at key levels
Settings :
Enable all divergence types
Show golden divergence dots: ON
Extreme filtering: ON
Small wave strategy: OFF
Signals to Watch :
Multiple divergence confirmations
Golden divergence + extreme zones
All-timeframe extreme conditions
Major histogram wave exhaustion
Setup 5: Trend Following Configuration
Purpose : Riding momentum in established trends
Settings :
Momentum waves: HIGH priority
Hidden divergences: ON
Continuation patterns focus
Zone crossover alerts
Signals to Watch :
Momentum wave expansion phases
Hidden divergence continuations
Liquidity zone breakouts
Sustained momentum patterns
Alert System
The Market Sentiment B indicator features a comprehensive alert system with over 30 different alert types organized into logical categories.
Alert Categories
Market Sentiment B Line Alerts
Golden Divergences : Highest priority reversal signals
Standard Divergences : Regular divergence patterns
Bearish/Bullish Pivots : Momentum pivot points
Premium/Discount Zone : Zone entry/exit alerts
Extreme Conditions : Rare all-timeframe extremes
Liquidity Zone : 40-60 zone movement alerts
Momentum Waves Alerts
Premium/Discount Zones : 80+/20- level alerts
Liquidity Zone Movement : 40-60 zone alerts
Expansion Phases : Bullish/bearish expansion alerts
Direction Changes : 50-line crossover alerts
Cross Alerts : MSB vs Momentum crossovers
Histogram Alerts
State Changes : Bullish/bearish turns
Peak/Trough Detection : Wave top/bottom alerts
Divergence Alerts : Histogram-specific divergences
Hidden Divergences : Continuation pattern alerts
Smaller Wave Alerts : Early warning signals
Alert Configuration Tips
For Day Trading
Enable quick state change alerts
Focus on histogram and small wave alerts
Use combined alerts to reduce noise
Disable extreme-only filtering
For Swing Trading
Enable zone crossover alerts
Focus on divergence and pivot alerts
Use extreme-only filtering
Prioritize golden divergence alerts
For Position Trading
Enable only golden divergences and extreme conditions
Use extreme-only filtering
Focus on major zone transitions
Disable minor wave alerts
Trading Strategies
Strategy 1: Premium/Discount Zone Reversal
Setup : Wait for Market Sentiment B to reach extreme zones
Entry :
Long: Enter discount zone (0-20) with bullish divergence
Short: Enter premium zone (80-100) with bearish divergence
Exit : Opposite zone reached or momentum wave reversal
Risk Management : Stop loss at recent swing high/low
Strategy 2: Golden Divergence Power Plays
Setup : Wait for golden divergence dots to appear
Entry : Enter in direction opposite to divergence (reversal play)
Confirmation : Wait for momentum wave to confirm direction
Exit : When sentiment reaches opposite zone
Risk Management : Tight stops below/above divergent pivot
Strategy 3: Momentum Wave Trend Following
Setup : Identify strong momentum wave expansion phases
Entry : Enter on pullbacks to 50-line during expansion
Continuation : Hold while expansion phase continues
Exit : When expansion phase ends or opposite expansion begins
Risk Management : Trail stops using wave peaks/troughs
Strategy 4: Small Wave Early Entry
Setup : Enable Small Wave Strategy for early signals
Entry : Enter on small wave formations before major moves
Confirmation : Wait for main sentiment line to follow
Exit : When major wave forms or opposite signal appears
Risk Management : Quick exits if main indicator doesn't confirm
Strategy 5: Extreme Condition Contrarian
Setup : Wait for background color changes (extreme conditions)
Entry : Counter-trend when ALL timeframes are extreme
Confirmation : Look for early divergence signs
Exit : When background color disappears
Risk Management : Position size smaller due to counter-trend nature
FAQ & Troubleshooting
Frequently Asked Questions
Q: Why don't I see any signals on my chart?
A: Check if "Only Show Indicators at Market Sentiment Extremes" is enabled. If so, signals only appear when the indicator is above 80 or below 20.
Q: What's the difference between golden and standard divergences?
A: Golden divergences (orange dots) are higher-probability signals that meet additional criteria for strength and momentum alignment. Standard divergences are regular price/indicator disagreements.
Q: How do I reduce alert noise?
A: Enable "Only Alert In Extremes" in the alert settings, or use "Combine Multiple Alerts" to consolidate multiple signals into single messages.
Q: What timeframe works best with this indicator?
A: The indicator works on all timeframes. For day trading, use 1-15 minutes. For swing trading, use 1-4 hours. For position trading, use daily or weekly.
Q: Why are the histogram wave values important?
A: Wave values show the strength of momentum. Declining wave values (smaller peaks) often precede trend changes, while increasing values confirm trend strength.
Troubleshooting Common Issues
Issue: Indicator not loading
Solution: Ensure you're using TradingView Pro or higher
Check that max_bars_back is set appropriately
Refresh the chart and re-add the indicator
Issue: Too many alerts firing
Solution: Enable extreme-only filtering
Disable less important alert categories
Use combined alerts feature
Issue: Missing divergence signals
Solution: Check that divergence detection is enabled
Ensure you're looking in the correct zones
Verify that extreme filtering isn't hiding signals
Issue: Histogram not displaying
Solution: Check that "Enable Histogram" is turned ON
Verify histogram divergence types are enabled
Ensure the chart has sufficient historical data
Best Practices
Start Simple : Begin with basic zone trading before using advanced features
Paper Trade First : Test strategies with paper trading before risking capital
Combine with Price Action : Use the indicator alongside support/resistance levels
Respect Risk Management : Never risk more than you can afford to lose
Keep Learning : Market conditions change; adapt your usage accordingly
Performance Optimization
Use appropriate timeframes for your trading style
Enable only necessary alert types
Consider using extreme filtering during high-volatility periods
Regularly review and adjust settings based on market conditions
Conclusion
The Market Sentiment B indicator represents a sophisticated approach to market analysis, combining multiple timeframes, advanced wave theory, and comprehensive divergence detection into a single powerful tool. Whether you're a scalper looking for quick opportunities or a position trader seeking major reversals, this indicator provides the insights needed to make informed trading decisions.
Remember that no indicator is perfect, and the Market Sentiment B should be used as part of a comprehensive trading plan that includes proper risk management, fundamental analysis awareness, and sound money management principles.
Happy Trading!
Disclaimer: Trading involves substantial risk and is not suitable for all investors. Past performance is not indicative of future results. Always practice proper risk management and never trade with money you cannot afford to lose.

Multi-Timeframe SeparatorThis indicator draws vertical separator lines at the start of each candle from a higher timeframe, allowing you to visually align your current chart with key multi-timeframe structure such as 4H, Daily, Weekly, etc.
