RC - Crypto Scalper v3Cryptocurrency scalping strategy for perpetual futures with risk management and automation capabilities.
## Strategy Overview
This strategy identifies high-probability scalping opportunities in cryptocurrency perpetual futures markets using adaptive position sizing, dynamic stop losses, and intelligent exit management to maintain consistent risk-adjusted returns across varying market conditions.
## Technical Foundation
The strategy employs exponential moving averages for trend detection, Bollinger Bands for volatility measurement and mean reversion signals, RSI for momentum confirmation and overbought/oversold conditions, ATR for dynamic volatility-based stop placement, and VWAP for institutional price level identification. These technical indicators are combined with volume analysis and optional multi-timeframe confirmation to filter low-probability setups.
## Entry Methodology
The strategy identifies trading opportunities using three complementary approaches that can be enabled individually or in combination:
Momentum-Based Entries: Detects directional price movements aligned with short-term and intermediate-term trend indicators, with momentum oscillator confirmation to avoid entries at exhaustion points. Volume analysis provides additional confirmation of institutional participation.
Mean Reversion Entries: Identifies price extremes using statistical volatility bands combined with momentum divergence, targeting high-probability reversal zones in ranging market conditions. Entries require initial price structure confirmation to reduce false signals.
Institutional Flow Entries: Monitors volume-weighted price levels to identify areas where institutional orders are likely concentrated, entering on confirmed breaks of these key levels with supporting directional bias from trend indicators.
Each methodology uses distinct combinations of the technical indicators mentioned above, with specific parameter relationships and confirmation requirements that can be customized based on trader preference and market conditions.
## Exit Framework
Adaptive Stop Loss: Uses ATR-based stops (default 0.7x multiplier on 14-period ATR) that automatically adjust to current market volatility. Stop distance expands during volatile periods to avoid premature stops while tightening during consolidation to protect capital. Alternative percentage-based stops available for traders preferring fixed-distance risk management.
Trailing Profit System: Employs a dual-target exit approach combining fixed limit orders with dynamic trailing stops. The system activates trailing stops when positions reach profitable thresholds, allowing winning trades to capture extended moves while protecting accumulated gains. The high fixed limit (6R default) serves as a ceiling for exceptional moves while the trailing mechanism handles the majority of exits at optimal profit levels.
Time-Based Management: Implements maximum holding period constraints (50 bars default) to prevent capital from being trapped in directionless price action. This ensures consistent capital turnover and prevents the strategy from holding through extended consolidation periods.
Breakeven Protection: Automatically adjusts stop loss to entry price plus commission costs once trades reach predefined profit thresholds (0.7R default), eliminating downside risk on positions that have demonstrated directional follow-through.
## Risk Management
Position Sizing: Dynamic position sizing based on account equity percentage risk model (2% default). Calculates optimal position size based on entry price, stop distance, and account risk tolerance. Includes maximum position exposure caps and minimum position size thresholds to ensure practical trade execution.
Daily Loss Limits: Automatic trading suspension when intraday losses exceed configured threshold (5% of equity default). Prevents catastrophic drawdown days and removes emotional decision-making during adverse market conditions. Resets automatically at the start of each new trading day.
Leverage Controls: Comprehensive leverage monitoring with built-in liquidation protection for margined positions. Strategy calculates liquidation prices based on leverage settings and automatically closes positions approaching critical margin levels, preventing forced liquidations.
Exposure Management: Multiple layers of position size controls including maximum position value as percentage of equity (50% default), leverage-adjusted margin requirements, and minimum capital availability thresholds before opening new positions.
## Market Filters
Session-Based Filtering: Configurable trading windows for Asian (00:00-08:00 UTC), London (08:00-16:00 UTC), and New York (13:00-21:00 UTC) sessions. Allows traders to focus on specific market hours or avoid illiquid periods based on their asset and trading style.
Volatility Requirements: Minimum and maximum ATR percentage thresholds ensure strategy only operates within optimal volatility ranges. Prevents trading during both insufficient movement periods and extreme volatility events where execution quality deteriorates.
Trend Alignment: Optional higher timeframe trend filter ensures directional bias aligns with broader market structure, reducing counter-trend entries during strong directional moves.
Volume Confirmation: Configurable volume requirements for entry validation, ensuring sufficient market participation and reducing false signals during low-liquidity periods.
## Automation Support
Built-in webhook integration generates JSON payloads compatible with popular broker automation platforms. Alert system provides comprehensive notifications for all entry signals, exit executions, risk limit breaches, and daily trading status updates. Supports both automated and manual execution workflows.
## Settings Explanation
Initial Capital: $5,000
Selected as realistic starting point for retail traders entering crypto futures markets. Strategy scales proportionally - larger accounts show similar percentage returns with proportionally larger absolute gains and position sizes.
Risk Per Trade: 2%
Conservative default providing significant drawdown tolerance. With 51% historical win rate and positive expectancy, risking 2% per trade allows for extended losing streaks without account impairment. Adjustable from 0.5% (very conservative) to 5% (aggressive, experienced traders only).
Leverage: 10x
Standard cross-margin leverage for cryptocurrency perpetual futures. Combined with 2% risk setting and maximum 50% equity position size caps, actual exposure remains controlled despite leverage. Built-in liquidation protection provides additional safety layer.
Commission: 0.055%
Modeled on major exchange maker fee structures (Bybit, Binance Futures).
**Slippage: 50 ticks**
Ultra-conservative slippage assumption representing extreme worst-case execution scenarios. ETH perpetual tick size is $0.01, therefore 50 ticks equals $0.50 per side or $1.00 round trip slippage per trade.
Real-world slippage on 30-minute timeframe typically ranges from 2-5 ticks ($0.02-0.05 round trip) under normal conditions, with 10-20 ticks during highly volatile periods. The 50-tick setting assumes every single trade executes during extreme market stress conditions.
This ultra-conservative modeling approach means real-world trading performance under typical market conditions may exceed backtest results, as the strategy has been tested under punishing execution cost assumptions that represent worst-case scenarios rather than expected outcomes.
Stop Loss: ATR-based (0.7x multiplier)
Volatility-adaptive stops optimized for 30-minute cryptocurrency perpetuals. The 0.7x multiplier balances protection against premature stops due to normal market noise. Lower multipliers (0.5-0.6x) suitable for lower timeframes, higher multipliers (0.8-1.2x) for higher timeframes.
Take Profit: 6R (Risk:Reward)
High target designed to work in conjunction with trailing stop system rather than as primary exit mechanism. Historical analysis shows most profitable trades exit via trailing stops at lower multiples, with the 6R limit capturing occasional extended moves. This configuration allows the trailing stop system to operate optimally while providing upside capture on exceptional price runs.
Trailing Stop: Activates at 1R | Offset 0.5R
Trailing mechanism engages when position reaches 1:1 risk-reward, then maintains 0.5R distance from peak favourable price. This configuration allows profitable trades room to develop while protecting accumulated gains from reversals.
Maximum Holding Period: 50 bars
Automatic exit trigger after 50 bars (25 hours on 30-minute timeframe) prevents capital commitment to non-trending price action. Adjustable based on timeframe and trading style preferences.
## Backtest Performance
Test Period: November 2023 - November 2025 (2 years)
Asset: ETH/USDT Perpetual Futures
Timeframe: 30 minutes
Initial Capital: $5,000
Performance Metrics:
- Final Equity: $25,353.99
- Net Profit: $20,353.99
- Total Return: 407.08%
- Annualized Return: ~204%
- Total Trades: 2,549
- Winning Trades: 1,308 (51.28%)
- Losing Trades: 1,241 (48.72%)
- Profit Factor: 1.215
- Sharpe Ratio: 0.813
- Sortino Ratio: 6.428
- Maximum Drawdown: 11.53%
- Average Drawdown: <2%
Trade Statistics:
- Average Win: 1.15% per trade
- Average Loss: -0.98% per trade
- Win/Loss Ratio: 1.17:1
- Largest Win: 7.14%
- Largest Loss: -2.31%
- Average Trade Duration: ~8 hours
- Trades Per Month: ~106
Cost Analysis:
- Total Commission Paid: $21,277.06
- Commission as % of Gross Profit: 18.5%
- Modeled Slippage Impact: $2,549.00 (50 ticks per trade)
- Total Trading Costs: $23,826.06
- Net Profit After All Costs: $20,353.99
Risk-Adjusted Performance:
- Return/Max DD Ratio: 35.3
- Profit Per Trade: $7.98 average
- Risk of Ruin: <0.001% (with 2% risk, 51% win rate, 1.17 R:R)
## Bear Market Validation
To validate robustness across different market conditions, the strategy was additionally tested during the 2022 cryptocurrency bear market:
Test Period: May 2022 - November 2022 (7 months)
Market Conditions: ETH declined 57% (from ~$2,900 to ~$1,200)
Bear Market Results:
- Net Profit: $4,959.69
- Return: 99.19%
- Total Trades: 845
- Win Rate: 51.72%
- Maximum Drawdown: 18.54%
- Profit Factor: 1.235
- Outperformance vs Buy & Hold: +156.3%
The strategy demonstrated profitable performance during severe market decline, with short positions showing particular strength (54.1% win rate on shorts vs 49.4% on longs). This validates that the edge is not dependent on bullish market conditions and the multiple entry methodologies adapt naturally to different market environments.
## Recommended Usage
Optimal Timeframes:
- Primary: 30-minute (tested and optimized)
- Alternative: 1-hour (more selective, fewer trades)
- Not recommended: <15-minute (execution quality deteriorates)
Suitable Assets:
High-liquidity cryptocurrency perpetual futures recommended:
- BTC/USDT (>$2B daily volume)
- ETH/USDT (>$1B daily volume)
- SOL/USDT, AVAX/USDT (>$100M daily volume)
- Avoid low-liquidity pairs (<$50M daily volume)
Risk Configuration:
- Conservative: 1-1.5% per trade
- Moderate: 2-3% per trade (default: 2%)
- Aggressive: 3-5% per trade (requires discipline)
## Important Considerations
Backtesting vs Live Trading: Always paper trade first. Real-world results vary based on execution quality, broker-specific factors, network latency, and individual trade management decisions. Backtest performance represents historical simulation with ultra-conservative cost assumptions, not guaranteed future results.
Market Conditions: Strategy designed for liquid, actively-traded markets. Performance characteristics:
- Strong trends: Optimal (trailing stops capture extended moves)
- Ranging markets: Moderate (mean reversion component provides edge)
- Low volatility: Reduced (ATR filter prevents most entries)
- Extreme volatility: Protected (maximum volatility filter prevents entries)
Cost Impact: Commission represents approximately 18.5% of gross profit in backtests. The 50-tick slippage assumption is deliberately punitive - typical execution will likely be 5-10x better (2-10 ticks actual vs 50 ticks modeled), meaning real-world net results may significantly exceed backtest performance under normal market conditions.
Execution Quality: 30-minute timeframe provides sufficient time for order placement and management. Automated execution recommended for consistency. Manual execution requires discipline to follow signals without hesitation or second-guessing.
Starting Procedures:
1. Run backtest on your specific asset and timeframe
2. Paper trade for minimum 50 trades or 2 weeks
3. Start with minimum position sizes (0.5-1% risk)
4. Gradually scale to target risk levels as confidence builds
5. Monitor actual execution costs vs backtest assumptions
## Strategy Limitations
- Requires liquid markets; performance degrades significantly on low-volume pairs
- No built-in news event calendar; traders should manually avoid scheduled high-impact events
- Weekend/holiday trading may experience wider spreads and different price behaviour
- Does not model spread costs (assumes mid-price fills); add 1-2 ticks additional cost for market orders
- Performance during market structure changes (regime shifts) may differ from backtest period
- Requires consistent monitoring during active trading hours for optimal automated execution
- Slippage assumptions are deliberately extreme; actual slippage will typically be much lower
## Risk Disclosure
Cryptocurrency trading involves substantial risk of loss. Leverage amplifies both gains and losses. This strategy will experience losing streaks and drawdowns. The 11.53% maximum historical drawdown in bull market testing and 18.54% in bear market testing do not represent ceilings - larger drawdowns are possible and should be expected in live trading.
Past performance does not guarantee future results. Market conditions evolve, and historical edge may diminish or disappear. No strategy works in all market conditions. The strategy has been tested with extremely conservative slippage assumptions (50 ticks per trade) that significantly exceed typical execution costs; this provides a safety margin but does not eliminate risk.
Capital at Risk: Only trade with capital you can afford to lose completely. The strategy's positive historical performance across both bull and bear markets does not eliminate the possibility of significant losses or account impairment.
Not Financial Advice: This strategy is an educational tool, not investment advice. Users are solely responsible for their trading decisions, risk management, and outcomes. The developer assumes no liability for trading losses.
Leverage Warning: Trading with leverage can result in losses exceeding initial investment. Ensure you understand leverage mechanics and liquidation risks before using leveraged products.
## Technical Requirements
- TradingView Premium subscription (for strategy testing and alerts)
- Understanding of risk management principles
- Familiarity with perpetual futures mechanics
- Broker account supporting crypto perpetuals (if trading live)
- For automation: Webhook-compatible execution platform
## Version History
v3.0 - November 2025 (Initial Release)
- Multi-methodology entry system (Momentum, Mean Reversion, VWAP)
- Comprehensive risk management framework
- Adaptive exit system with trailing stops
- Session and volatility filtering
- Webhook automation support
- Validated across bull market (2024-25) and bear market (2022) periods
- Tested with ultra-conservative 50-tick slippage assumptions
Disclaimer: This strategy is provided "as-is" for educational purposes. Past performance does not indicate future results. All backtests conducted with 50-tick slippage (ultra-conservative assumptions). Actual trading costs typically significantly lower. Trade responsibly and at your own risk.
Średnie kroczące


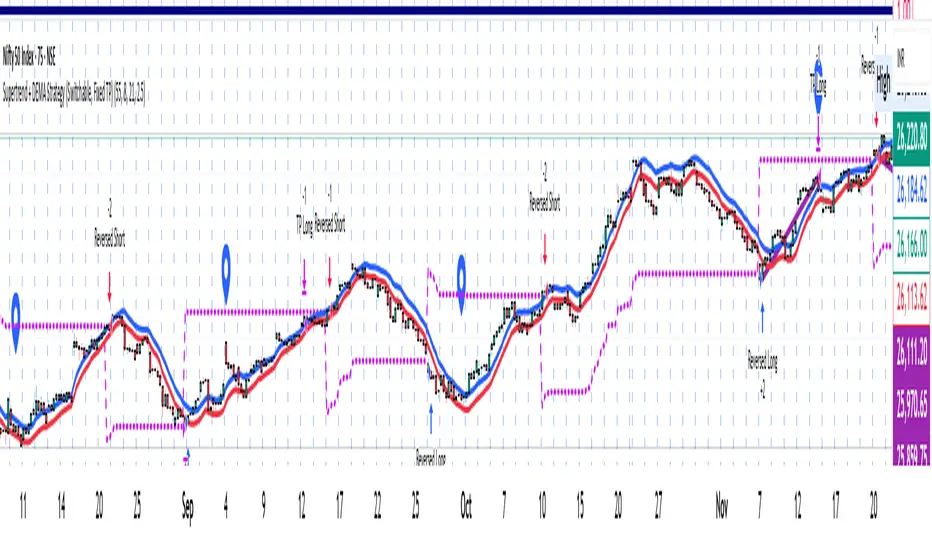
Supertrend + DEMA Strategy ( customised & Switchable, Fixed TP)Supertrend line – a moving line that follows the price and shows whether the market is trending up or down.
If the price goes above this line, it usually means the market is going up.
If the price goes below, it usually means the market is going down.
DEMA (Double Exponential Moving Average) – another line that smooths out price movements to spot trends more clearly.
It calculates an average of prices but reacts faster than a normal moving average.
VWolf – Apex GateOverview
VWolf – Apex Gate is a trend-continuation system that blends a Pivot-weighted Supertrend (PVT ST) with an optional **Normal Supertrend** trigger, all **gated by a 200-EMA directional filter. The strategy’s risk controls are volatility-aware—**stops and targets scale by ATR**, and quantity is computed from a fixed **% risk per trade**. Clear **Backtest / Forwardtest** modes with date windows let you validate on segmented datasets before committing to live use.
Recommended Use
- **Markets:** High-liquidity instruments (indices, large-cap equities, liquid FX and major crypto pairs) where trends and pullbacks are clean.
- **Timeframes:** 15m–1h for active intraday; 4h–1D for swing. Lower timeframes may benefit from stricter EMA gating and slightly wider ATR stops.
- **Workflow:**
1. Start with **Backtest** to set baseline ATR/EMA parameters.
2. Move to **Forwardtest** to confirm generalization.
3. Consider walk-forward or multi-symbol rotation to assess robustness.
Strengths & Precautions
Strengths
- **Dual engine** (PVT ST + Normal ST) improves signal quality; the **EMA gate** screens counter-trend noise.
- **ATR-native** stops/targets standardize risk across regimes/instruments.
- **Capital-proportional sizing** preserves account geometry and smooths drawdowns.
- **Clear test segmentation** supports objective evaluation.
Precautions
- **Whipsaw risk** in tight ranges: widen ATR multipliers, enable the EMA gate, or require co-confirmation.
- **Supertrend-anchored stops** can expand in volatility spikes; ensure **% risk** remains within tolerance.
- **One-position policy** avoids stacking risk but forgoes scaling into strong trends; advanced users may prefer add-on frameworks outside this baseline.
Conclusion
VWolf – Apex Gate seeks to enter shortly after **regime flips**, demanding alignment between a **pivot-aware Supertrend** and (optionally) a **classic Supertrend**, while an **EMA gate** enforces directional discipline. With **ATR-driven** stops/targets and **fixed-fraction** sizing, the system adapts naturally to changing volatility. Use the **Backtest** window to dial ranges and the **Forwardtest** window to prove durability on unseen data. For best results, tailor ATR multipliers and the EMA gate to your instrument’s structure and your personal drawdown tolerance.

NIFTY Options Breakout StrategyThis strategy trades NIFTY 50 Options (CALL & PUT) using 5-minute breakout logic, strict trend filters, expiry-based symbol validation, and a dynamic trailing-profit engine.
1️⃣ Entry Logic
Only trades NIFTY 50 options, filtered automatically by symbol.
Trades only between 10:00 AM – 2:15 PM (5m bars).
Breakout trigger:
Price enters the buy breakout zone (high of last boxLookback bars ± buffer).
Trend filter:
Price must be above EMA50 or EMA200,
AND EMA50 ≥ EMA100 (to avoid weak conditions).
Optional strengthening:
EMA20>EMA50 OR EMA50>EMA100 recent cross can be enforced.
Higher-timeframe trend check:
EMA50 > EMA200 (bullish regime only).
Start trading options only after expiry–2 months (auto-parsed).
2️⃣ One Trade Per Day
Maximum 1 long trade per day.
No shorting (long-only strategy).
3️⃣ Risk Management — SL, TP & Trailing
Includes three types of exits:
🔹 A) Hard SL/TP
Hard Stop-Loss: -15%
Hard Take-Profit: +40%
🔹 B) Step-Ladder Trailing Profit
As the option price rises, trailing activates:
Max Profit Reached Exit Trigger When Falls To
≥ 35% ≤ 30%
≥ 30% ≤ 25%
≥ 25% ≤ 20%
≥ 20% ≤ 15%
≥ 15% ≤ 10%
≥ 5% ≤ 0%
🔹 C) Loss-Recovery Exit
If loss reaches –10% but then recovers to 0%, exit at breakeven.
4️⃣ Trend-Reversal Exit
If price closes below 5m EMA50, the long is exited instantly.
5️⃣ Optional Intraday Exit
EOD square-off at 3:15 PM.
6️⃣ Alerts for Automation
The strategy provides alerts for:
BUY entry
TP/SL/Trailing exit
EMA50 reversal exit
EOD exit

Nifty Breakout Levels Strategy (v7 Hybrid)Nifty Breakout Levels Strategy (v7 Hybrid – Compounding from Start Date)
Instrument / TF: Designed for current-month NIFTY futures on 1-hour timeframe, with at most 1 trade per day.
Entry logic: Uses a 10-bar breakout box with a 0.3% buffer, plus EMA-based trend + proximity filter.
Longs: price in breakout-high zone, above EMA50/EMA200 and within proximityPts.
Shorts: price in breakout-low zone and strong downtrend (EMA10 < EMA20 < EMA50 < EMA200, price below EMA200).
Trades only when ATR(14) > atrTradeThresh and during regular hours (till 15:15).
Risk / exits: Stop loss is ATR-adaptive – max of slBasePoints (100 pts) and ATR * atrSLFactor; TP is fixed (tpPoints, e.g. 350 pts).
Longs have stepped trailing profit levels (100/150/200/250/320 pts) that lock in gains on pullbacks.
Shorts have trailing loss-reduction levels (80/120/140 pts) to cut improving losses.
Additional exit: 1H EMA50 2-bar reversal against the position, plus optional EOD flatten at 3:15 PM.
Compounding engine: From a chosen start date, equity is rebased to startCapital, and lot size scales dynamically as equity / capitalPerLot, with automatic lot reductions at three drawdown thresholds (ddCut1 / 2 / 3).
Automation: All entries and exits are exposed via alertconditions (long/short entry & exit) so the strategy can be connected to broker/webhook automation.

15m ORB Breakout NAS100 (5m Mgmt) v6 - OptimizedOpening Range Breakout Strategy
Buy and sell signals are given upon break of market session opening range. Best utilized for 30 minute NY opening range, managed on 5 min timeframe on NAS100. Tweak the settings for higher win rate on backtesting dashboard before implementing strategy.

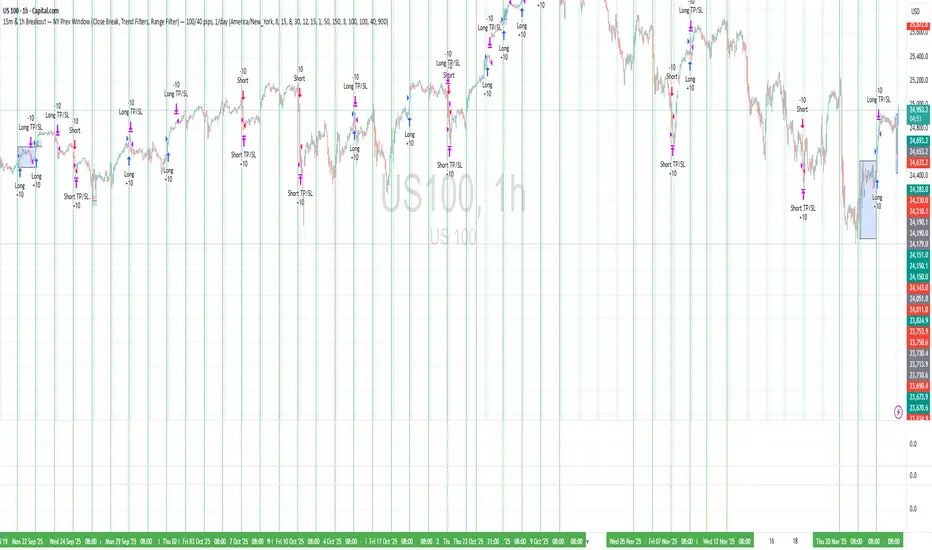
15m & 1h Breakout — NY Prev Window Define a session anchored at 09:15 New York time, adjusted safely around weekends.
For each new session, store the high and low of the previous session’s 09:15→09:15 window.
During a configurable entry window (default: 09:30–11:15 NY time), watch for close-based breakouts:
Long when price closes above the previous window high + buffer.
Short when price closes below the previous window low − buffer.
Take exactly one trade per session, with fixed TP/SL in pips, and optional:
EMA trend filters for longs and shorts.
Range (volatility) filter on the previous window.
Option to skip Thursdays.
The strategy is designed mainly for intraday timeframes (e.g. 15m / 1h), but the logic is timeframe-agnostic.
HMA+RVOL Strategy Hariss 369The Hull Moving Average (HMA) is a smooth, fast, and highly responsive moving average created by Alan Hull. It reduces lag significantly while still maintaining smoothness, making it one of the most popular tools for trend detection and entries. It is widely used for trend filter. Hull Moving Average(HMA) with RVOL strengthens the trend as volume is prime factor of price movement.
Trading with HMA: Simple method is buy when price closes above HMA , stop less below the low of last candle and target is 1.5 or 2 times of stop loss. The reverse is for sell. The HMA automatically turns to green on bull trend and red on bear trend for better visual confirmation.
Adding RVOL to HMA is better method of trading. Buy signal is initiated when price closes above HMA and RVOL is greater than 1.2. Sell signal is initiated when price closes below 89 HMA and rovl is greater than 1.2. One can change the value of RVOL according to trading style and type asset being traded.
It is a back tested strategy.

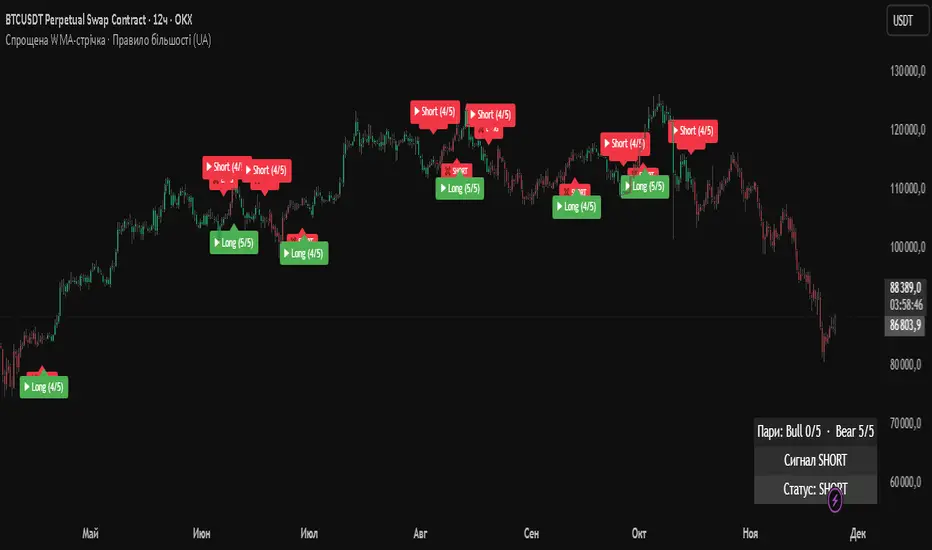
Simplified WMA Ribbon · Majority Rule StrategyThis strategy is a simplified WMA-ribbon “majority rule” system. It compares five fast WMAs (10–30) with five slow WMAs (70–90) and counts how many bullish or bearish pairs are strongly separated by a small ε-buffer. A long (short) position is opened only when a bullish (bearish) majority is reached and closed when that majority weakens or an opposite majority appears. Position size is calculated from a fixed USD amount and leverage, candles are colored by current position, and a mini dashboard shows the number of bullish/bearish pairs and the current status (LONG / SHORT / FLAT).
Inyerneck Sniper Engine v4.2 — FINAL WORKING 2025Aggressive momentum sniper for pennies. Fires on volume + EMA snaps. Use small size. Alerts ready.

Anchor SafeSwing Gold StrategyOverview:
The Anchor SafeSwing Gold Strategy is designed for users who prefer structured, rule-based swing trading on XAUUSD. It focuses on identifying high-quality trade setups rather than frequent entries.
This strategy analyzes the market using multiple technical indicators and methods—including trend analysis, multi-chart confirmation, and support/resistance evaluation—to identify potential swing points. It also incorporates a dynamic approach to risk management through adaptive stop-loss and take-profit logic.
How the Strategy Works
1. Multi-Chart & Trend Analysis:
The strategy evaluates trend direction using several indicators and multiple charts. This helps determine whether the trend favors long or short setups.
2. Buy/Sell Conditions:
a. Buy Conditions: When the broader trend is identified as bullish, the strategy waits for the formation of a strong support zone before considering a long position.
b. Sell Conditions: When the trend is bearish, it waits for a confirmed resistance zone before initiating short positions.
3. Dynamic Take-Profit Logic
The strategy uses adaptive take-profit behavior based on evolving market conditions. It monitors new support/resistance structures and various overbought/oversold signals to dynamically exit trades.
4. Dynamic and Configurable Stop-Loss:
A flexible stop-loss system adjusts according to volatility and market structure.
Users can modify the stop-loss threshold in the settings based on their own risk tolerance and account size.
Trading Frequency :
This strategy focuses on select, high-quality setups. As a result, trade frequency is relatively low and may vary depending on market conditions. Backtesting may show roughly several trades per month, but actual live performance can differ.
Important Notes
All trading involves risk, and users should evaluate the strategy and adjust settings according to their own risk management preferences.

Inyerneck Sniper Engine v4.2 — FINAL WORKING 2025yer momUltra-aggressive momentum sniper built for pennies & BTC.
Fires on every volume explosion + EMA snap. No mercy, no filters.
50+ trades per month. Use small size or die trying.
Private alpha —

Inyerneck Sniper Engine v4.2 — FINAL WORKING 2025Ultra-aggressive momentum sniper built for pennies & BTC.
Fires on every volume explosion + EMA snap. No mercy, no filters.
50+ trades per month. Use small size or die trying.
Private alpha — invite-only. do not change settings without first recording default settings, the default settings are great... usable on any time frame.. aaaaannd... yer mom!

Gold_Strategy_EMA_TradingProEC_v1.4We are pleased to announce a significant update to the execution logic of the Gold Breakouts Strategy, focusing on improved precision and reliability of trade signals.
📝 Summary of Key Changes
This version resolves the critical issue of duplicate or redundant trade entries that were being generated on the same bar when the EMA crossover condition was triggered. This caused unnecessary confusion in signal notifications and trade execution.
⚙️ Detailed Technical Implementation
Elimination of Redundant Code: We have successfully removed the conflicting entry logic block that previously attempted to execute trades using Pivot levels for Take Profit calculation. By doing this, we eliminate the source of the double entry problem.
Consolidated Execution Logic: The strategy now relies on a single, unified execution block. This block exclusively utilizes the robust Fixed TP/SL Ratio calculation as defined in the strategy inputs.
Enhanced Flow Control: We improved the conditional flow by using else if for the sell condition (else if cond_venta) immediately following the buy condition (if cond_compra). This vital change guarantees that if a Buy signal is processed on a given bar, the Sell signal logic is skipped entirely, making the execution flow more exclusive and robust against rapid market movements.
✅ User Impact and Benefits
Single, Clear Notifications: Users will now receive only one definitive entry notification per signal (either 'sell' or 'buy') at a time. This allows for immediate and confident decision-making.
Reliable Trade Execution: The strategy is now significantly more dependable, ensuring that the Stop Loss and Take Profit levels are set correctly and consistently based on the defined risk ratio immediately upon entry.

Safe Supertrend Strategy (No Repaint)Overview
The Safe Supertrend is a repaint-free version of the popular Supertrend trend-following indicator.
Most Supertrend indicators appear perfect on historical charts because they flip intrabar and then repaint after the candle closes.
This version fixes that by using close-of-bar confirmation only, making every trend flip 100% stable, safe, and non-repainting.
Why This Supertrend Doesn’t Repaint
Most Supertrend indicators calculate their trend direction using the current bar’s data.
But during a live candle:
ATR expands and contracts
The upper/lower bands move
Price moves above/below the band temporarily
A false flip appears → then disappears when the candle closes
That is classic repainting.
This indicator avoids all of that by using:
close > upper
close < lower
This means:
Trend direction flips only based on the previous candle,
No intrabar calculations,
No flickering signals,
No “perfect but fake” historical performance.
Every signal you see on the chart is exactly what was available in real-time.
How It Works
Calculates ATR (Average True Range) and SMA centerline
Builds upper and lower volatility bands
Confirms trend flips only after the previous bar closes
Plots clear bull and bear reversal signals
Works on all markets (crypto, stocks, forex, indices)
No repainting, no recalc, no misleading flips.
Bullish Signal (Trend Up)
A bullish trend begins only when:
The previous candle closes above the upper ATR band,
And this flip is fully confirmed.
A green triangle marks the start of a new uptrend.
Bearish Signal (Trend Down)
A bearish trend begins only when:
The previous candle closes below the lower ATR band,
And the downtrend is confirmed.
A red triangle signals the start of a new downtrend.
Inputs
ATR Length - default 10
ATR Multiplier - default 3.0
Works on all timeframes and market
Simple, but powerful.
Why Use This Version Instead of a Regular Supertrend?
Most Supertrends:
Look great historically
But repaint continuously on live charts
Give false trend flips intrabar
Cannot be reliably used in strategies
This version:
Uses strict previous-bar logic
Never repaints trend direction
Works perfectly in live trading
Backtests accurately
Is ideal for algorithmic strategies
Ideal For:
Trend-following strategies
Breakout trading
Algo trading systems
Reversal detection
Filtering market noise
Swing trading & scalping
Final Note
This is a safer, more reliable Supertrend designed for real-world use — not perfect-looking repaint illusions.
If you use Supertrend in your trading system, this no-repaint version ensures your signals are trustworthy and consistent.

XRP CrossChain Momentum EngineThis is a strategy with stop loss 3% , leverage 4 and no pyramiding. It works great with XRP and other coins with similar price, but i suggest XRP. Profit in 1 year around 900% and profit in 2 years around 2000% as you can see in the pictures. I have initial capital 1000 but it can change.

Optimized EMA Ribbon Strategy v6 Based on EMA rotations, ADX we create a system of entering trades. Watch out for the sell and buy signals.

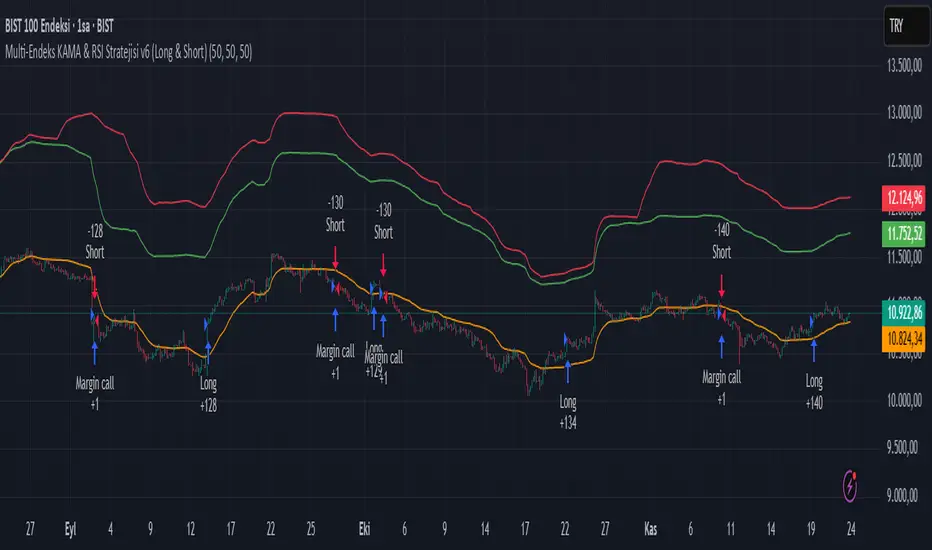
Multi-Endeks KAMA & RSI Stratejisi v6 (Long & Short)Multi-Index KAMA & RSI Strategy v6 (Long & Short)
This is a hybrid trading strategy that combines two powerful technical analysis tools—the Kaufman's Adaptive Moving Average (KAMA) for trend following and the Relative Strength Index (RSI) for measuring momentum and identifying overbought/oversold conditions.
The term "Multi-Index" suggests that the decision-making process might incorporate data or conditions from several different market indices or timeframes, rather than just the single asset being traded.
🧭 Core Components
1. KAMA (Kaufman's Adaptive Moving Average)
KAMA is an adaptive moving average developed by quantitative financial theorist Perry J. Kaufman.
Adaptivity: Unlike standard moving averages, KAMA automatically adjusts its smoothing factor (speed) based on market volatility.
Mechanism:
Trending Markets (Low Noise): When prices move clearly in one direction (low volatility), KAMA speeds up, hugging the price closely and providing fast signals.
Sideways Markets (High Noise): When prices are choppy (high volatility/noise), KAMA slows down, smoothing out price fluctuations to reduce the risk of whipsaws (false signals).
Role in Strategy: To define the main trend direction. The position of the price relative to the KAMA line determines the base directional bias (Long or Short).
2. RSI (Relative Strength Index)
RSI is a momentum oscillator developed by J. Welles Wilder Jr. that measures the speed and change of price movements.
Overbought/Oversold: It oscillates between 0 and 100. Conventionally, a reading above 70 suggests overbought conditions (potential sell signal), and a reading below 30 suggests oversold conditions (potential buy signal).
Role in Strategy: Timing and Confirmation. Once the trend is confirmed by KAMA, the RSI acts as a timing filter, often confirming an entry as it moves away from extreme overbought (for Short) or oversold (for Long) levels.
📉 Potential Trading Logic (V6)
This "v6" strategy likely aims to capture more reliable entries by requiring both trend (KAMA) and momentum (RSI) alignment:
1. LONG (Buy) Entry Conditions
Trend Confirmation (KAMA): The asset's price (Closing Price) must be above the KAMA line (confirming an uptrend).
Momentum Confirmation (RSI):
Option A (Reversal): The RSI must cross above the 30 level (exiting oversold) or decisively move above the 50 level.
Option B (Trend-Continuation): In a strong uptrend, the RSI might bounce off the 40-50 zone and turn upwards, confirming trend continuation.
2. SHORT (Sell) Entry Conditions
Trend Confirmation (KAMA): The asset's price (Closing Price) must be below the KAMA line (confirming a downtrend).
Momentum Confirmation (RSI):
Option A (Reversal): The RSI must cross below the 70 level (exiting overbought) or decisively move below the 50 level.
Option B (Trend-Continuation): In a strong downtrend, the RSI might be rejected from the 50-60 zone and turn downwards, confirming continuation.
3. Exit Management
The strategy likely utilizes dynamic risk controls:
Stop-Loss: A dynamic stop placed on the opposite side of the KAMA, or an ATR-based distance to adjust to volatility.
Take-Profit: Conditions such as the RSI reaching extreme levels or the KAMA line being crossed in the reverse direction.
🌟 Implication of the "V6" Version
The "v6" designation implies that the strategy has been refined and iterated upon over time to address weaknesses in prior versions (v1, v2, etc.). These improvements might include:
Filters: Adding stricter RSI or KAMA cross filters to reduce false signals.
Multi-Index Logic: Using the RSI or KAMA of a secondary instrument (e.g., a major index or volatility measure) as a macro filter for the main trade execution.
Optimization: Optimizing the default lookback periods for KAMA and RSI for different asset classes.
EMA Velocity Dual TF Momentum 1h (v2)BINANCE:SOLUSDT
The result is calculated on futures x10
### EMA Velocity Dual TF Momentum (v2) – Public Description
**Overview**
EMA Velocity Dual TF Momentum (v1) is a trend-following momentum strategy that uses the *speed of change* of Exponential Moving Averages (EMA) on two timeframes: the chart timeframe 1h.
The strategy looks for moments when both timeframes point in the same direction and the short‑term momentum is significantly stronger than usual, then manages trades with configurable ATR filtering, stop‑loss / take‑profit and early exit logic.
---
### Core Idea (high level, without formulas)
- On the **lower timeframe** (LTF), the strategy tracks how fast the EMA is moving (its “velocity”) and detects **impulse bars** where this velocity is unusually strong compared to its recent history.
- On the **higher timeframe** (HTF), it also measures EMA velocity and requires that the HTF trend direction is **aligned** with the LTF (both bullish or both bearish), if enabled.
- A **long trade** is opened when:
- LTF EMA velocity is positive (upward momentum),
- LTF momentum is strong enough (impulse),
- HTF EMA velocity is also upwards (if HTF filter is enabled),
- and ATR‑based volatility is above the minimum threshold.
- A **short trade** is opened in the symmetric situation (downward momentum on both timeframes).
- Positions are closed using configurable stop‑loss and take‑profit, and can be partially exited, moved to break‑even and trailed using early‑exit options.
---
### Inputs and Parameters
#### Trend & Momentum (Lower Timeframe)
- **`LTF EMA length (emaLenLTF)`**
Length of the EMA on the chart timeframe used to measure short‑term trend and momentum. Smaller values react faster; larger values are smoother and slower.
- **`LTF velocity lookback (velKLTF)`**
Lookback for computing EMA “velocity” on LTF. Controls how sensitive the momentum calculation is to recent price changes.
- **`LTF impulse lookback bars (impLookback)`**
Window size used to estimate the “normal” average absolute velocity. The strategy compares current momentum against this baseline to detect strong impulse moves.
- **`LTF |velocity| multiplier vs average (impMult)`**
Multiplier for defining what counts as a strong impulse. Higher values = fewer but stronger signals; lower values = more frequent, weaker impulses.
#### Trend & Momentum (Higher Timeframe)
- **`Use higher timeframe alignment (useHTF)`**
If enabled, trades are only taken when the higher‑timeframe EMA velocity confirms the same direction as the lower timeframe.
- **`HTF timeframe (htf_tf)`**
Higher timeframe used for confirmation (e.g. 60 minutes). Defines the “macro” context above the chart timeframe.
- **`HTF EMA length (emaLenHTF)`**
Length of the EMA on the higher timeframe. Controls how smooth and slow the higher‑timeframe trend filter is.
- **`HTF velocity lookback (velKHTF)`**
Lookback for the EMA velocity on HTF. Smaller values react quicker to changes in the higher‑timeframe trend.
#### Volatility / ATR Filter
- **`Use ATR filter (useAtrFilter)`**
Enables a volatility filter based on Average True Range. When active, trades are allowed only if market volatility is not too low.
- **`ATR Period (atrPeriod)`**
Lookback period for ATR calculation. Shorter periods react faster to recent volatility shifts; longer ones are more stable.
- **`ATR Min % for trading (atrMinPerc)`**
Minimum ATR as a percentage of price required to trade. Filters out very quiet, choppy periods where the strategy is more likely to be whipsawed.
#### Risk Management
- **`Use stops (SL/TP) (useStops)`**
Enables fixed stop‑loss and take‑profit exits. If disabled, positions are managed only by early exit logic and manual closing.
- **`Stop Loss % (stopLossPerc)`**
Distance of the protective stop from entry, in percent. Higher values give trades more room but increase risk per trade.
- **`Take Profit % (takeProfitPerc)`**
Distance of the primary profit target from entry, in percent. Controls the reward‑to‑risk profile of each trade.
#### Early Exit / Break‑Even / Trailing
- **`Enable early exit module (useEarlyExit)`**
Master switch for all early exit features: partial profit taking, break‑even stops and trailing exits.
- **`Take partial profit at +% (close 50%) (partialTP)`**
Profit level (in %) at which the strategy closes a partial portion of the position (e.g. 50%), locking in gains while leaving a runner.
- **`Trailing TP distance (%) (trailTP)`**
Distance (in %) for dynamic trailing stop after entry. When positive, the strategy trails the price to protect profits as the move extends.
- **`Break-even stop after +% profit (useBreakEven)`**
Enables automatic move of the stop to the entry price once a certain profit threshold is reached.
- **`Break-even activation (+%) (breakEvenPerc)`**
Profit level (in %) at which the stop is moved to break‑even. Higher values require a larger unrealized profit before break‑even protection kicks in.
#### Visuals
- **`Show labels (showLabels)`**
Toggles on‑chart labels that mark long and short entry signals for easier visual analysis.
- **`Label offset (labelOffset)`**
Horizontal offset (in bars) for placing labels relative to the signal bar. Used only for visual clarity; does not affect trading logic.
---
Если нужно, могу на основе этого текста сразу подготовить компактную версию (ограниченную по символам) специально под поле описания публичного скрипта в TradingView.

EMA Velocity Volatility Clamp (v1)A strategy based on the rate of price change using EMA.
Configured for the 5M Solana.
BINANCE:SOLUSDT

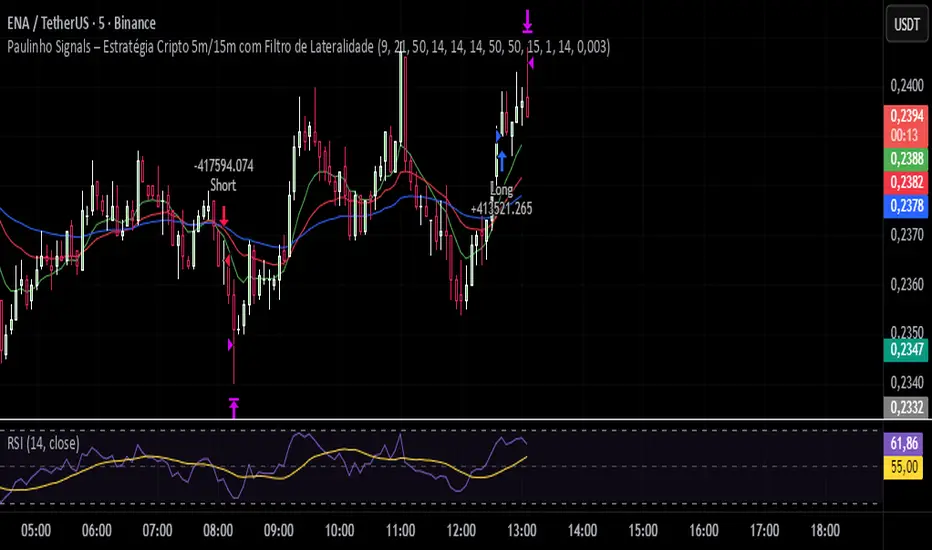
Paulinho Signals – Cripto 5m/15m com Filtro de LateralidadeThis script is an automated Pine Script v6 strategy designed for short-term cryptocurrency trading, especially on 5-minute and 15-minute timeframes. It combines moving average crossovers, trend strength (ADX), volatility (ATR), and candlestick patterns to generate buy and sell signals with a fixed risk/reward management system.
How to Use:
- Apply to cryptocurrency charts on 5m or 15m timeframes.
- Adjust parameters to fit your preferences (EMA, RSI, ADX, ATR).
- Use for backtesting or as a decision-support tool.
Disclaimer:
This script is for educational purposes only and does not constitute financial advice. Always test on demo accounts before applying to live trading.