Adaptive Trend Flow [QuantAlgo]Adaptive Trend Flow 📈🌊
The Adaptive Trend Flow by QuantAlgo is a sophisticated technical indicator that harnesses the power of volatility-adjusted EMAs to navigate market trends with precision. By seamlessly integrating a dynamic dual-EMA system with adaptive volatility bands, this premium tool enables traders and investors to identify and capitalize on sustained market moves while effectively filtering out noise. The indicator's unique approach to trend detection combines classical technical analysis with modern adaptive techniques, providing traders and investors with clear, actionable signals across various market conditions and asset class.
💫 Indicator Architecture
The Adaptive Trend Flow provides a sophisticated framework for assessing market trends through a harmonious blend of EMA dynamics and volatility-based boundary calculations. Unlike traditional moving average systems that use fixed parameters, this indicator incorporates smart volatility measurements to automatically adjust its sensitivity to market conditions. The core algorithm employs a dual EMA system combined with standard deviation-based volatility bands, creating a self-adjusting mechanism that expands and contracts based on market volatility. This adaptive approach allows the indicator to maintain its effectiveness across different market phases - from ranging to trending conditions. The volatility-adjusted bands act as dynamic support and resistance levels, while the gradient visualization system provides instant visual feedback on trend strength and duration.
📊 Technical Composition and Calculation
The Adaptive Trend Flow is composed of several technical components that create a dynamic trending system:
Dual EMA System: Utilizes fast and slow EMAs for primary trend detection
Volatility Integration: Computes and smooths volatility for adaptive band calculation
Dynamic Band Generation: Creates volatility-adjusted boundaries for trend validation
Gradient Visualization: Provides progressive visual feedback on trend strength
📈 Key Indicators and Features
The Adaptive Trend Flow utilizes customizable length parameters for both EMAs and volatility calculations to adapt to different trading styles. The trend detection component evaluates price action relative to the dynamic bands to validate signals and identify potential reversals.
The indicator incorporates multi-layered visualization with:
Color-coded basis and trend lines (bullish/bearish)
Adaptive volatility-based bands
Progressive gradient background for trend duration
Clear trend reversal signals (𝑳/𝑺)
Smooth fills between key levels
Programmable alerts for trend changes
⚡️ Practical Applications and Examples
✅ Add the Indicator: Add the indicator to your TradingView chart by clicking on the star icon to add it to your favorites ⭐️
👀 Monitor Trends: Watch the basis line and trend band interactions to identify trend direction and strength. The gradient background intensity indicates trend duration and conviction.
🎯 Track Signals: Pay attention to the trend reversal markers that appear on the chart:
→ Long signals (𝑳) appear when price action confirms a bullish trend reversal
→ Short signals (𝑺) indicate validated bearish trend reversals
🔔 Set Alerts: Configure alerts for trend changes in both bullish and bearish directions, ensuring you never miss significant technical developments.
🌟 Summary and Tips
The Adaptive Trend Flow by QuantAlgo is a sophisticated technical tool designed to support trend-following strategies across different market environments and asset class. By combining dual EMA analysis with volatility-adjusted bands, it helps traders and investors identify significant trend changes while filtering out market noise, providing validated signals. The tool's adaptability through customizable EMA lengths, volatility smoothing, and sensitivity settings makes it suitable for various trading timeframes and styles, allowing users to capture trending opportunities while maintaining protection against false signals.
Key parameters to optimize for your trading and/or investing style:
Main Length: Adjust for more or less sensitivity to trend changes (default: 10)
Smoothing Length: Fine-tune volatility calculations for signal stability (default: 14)
Sensitivity: Balance band width for trend validation (default: 2.0)
Visual Settings: Customize appearance with color and display options
The Adaptive Trend Flow is particularly effective for:
Identifying sustained market trends
Detecting trend reversals with confirmation
Measuring trend strength and duration
Filtering out market noise and false signals
Remember to:
Allow the indicator to validate trend changes before taking action
Use the gradient background to gauge trend strength
Combine with volume analysis for additional confirmation
Consider multiple timeframes for a complete market view
Adjust sensitivity based on market volatility conditions
Meanreversion

Support and Resistance Non-Repainting [AlgoAlpha]Elevate your technical analysis with the Non-Repainting Support and Resistance indicator from AlgoAlpha. Designed for traders who value precision, this tool highlights key support and resistance zones without repainting, ensuring reliable signals for better market decisions.
Key Features
🔍 Concise Zones: Identifies critical levels in real-time without repainting.
🖍 Customizable Appearance: Choose your preferred colors for bullish and bearish zones.
📏 Pivot Sensitivity Settings: Adjust the lookback period to fit different market conditions.
🔔 Visual Alerts: Highlights zones on your chart with clear, dynamic boxes and lines.
How to Use
Add the Indicator : Add it to your favorites chart by clicking the star icon. Adjust the lookback period, max zone duration, and colors to match your strategy.
Analyze the Chart : Look for zones where prices frequently react, indicating strong support or resistance.
Set Alerts : Enable notifications for new zone formations and zone invalidations, ensuring you never miss critical market moves.
How It Works
The indicator detects pivot highs and lows using a specified lookback period. When a pivot is confirmed, it draws corresponding support or resistance zones using TradingView’s built-in drawing tools. These zones extend until price breaks through them or they expire based on a maximum allowed duration. The indicator continuously checks if price interacts with any active zones and adjusts accordingly, ensuring accurate and real-time visualization.

LRI Momentum Cycles [AlgoAlpha]Discover the LRI Momentum Cycles indicator by AlgoAlpha, a cutting-edge tool designed to identify market momentum shifts using trend normalization and linear regression analysis. This advanced indicator helps traders detect bullish and bearish cycles with enhanced accuracy, making it ideal for swing traders and intraday enthusiasts alike.
Key Features :
🎨 Customizable Appearance : Set personalized colors for bullish and bearish trends to match your charting style.
🔧 Dynamic Trend Analysis : Tracks market momentum using a unique trend normalization algorithm.
📊 Linear Regression Insight : Calculates real-time trend direction using linear regression for better precision.
🔔 Alert Notifications : Receive alerts when the market switches from bearish to bullish or vice versa.
How to Use :
🛠 Add the Indicator : Favorite and apply the indicator to your TradingView chart. Adjust the lookback period, linear regression source, and regression length to fit your strategy.
📊 Market Analysis : Watch for color changes on the trend line. Green signals bullish momentum, while red indicates bearish cycles. Use these shifts to time entries and exits.
🔔 Set Alerts : Enable notifications for momentum shifts, ensuring you never miss critical market moves.
How It Works :
The LRI Momentum Cycles indicator calculates trend direction by applying linear regression on a user-defined price source over a specified period. It compares historical trend values, detecting bullish or bearish momentum through a dynamic scoring system. This score is normalized to ensure consistent readings, regardless of market conditions. The indicator visually represents trends using gradient-colored plots and fills to highlight changes in momentum. Alerts trigger when the momentum state changes, providing actionable trading signals.

EMA Volatility Channel [QuantAlgo]EMA Volatility Channel 🌊📈
The EMA Volatility Channel by QuantAlgo is an advanced technical indicator designed to capture price volatility and trend dynamics through adaptive channels based on exponential moving averages. This sophisticated system combines EMA-based trend analysis with dynamic volatility-adjusted bands to help traders and investors identify trend direction, potential reversals, and market volatility conditions. By evaluating both price momentum and volatility together, this tool enables users to make informed trading decisions while adapting to changing market conditions.
💫 Dynamic Channel Architecture
The EMA Volatility Channel provides a unique framework for assessing market trends through a blend of exponential moving averages and volatility-based channel calculations. Unlike traditional channel indicators that use fixed-width bands, this system incorporates dynamic volatility measurements to adjust channel width automatically, helping users determine whether price movements are significant relative to current market conditions. By combining smooth EMA trends with adaptive volatility bands, it evaluates both directional movement and market volatility, while the smoothing parameters ensure stable yet responsive channel adjustments. This adaptive approach allows users to identify trending conditions while remaining aware of volatility expansions and contractions, enhancing both trend-following and reversal strategies.
📊 Indicator Components & Mechanics
The EMA Volatility Channel is composed of several technical components that create a dynamic channel system:
EMA Midline: Calculates a smoothed exponential moving average that serves as the channel's centerline, providing a clear reference for trend direction.
Volatility Measurement: Computes average price movement to determine dynamic channel width, adapting to changing market conditions automatically.
Smooth Band Calculation: Applies additional smoothing to the channel bands, reducing noise while maintaining responsiveness to significant price movements.
📈 Key Indicators and Features
The EMA Volatility Channel combines various technical tools to deliver a comprehensive analysis of market conditions.
The indicator utilizes exponential moving averages with customizable length and smoothing parameters to adapt to different trading styles. Volatility calculations are applied to determine channel width, providing context-aware boundaries for price movement. The trend detection component evaluates price action relative to the channel bands, helping validate trends and identify potential reversals.
The indicator incorporates multi-layered visualization with color-coded channels and bars to signal both trend direction and market position. These adaptive visual cues, combined with programmable alerts for channel breakouts, help traders and investors track both trend changes and volatility conditions, supporting both trend-following and mean-reversion strategies.
⚡️ Practical Applications and Examples
✅ Add the Indicator: Add the indicator to your TradingView chart by clicking on the star icon to add it to your favorites ⭐️
👀 Monitor Channel Position: Watch the price position relative to the channel bands to identify trend direction and potential reversals. When price moves outside the channel, consider potential trend changes or extreme conditions.
🔔 Set Alerts: Configure alerts for channel breakouts and trend changes, ensuring you can act on significant technical developments promptly.
🌟 Summary and Tips
The EMA Volatility Channel by QuantAlgo is a versatile technical tool, designed to support both trend following and volatility analysis across different market environments. By combining smooth EMA trends with dynamic volatility-based channels, it helps traders and investors identify significant price movements while measuring market volatility, providing reliable technical signals. The tool's adaptability across timeframes makes it suitable for both trend-following and reversal strategies, allowing users to capture opportunities while maintaining awareness of changing market conditions.

Double Top/Bottom [AlgoAlpha]Introducing the Double Top/Bottom Indicator by AlgoAlpha, a powerful tool designed to identify key reversal patterns in the market with precision. This indicator meticulously detects double tops and double bottoms, helping traders recognize potential trend reversals and make informed trading decisions.
Key Features:
🔍 Pattern Detection : Accurately identifies double top and double bottom formations based on customizable time horizons.
🎨 Customizable Appearance : Choose your preferred colors for bullish and bearish trends to match your trading style.
📊 Signal Labels : Option to display only the second pivot of the double top/bottom for a cleaner chart view.
🔧 Flexible Settings : Adjust the time horizon to control the look-back period, allowing for detection of both short-term and long-term patterns.
📈 Visual Enhancements : Draws trend lines and fills between pivotal points to visually highlight potential reversal zones.
🔔 Alerts : Set up alerts for potential double top and double bottom formations to stay informed of key market movements.
How to Use the Double Top/Bottom Indicator :
🛠 Add the Indicator : Simply add the Double Top/Bottom Indicator to your TradingView chart from your favorites. Customize the time horizon and appearance settings to fit your trading preferences.
📊 Analyze Patterns : Watch for the identified double top and double bottom patterns along with the corresponding trend lines and filled areas to anticipate potential market reversals.
🔔 Set Alerts : Enable alerts to receive notifications when double top or double bottom patterns are detected, ensuring you never miss a critical trading opportunity.
How It Works : The indicator scans the price action for pivot highs and lows within a specified time horizon, identifying potential double top and double bottom patterns. It maintains a sequence of these pivots and verifies the formation of these patterns based on the relationship between consecutive pivots and the proximity to a defined limit. When a double top or double bottom is confirmed, the indicator marks the second pivot point with a label and draws trend lines to visualize the reversal pattern. Additionally, it provides alert conditions to notify traders of potential confirmations, enhancing decision-making without cluttering the chart.
⚠️ Important Reminder : The labels indicating double tops and bottoms appear with a delay and are intended to mark the formations after they have already formed. They are not meant to be used as real-time trading signals. While they align perfectly with pivot points in hindsight, please use them as markers for analysis rather than immediate trading triggers.

Weighted Average Strength Index (WASI)Weighted Average Strength Index (WASI)
The Weighted Average Strength Index (WASI) is a variation of the standard RSI. It uses the Weighted Moving Average (WMA) instead of the Running Moving Average (RMA), making it more responsive to recent price changes. The hypothesis is that this weighted calculation might better capture momentum shifts, providing traders with more timely insights.
How to Use:
Backtest WASI on your preferred assets and timeframes to evaluate its effectiveness for your strategy.
Use for trend following or mean reversion :
- Overbought/Oversold (OB/OS) levels can signal potential mean-reversion opportunities.
- Midline (50 level) crossovers can be used for trend-following strategies.
- WASI and its moving average (MA) crossovers offer additional trend-following or reversal signals.
Parameters and Their Functions:
WASI Length: Determines the number of periods for WASI calculation. A longer length smooths the indicator but increases lag, while a shorter length makes it more sensitive. (When in doubt, go longer).
Source: The price source for the calculation (e.g., close, open, high, or low).
MA Type: Specifies the type of moving average applied to the WASI (options include SMA, EMA, WMA, HMA, and others).
MA Length: The number of periods for the moving average used on the WASI. Higher will lead to a smoother moving average.
Indicator Features:
Dynamic OB/OS Levels: Default overbought (70) and oversold (30) levels help identify potential reversal zones.
Midline Crossover: WASI crossing above or below the 50 level may indicate a trend shift.
WASI-MA Crossover: Crossovers between WASI and its moving average can signal trend-following or mean-reversion opportunities.
Disclaimer:
This indicator is a tool for analysis and should be used in conjunction with other forms of analysis or confirmation. Past performance does not guarantee future results.

Reversal Signals [AlgoAlpha]📈🔄 Reversal Signals – Master Market Reversals with Precision! 🚀✨
Elevate your trading strategy with the Reversal Signals indicator by AlgoAlpha. This advanced tool is designed to pinpoint potential bullish and bearish reversals by analyzing price action and, optionally, volume confirmations. It seamlessly combines reversal detection with trend analysis, giving you a comprehensive view of market dynamics to make informed trading decisions.
Key Features
🔎 Price Action Reversal Detection : Identifies potential reversal points by comparing current price movements against historical candle patterns within a customizable lookback period.
📊 Volume Confirmation : Optionally integrates volume analysis to confirm the strength of reversal signals, enhancing their reliability.
📈 Stepped Moving Average Trend Indicator : Employs a stepped moving average that adjusts at set intervals to reflect underlying market trends.
⚙️ Customizable Settings : Tailor the indicator to your trading style with adjustable parameters for lookback periods, confirmation windows, moving average types, and more.
🎨 Visual Signals and Trend Coloring : Clear on-chart labels for reversal signals and color-coded trend areas to quickly identify bullish and bearish conditions.
🔔 Alerts for Key Market Events : Set up custom alerts for reversal signals and trend shifts to stay ahead of market movements.
Quick Guide to Using the Reversal Signals Indicator :
🛠 Add the Indicator : Add the indicator to your favorites by pressing the star icon. Customize settings like Candle Lookback, Confirm Within, and Use Volume Confirmation to fit your trading style.
📊 Market Analysis : Observe the "𝓡" labels on the chart indicating bullish and bearish reversal signals. Look for labels below the bars for bullish signals and above the bars for bearish signals. Use the color-filled areas between the stepped moving average and the center line to assess market trends.
🔔 Alerts : Enable notifications for reversal signals and trend shifts to stay informed about market movements without constantly monitoring the chart.
How It Works
The Reversal Signals indicator operates by conducting a thorough analysis of price action over a user-defined lookback period. For a bullish reversal, the indicator checks if the current closing price is lower than the lows of the preceding candles within the lookback window, suggesting a potential oversold condition. If this criterion is met, it marks the candle as a potential reversal point and waits for confirmation within a specified number of subsequent candles. Confirmation occurs when the price rises above the high of the identified candle, signaling a bullish reversal. An optional volume confirmation can be enabled to ensure that the reversal is supported by higher-than-average trading volume, adding an extra layer of validation to the signal. The process is mirrored for bearish reversals, where the indicator looks for the closing price exceeding previous highs and awaits confirmation of a downward move.
Complementing the reversal signals, the indicator features a stepped moving average that serves as a dynamic trend indicator. This moving average updates at intervals defined by the MA Step Period and shifts direction based on price crossings. If the price remains above the stepped MA, it indicates a bullish trend, coloring the area between the MA and the center line in green. Conversely, if the price falls below the stepped MA, a bearish trend is signaled, and the area is shaded red. This visual representation helps traders quickly assess the prevailing market trend and align their trading decisions accordingly.
Experience a new level of market insight with the Reversal Signals indicator. Add it to your TradingView chart today and enhance your ability to detect and act on key ma

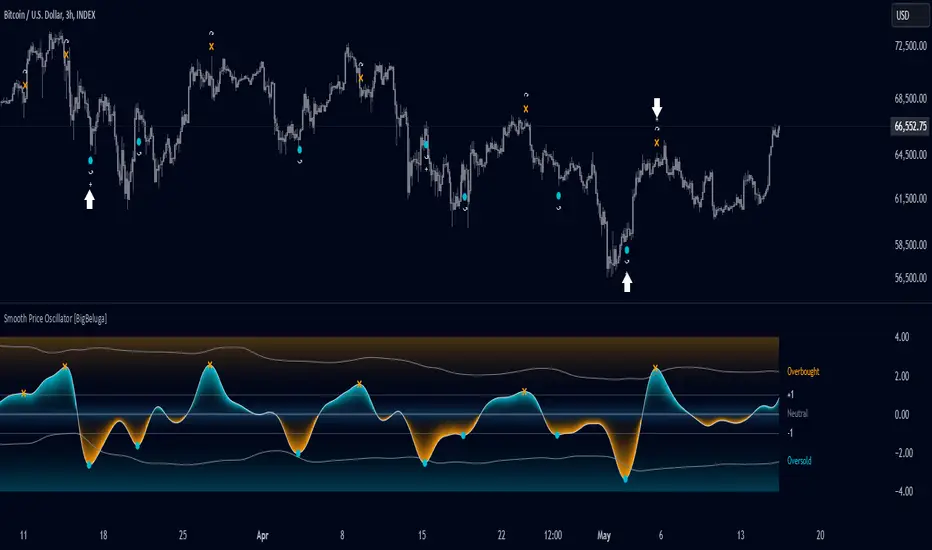
Smooth Price Oscillator [BigBeluga]The Smooth Price Oscillator by BigBeluga leverages John Ehlers' SuperSmoother filter to produce a clear and smooth oscillator for identifying market trends and mean reversion points. By filtering price data over two distinct periods, this indicator effectively removes noise, allowing traders to focus on significant signals without the clutter of market fluctuations.
🔵 KEY FEATURES & USAGE
● SuperSmoother-Based Oscillator:
This oscillator uses Ehlers' SuperSmoother filter, applied to two different periods, to create a smooth output that highlights price momentum and reduces market noise. The dual-period application enables a comparison of long-term and short-term price movements, making it suitable for both trend-following and reversion strategies.
// @function SuperSmoother filter based on Ehlers Filter
// @param price (float) The price series to be smoothed
// @param period (int) The smoothing period
// @returns Smoothed price
method smoother_F(float price, int period) =>
float step = 2.0 * math.pi / period
float a1 = math.exp(-math.sqrt(2) * math.pi / period)
float b1 = 2 * a1 * math.cos(math.sqrt(2) * step / period)
float c2 = b1
float c3 = -a1 * a1
float c1 = 1 - c2 - c3
float smoothed = 0.0
smoothed := bar_index >= 4
? c1 * (price + price ) / 2 + c2 * smoothed + c3 * smoothed
: price
smoothed
● Mean Reversion Signals:
The indicator identifies two types of mean reversion signals:
Simple Mean Reversion Signals: Triggered when the oscillator moves between thresholds of 1 and Overbought or between thresholds -1 and Ovesold, providing additional reversion opportunities. These signals are useful for capturing shorter-term corrections in trending markets.
Strong Mean Reversion Signals: Triggered when the oscillator above the overbought (upper band) or below oversold (lower band) thresholds, indicating a strong reversal point. These signals are marked with a "+" symbol on the chart for clear visibility.
Both types of signals are plotted on the oscillator and the main chart, helping traders to quickly identify potential trade entries or exits.
● Dynamic Bands and Thresholds:
The oscillator includes overbought and oversold bands based on a dynamically calculated standard deviation and EMA. These bands provide visual boundaries for identifying extreme price conditions, helping traders anticipate potential reversals at these levels.
● Real-Time Labels:
Labels are displayed at key thresholds and bands to indicate the oscillator’s status: "Overbought," "Oversold," and "Neutral". Mean reversion signals are also displayed on the main chart, providing an at-a-glance summary of current indicator conditions.
● Customizable Threshold Levels:
Traders can adjust the primary threshold and smoothing length according to their trading style. A higher threshold can reduce signal frequency, while a lower setting will provide more sensitivity to market reversals.
The Smooth Price Oscillator by BigBeluga is a refined, noise-filtered indicator designed to highlight mean reversion points with enhanced clarity. By providing both strong and simple reversion signals, as well as dynamic overbought/oversold bands, this tool allows traders to spot potential reversals and trend continuations with ease. Its dual representation on the oscillator and the main price chart offers flexibility and precision for any trading strategy focused on capturing cyclical market movements.
Power Root SuperTrend [AlgoAlpha]📈🚀 Power Root SuperTrend by AlgoAlpha - Elevate Your Trading Strategy! 🌟
Introducing the Power Root SuperTrend by AlgoAlpha, an advanced trading indicator that enhances the traditional SuperTrend by incorporating Root-Mean-Square (RMS) calculations for a more responsive and adaptive trend detection. This innovative tool is designed to help traders identify trend directions, potential take-profit levels, and optimize entry and exit points with greater accuracy, making it an excellent addition to your trading arsenal.
Key Features:
🔹 Root-Mean-Square SuperTrend Calculation : Utilizes the RMS of closing prices to create a smoother and more sensitive SuperTrend line that adapts quickly to market changes.
🔸 Multiple Take-Profit Levels : Automatically calculates and plots up to seven take-profit levels (TP1 to TP7) based on market volatility and the change in SuperTrend values.
🟢 Dynamic Trend Coloring : Visually distinguish between bullish and bearish trends with customizable colors for clearer market visualization.
📊 RSI-Based Take-Profit Signals : Incorporates the Relative Strength Index (RSI) of the distance between the price and the SuperTrend line to generate additional take-profit signals.
🔔 Customizable Alerts : Set alerts for trend direction changes, achievement of take-profit levels, and RSI-based take-profit conditions to stay informed without constant chart monitoring.
How to Use:
Add the Indicator : Add the indicator to favorites by pressing the ⭐ icon or search for "Power Root SuperTrend " in the TradingView indicators library and add it to your chart. Adjust parameters such as the ATR multiplier, ATR length, RMS length, and RSI take-profit length to suit your trading style and the specific asset you are analyzing.
Analyze the Chart : Observe the SuperTrend line and the plotted take-profit levels. The color changes indicate trend directions—green for bullish and red for bearish trends.
Set Alerts : Utilize the built-in alert conditions to receive notifications when the trend direction changes, when each TP level is drawn, or when RSI-based take-profit conditions are met.
How It Works:
The Power Root SuperTrend indicator enhances traditional SuperTrend calculations by applying a Root-Mean-Square (RMS) function to the closing prices, resulting in a more responsive trend line that better reflects recent price movements. It calculates the Average True Range (ATR) to determine the volatility and sets the upper and lower SuperTrend bands accordingly. When a trend direction change is detected—signified by the SuperTrend line switching from above to below the price or vice versa—the indicator calculates the change in the SuperTrend value. This change is then used to establish multiple take-profit levels (TP1 to TP7), each representing incremental targets based on market volatility. Additionally, the indicator computes the RSI of the distance between the current price and the SuperTrend line to generate extra take-profit signals when the RSI crosses under a specific threshold. The combination of RMS calculations, multiple TP levels, dynamic coloring, and RSI signals provides traders with a comprehensive tool for identifying trends and optimizing trade exits. Customizable alerts ensure that traders can stay updated on important market developments without needing to constantly watch the charts.
Elevate your trading strategy with the Power Root SuperTrend indicator and gain a smarter edge in the markets! 🚀✨

Volume-Adjusted Schaff Trend Cycle (VASTC)Volume-Adjusted Schaff Trend Cycle (VASTC)
The VASTC is a fairly fast-moving oscillator designed to identify trends early and signal when trends may be nearing their end. While it can be used for both trend-following and mean-reversion strategies , it shines in trend-following setups. It’s particularly useful for catching the start of a trend and giving early warnings that a trend might end soon, making it a valuable addition to a multi-indicator system.
How It Works:
The VASTC adapts the traditional Schaff Trend Cycle by adjusting the MACD component with volume data. This volume-adjusted MACD is run through two stochastic processes , applying exponential smoothing to enhance responsiveness. Volume sensitivity allows the VASTC to adapt dynamically to periods of high or low trading activity, providing more reliable trend signals.
Recommended Use:
Use VASTC in confluence with other indicators to confirm trend entries and exits. It’s best for identifying early trend setups rather than sustaining prolonged trend trades. When used alongside other indicators, especially those with a longer-term outlook or momentum based trend indicators, you’ll gain a clearer signal for potential exits or entries. Always backtest the VASTC on your chosen assets to determine the most effective input parameters, as the defaults may not suit all markets or assets. Different assets behave differently, and adjustments in parameters can improve its ability to analyze the assets you're looking at.
Parameters:
Length : Sets the primary smoothing length.
Fast/Slow Length : Adjust the speed of the volume-adjusted MACD component.
Factor : Controls the final smoothing applied to the STC.
Overbought/Oversold Levels : Defines overbought/oversold levels.
Experiment with these settings to customize the VASTC to your trading strategy and asset.
Disclaimer : This indicator is a tool to complement your trading analysis and should not be used in isolation. Always backtest and use other confluence signals for best results. The assets I looked at when making this indicator are almost certainly different than what you're looking at.

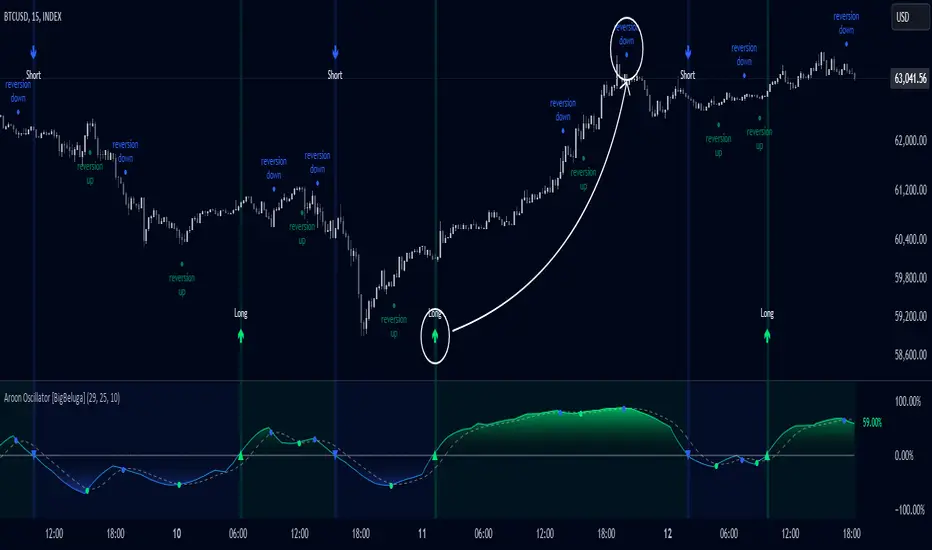
Aroon Oscillator [BigBeluga]Aroon Oscillator with Mean Reversion & Trend Signals is a versatile tool that helps traders identify both trend direction and potential mean reversion points. The core Aroon Oscillator tracks the strength of a trend by measuring how long it has been since a high or low price occurred within a specified period. This oscillator provides trend-following signals (LONG/SHORT) along with mean reversion signals, giving traders both the ability to ride trends and anticipate reversals.
The unique feature of this indicator is the Mean Reversion Signals, marked with dots on the main chart, indicating potential points where the trend might reverse or retrace. In addition, trend-following signals (LONG and SHORT) are plotted directly on the chart, providing clear entry and exit points when a trend is beginning or ending.
🔵 IDEA
The Aroon Oscillator with Mean Reversion indicator provides a combined approach of trend analysis and mean reversion. The core idea is to track the health and momentum of trends, while also identifying when those trends might reverse or slow down. This dual approach allows traders to both follow the prevailing market direction and also capture mean reversion opportunities.
The oscillator is smoothed with John Ehlers' Zero Lag function , which helps reduce noise and improves signal clarity by removing lag without sacrificing the indicator's responsiveness.
The indicator uses color-coded signals and an easy-to-read oscillator to visually represent different types of signals on the chart. This makes it easy for traders to spot important changes in market trends and take action based on both the trend-following and mean reversion aspects of the indicator.
🔵 KEY FEATURES & USAGE
Trend Following Signals (LONG/SHORT):
In addition to mean reversion signals, the indicator also provides clear trend-following signals. LONG signals (green arrows) are plotted when the oscillator crosses above zero, indicating a potential uptrend. Conversely, SHORT signals (blue arrows) are plotted when the oscillator crosses below zero, signaling a potential downtrend.
Mean Reversion Signals:
This indicator features unique mean reversion signals, represented by dots on the main chart. These signals occur when the oscillator crosses over or under a smoother signal line, indicating that the current trend might be losing strength and a reversal or retracement is possible. Green dots represent a possible upward reversion, while blue dots signal a potential downward reversion.
Color-Coded Signals and Oscillator:
The Aroon Oscillator is color-coded to make it visually easier for traders to differentiate between trends and mean reversion signals. When the oscillator is above zero, the area is filled with green, and when it is below zero, the area is filled with blue. This visual representation helps traders quickly identify the current market condition at a glance.
🔵 CUSTOMIZATION
Aroon Length & Smoothing: Control the sensitivity of the Aroon Oscillator by adjusting the lookback period and smoothing settings, allowing traders to fine-tune the indicator to match different market conditions.
Mean Reversion Signals: Enable or disable mean reversion signals based on your trading preferences. Adjust the signal line length to control when these reversal signals are triggered.
Color Customization: Customize the colors for the oscillator and signals to match your chart’s color scheme for better visual clarity.
ATR Adjusted RSIATR Adjusted RSI Indicator
By Nathan Farmer
The ATR Adjusted RSI Indicator is a versatile indicator designed primarily for trend-following strategies, while also offering configurations for overbought/oversold (OB/OS) signals, making it suitable for mean-reversion setups. This tool combines the classic Relative Strength Index (RSI) with a unique Average True Range (ATR)-based smoothing mechanism, allowing traders to adjust their RSI signals according to market volatility for more reliable entries and exits.
Key Features:
ATR Weighted RSI:
At the core of this indicator is the ATR-adjusted RSI line, where the RSI is smoothed based on volatility (measured by the ATR). When volatility increases, the smoothing effect intensifies, resulting in a more stable and reliable RSI reading. This makes the indicator more responsive to market conditions, which is especially useful in trend-following systems.
Multiple Signal Types:
This indicator offers a variety of signal-generation methods, adaptable to different market environments and trading preferences:
RSI MA Crossovers: Generates signals when the RSI crosses above or below its moving average, with the flexibility to choose between different moving average types (SMA, EMA, WMA, etc.).
Midline Crossovers: Provides trend confirmation when either the RSI or its moving average crosses the 50 midline, signaling potential trend reversals.
ATR-Inversely Weighted RSI Variations: Uses the smoothed, ATR-adjusted RSI for a more refined and responsive trend-following signal. There are variations both for the MA crossover and the midline crossover.
Overbought/Oversold Conditions: Ideal for mean reversion setups, where signals are triggered when the RSI or its moving average crosses over overbought or oversold levels.
Flexible Customization:
With a wide range of customizable options, you can tailor the indicator to fit your personal trading style. Choose from various moving average types for the RSI, modify the ATR smoothing length, and adjust overbought/oversold levels to optimize your signals.
Usage:
While this indicator is primarily designed for trend-following, its OB/OS configurations make it highly effective for mean-reverting setups as well. Depending on your selected signal type, the relevant indicator line will change color between green and red to visually signal long or short opportunities. This flexibility allows traders to switch between trending and sideways market strategies seamlessly.
A Versatile Tool:
The ATR Adjusted RSI Indicator is a valuable component of any trading system, offering enhanced signals that adapt to market volatility. However, it is not recommended to rely on this indicator alone, especially without thorough backtesting. Its performance varies across different assets and timeframes, so it’s essential to experiment with the parameters to ensure consistent results before applying it in live trading.
Recommendation:
Before incorporating this indicator into live trading, backtest it extensively. Given its flexibility and wide range of signal-generation methods, backtesting allows you to optimize the settings for your preferred assets and timeframes. Only consider using it on it's own if you are confident in its performance based on your own backtest results, and even then, it is not recommended.

Session Range Breakouts With Targets [AlgoAlpha]⛓️💥Session Range Breakouts With Targets 🚀
Introducing the "Session Range Breakouts With Targets" indicator by AlgoAlpha, a powerful tool for traders to capitalize on session-based range breakouts and identify precise target zones using ATR-based calculations! Whether you trade the Asian, American, European, or Oceanic sessions, this script highlights key breakout levels and targets that adapt to market volatility, ensuring you're always prepared for those crucial price movements. 🕒📊
Session-based Trading : The indicator highlights session-specific ranges, offering clear breakouts for Asian, American, European, Oceanic, and even custom sessions 🌍.
Adaptive Volatility Zones : Uses ATR to determine dynamic zone widths, filtering out fakeouts and adjusting to market conditions ⚡.
Precise Take-Profit Targets : Set multiple levels of take-profits based on ATR multipliers, ensuring you can manage both aggressive and conservative trades 🎯.
Customizable Appearance : Tailor the look with customizable colors for session highlights and breakout zones to fit your chart style 🎨.
Alerts on Key Events : Built-in alert conditions for breakouts and take-profit hits, so you never miss a trading opportunity 🔔.
🚀 Quick Guide to Using the Indicator
🛠 Add the Indicator : Add the indicator to favorites by pressing the star icon. Choose your session (Asia, America, Europe, Oceana, or Custom) and adjust the ATR length, zone width multiplier, and target multipliers to suit your strategy.
📊 Analyze Breakouts : Watch for the indicator to plot upper and lower range boxes based on session highs and lows. Price breaking through these boxes will signal a potential entry.
📈 Monitor Targets : Track bullish and bearish targets as price moves, with up to three take-profit levels based on ATR multipliers.
🔔 Set Alerts : Enable alerts for session breakouts or when price hits your designated take-profit targets.
🔍 How It Works
This script operates by identifying session-specific ranges based on highs and lows from the beginning of the selected session (Asia, America, Europe, or others). After a user-defined wait period (default: 120 bars), it calculates the highest and lowest points and creates upper and lower zones using the Average True Range (ATR) to adapt to market volatility. If the price breaks above or below these zones, it is identified as a breakout, and the script dynamically calculates up to three take-profit targets for both bullish and bearish scenarios using an ATR multiplier. The indicator also includes alerts for breakouts and take-profit hits, providing real-time trading signals.

Adaptive SuperTrend Oscillator [AlgoAlpha]Adaptive SuperTrend Oscillator 🤖📈
Introducing the Adaptive SuperTrend Oscillator , an innovative blend of volatility clustering and SuperTrend logic designed to identify market trends with precision! 🚀 This indicator uses K-Means clustering to dynamically adjust volatility levels, helping traders spot bullish and bearish trends. The oscillator smoothly tracks price movements, adapting to market conditions for reliable signals. Whether you're scalping or riding long-term trends, this tool has got you covered! 💹✨
🔑 Key Features:
📊 Volatility Clustering with K-Means: Segments volatility into three levels (high, medium, low) using a K-Means algorithm for precise trend detection.
📈 Normalized Oscillator : Allows for customizable smoothing and normalization, ensuring the oscillator remains within a fixed range for easy interpretation.
🔄 Heiken Ashi Candles : Optionally visualize smoothed trends with Heiken Ashi-style candlesticks to better capture market momentum.
🔔 Alert System : Get notified when key conditions like trend shifts or volatility changes occur.
🎨 Customizable Appearance : Fully customizable colors for bullish/bearish signals, along with adjustable smoothing methods and lengths.
📚 How to Use:
⭐ Add the indicator to favorites by pressing the star icon. Customize settings to your preference:
👀 Watch the chart for trend signals and reversals. The oscillator will change color when trends shift, offering visual confirmation.
🔔 Enable alerts to be notified of critical trend changes or volatility conditions
⚙️ How It Works:
This script integrates SuperTrend with volatility clustering by analyzing ATR (Average True Range) to dynamically identify high, medium, and low volatility clusters using a K-Means algorithm . The SuperTrend logic adjusts based on the assigned volatility level, creating adaptive trend signals. These signals are then smoothed and optionally normalized for clearer visual interpretation. The Heiken Ashi transformation adds an additional layer of smoothing, helping traders better identify the market's true momentum. Alerts are set to notify users of key trend shifts and volatility changes, allowing traders to react promptly.

Dynamic Supply and Demand Zones [AlgoAlpha]Introducing the Dynamic Supply and Demand Zones by AlgoAlpha. This indicator is designed to automatically identify and visualize dynamic supply and demand zones on your chart, helping traders pinpoint potential reversal areas and assess market sentiment with enhanced clarity. It adapts to market conditions using a dynamic look-back mechanism, making it more responsive to recent price movements. 📈💡
Key Features
📊 Dynamic Look-Back : Automatically adjusts the look-back period based on the most recent pivot point, ensuring the most relevant data is analyzed.
🎯 Pivot Point Detection : Utilizes a user-defined period to detect significant pivot highs and lows, marking potential reversal points with precision.
🛠 Customizable Parameters : Offers extensive customization options including look-back period, pivot detection sensitivity, resolution, and zone tolerance.
🗺 Visual Display : Shows supply and demand zones as boxes on the chart, with optional profiles and background highlighting to differentiate between bullish and bearish zones.
🖍 Color-Coded Zones : Zones are color-coded for easy identification: green for bullish, red for bearish, and gray for neutral levels.
🔔 Alert Conditions : Triggers alerts when new pivot points are detected, ensuring you never miss a key market movement.
How to Use
🚀 Adding the Indicator : Press the star icon and add the indicator to favorites. Add it to your chart and adjust settings to fit your trading strategy.
🔍 Zone Analysis : Observe the color-coded zones on the chart. Bullish zones indicate potential support areas, while bearish zones suggest resistance. Monitor price interactions with these zones for potential entry and exit signals.
🔔 Alerts : Activate alert conditions for new pivot detections to stay ahead of market reversals.
How It Works
The indicator starts by detecting pivot highs and lows over a specified period. These pivots serve as reference points for determining the analysis range. If the Dynamic Look-Back feature is enabled, the look-back range dynamically adjusts from the most recent pivot to the current bar. Otherwise, a fixed look-back period is used. The price range is divided into multiple bins based on a specified resolution, and each bin’s volume is calculated by accumulating the volume of candles that fall within its price range. A zone is defined as significant if its volume is less than the adjacent bins, and the difference meets the Zone Tolerance criteria, indicating a potential area of support or resistance. These zones are then plotted on the chart as boxes. Bullish zones are shown in green, and bearish zones in red, helping traders visually identify key levels where supply and demand imbalances may cause price reversals.

Mean Reversion Cloud (Ornstein-Uhlenbeck) // AlgoFyreThe Mean Reversion Cloud (Ornstein-Uhlenbeck) indicator detects mean-reversion opportunities by applying the Ornstein-Uhlenbeck process. It calculates a dynamic mean using an Exponential Weighted Moving Average, surrounded by volatility bands, signaling potential buy/sell points when prices deviate.
TABLE OF CONTENTS
🔶 ORIGINALITY
🔸Adaptive Mean Calculation
🔸Volatility-Based Cloud
🔸Speed of Reversion (θ)
🔶 FUNCTIONALITY
🔸Dynamic Mean and Volatility Bands
🞘 How it works
🞘 How to calculate
🞘 Code extract
🔸Visualization via Table and Plotshapes
🞘 Table Overview
🞘 Plotshapes Explanation
🞘 Code extract
🔶 INSTRUCTIONS
🔸Step-by-Step Guidelines
🞘 Setting Up the Indicator
🞘 Understanding What to Look For on the Chart
🞘 Possible Entry Signals
🞘 Possible Take Profit Strategies
🞘 Possible Stop-Loss Levels
🞘 Additional Tips
🔸Customize settings
🔶 CONCLUSION
▅▅▅▅▅▅▅▅▅▅▅▅▅▅▅▅▅▅▅▅▅▅▅▅▅▅▅▅▅▅▅▅▅▅▅▅▅▅▅▅▅▅▅▅▅▅
🔶 ORIGINALITY The Mean Reversion Cloud (Ornstein-Uhlenbeck) is a unique indicator that applies the Ornstein-Uhlenbeck stochastic process to identify mean-reverting behavior in asset prices. Unlike traditional moving average-based indicators, this model uses an Exponentially Weighted Moving Average (EWMA) to calculate the long-term mean, dynamically adjusting to recent price movements while still considering all historical data. It also incorporates volatility bands, providing a "cloud" that visually highlights overbought or oversold conditions. By calculating the speed of mean reversion (θ) through the autocorrelation of log returns, this indicator offers traders a more nuanced and mathematically robust tool for identifying mean-reversion opportunities. These innovations make it especially useful for markets that exhibit range-bound characteristics, offering timely buy and sell signals based on statistical deviations from the mean.
🔸Adaptive Mean Calculation Traditional MA indicators use fixed lengths, which can lead to lagging signals or over-sensitivity in volatile markets. The Mean Reversion Cloud uses an Exponentially Weighted Moving Average (EWMA), which adapts to price movements by dynamically adjusting its calculation, offering a more responsive mean.
🔸Volatility-Based Cloud Unlike simple moving averages that only plot a single line, the Mean Reversion Cloud surrounds the dynamic mean with volatility bands. These bands, based on standard deviations, provide traders with a visual cue of when prices are statistically likely to revert, highlighting potential reversal zones.
🔸Speed of Reversion (θ) The indicator goes beyond price averages by calculating the speed at which the price reverts to the mean (θ), using the autocorrelation of log returns. This gives traders an additional tool for estimating the likelihood and timing of mean reversion, making the signals more reliable in practice.
🔶 FUNCTIONALITY The Mean Reversion Cloud (Ornstein-Uhlenbeck) indicator is designed to detect potential mean-reversion opportunities in asset prices by applying the Ornstein-Uhlenbeck stochastic process. It calculates a dynamic mean through the Exponentially Weighted Moving Average (EWMA) and plots volatility bands based on the standard deviation of the asset's price over a specified period. These bands create a "cloud" that represents expected price fluctuations, helping traders to identify overbought or oversold conditions. By calculating the speed of reversion (θ) from the autocorrelation of log returns, the indicator offers a more refined way of assessing how quickly prices may revert to the mean. Additionally, the inclusion of volatility provides a comprehensive view of market conditions, allowing for more accurate buy and sell signals.
Let's dive into the details:
🔸Dynamic Mean and Volatility Bands The dynamic mean (μ) is calculated using the EWMA, giving more weight to recent prices but considering all historical data. This process closely resembles the Ornstein-Uhlenbeck (OU) process, which models the tendency of a stochastic variable (such as price) to revert to its mean over time. Volatility bands are plotted around the mean using standard deviation, forming the "cloud" that signals overbought or oversold conditions. The cloud adapts dynamically to price fluctuations and market volatility, making it a versatile tool for mean-reversion strategies. 🞘 How it works Step one: Calculate the dynamic mean (μ) The Ornstein-Uhlenbeck process describes how a variable, such as an asset's price, tends to revert to a long-term mean while subject to random fluctuations. In this indicator, the EWMA is used to compute the dynamic mean (μ), mimicking the mean-reverting behavior of the OU process. Use the EWMA formula to compute a weighted mean that adjusts to recent price movements. Assign exponentially decreasing weights to older data while giving more emphasis to current prices. Step two: Plot volatility bands Calculate the standard deviation of the price over a user-defined period to determine market volatility. Position the upper and lower bands around the mean by adding and subtracting a multiple of the standard deviation. 🞘 How to calculate Exponential Weighted Moving Average (EWMA)
The EWMA dynamically adjusts to recent price movements:
mu_t = lambda * mu_{t-1} + (1 - lambda) * P_t
Where mu_t is the mean at time t, lambda is the decay factor, and P_t is the price at time t. The higher the decay factor, the more weight is given to recent data.
Autocorrelation (ρ) and Standard Deviation (σ)
To measure mean reversion speed and volatility: rho = correlation(log(close), log(close ), length) Where rho is the autocorrelation of log returns over a specified period.
To calculate volatility:
sigma = stdev(close, length)
Where sigma is the standard deviation of the asset's closing price over a specified length.
Upper and Lower Bands
The upper and lower bands are calculated as follows:
upper_band = mu + (threshold * sigma)
lower_band = mu - (threshold * sigma)
Where threshold is a multiplier for the standard deviation, usually set to 2. These bands represent the range within which the price is expected to fluctuate, based on current volatility and the mean.
🞘 Code extract // Calculate Returns
returns = math.log(close / close )
// Calculate Long-Term Mean (μ) using EWMA over the entire dataset
var float ewma_mu = na // Initialize ewma_mu as 'na'
ewma_mu := na(ewma_mu ) ? close : decay_factor * ewma_mu + (1 - decay_factor) * close
mu = ewma_mu
// Calculate Autocorrelation at Lag 1
rho1 = ta.correlation(returns, returns , corr_length)
// Ensure rho1 is within valid range to avoid errors
rho1 := na(rho1) or rho1 <= 0 ? 0.0001 : rho1
// Calculate Speed of Mean Reversion (θ)
theta = -math.log(rho1)
// Calculate Volatility (σ)
sigma = ta.stdev(close, corr_length)
// Calculate Upper and Lower Bands
upper_band = mu + threshold * sigma
lower_band = mu - threshold * sigma
🔸Visualization via Table and Plotshapes
The table shows key statistics such as the current value of the dynamic mean (μ), the number of times the price has crossed the upper or lower bands, and the consecutive number of bars that the price has remained in an overbought or oversold state.
Plotshapes (diamonds) are used to signal buy and sell opportunities. A green diamond below the price suggests a buy signal when the price crosses below the lower band, and a red diamond above the price indicates a sell signal when the price crosses above the upper band.
The table and plotshapes provide a comprehensive visualization, combining both statistical and actionable information to aid decision-making.
🞘 Code extract // Reset consecutive_bars when price crosses the mean
var consecutive_bars = 0
if (close < mu and close >= mu) or (close > mu and close <= mu)
consecutive_bars := 0
else if math.abs(deviation) > 0
consecutive_bars := math.min(consecutive_bars + 1, dev_length)
transparency = math.max(0, math.min(100, 100 - (consecutive_bars * 100 / dev_length)))
🔶 INSTRUCTIONS
The Mean Reversion Cloud (Ornstein-Uhlenbeck) indicator can be set up by adding it to your TradingView chart and configuring parameters such as the decay factor, autocorrelation length, and volatility threshold to suit current market conditions. Look for price crossovers and deviations from the calculated mean for potential entry signals. Use the upper and lower bands as dynamic support/resistance levels for setting take profit and stop-loss orders. Combining this indicator with additional trend-following or momentum-based indicators can improve signal accuracy. Adjust settings for better mean-reversion detection and risk management.
🔸Step-by-Step Guidelines
🞘 Setting Up the Indicator
Adding the Indicator to the Chart:
Go to your TradingView chart.
Click on the "Indicators" button at the top.
Search for "Mean Reversion Cloud (Ornstein-Uhlenbeck)" in the indicators list.
Click on the indicator to add it to your chart.
Configuring the Indicator:
Open the indicator settings by clicking on the gear icon next to its name on the chart.
Decay Factor: Adjust the decay factor (λ) to control the responsiveness of the mean calculation. A higher value prioritizes recent data.
Autocorrelation Length: Set the autocorrelation length (θ) for calculating the speed of mean reversion. Longer lengths consider more historical data.
Threshold: Define the number of standard deviations for the upper and lower bands to determine how far price must deviate to trigger a signal.
Chart Setup:
Select the appropriate timeframe (e.g., 1-hour, daily) based on your trading strategy.
Consider using other indicators such as RSI or MACD to confirm buy and sell signals.
🞘 Understanding What to Look For on the Chart
Indicator Behavior:
Observe how the price interacts with the dynamic mean and volatility bands. The price staying within the bands suggests mean-reverting behavior, while crossing the bands signals potential entry points.
The indicator calculates overbought/oversold conditions based on deviation from the mean, highlighted by color-coded cloud areas on the chart.
Crossovers and Deviation:
Look for crossovers between the price and the mean (μ) or the bands. A bullish crossover occurs when the price crosses below the lower band, signaling a potential buying opportunity.
A bearish crossover occurs when the price crosses above the upper band, suggesting a potential sell signal.
Deviations from the mean indicate market extremes. A large deviation indicates that the price is far from the mean, suggesting a potential reversal.
Slope and Direction:
Pay attention to the slope of the mean (μ). A rising slope suggests bullish market conditions, while a declining slope signals a bearish market.
The steepness of the slope can indicate the strength of the mean-reversion trend.
🞘 Possible Entry Signals
Bullish Entry:
Crossover Entry: Enter a long position when the price crosses below the lower band with a positive deviation from the mean.
Confirmation Entry: Use additional indicators like RSI (above 50) or increasing volume to confirm the bullish signal.
Bearish Entry:
Crossover Entry: Enter a short position when the price crosses above the upper band with a negative deviation from the mean.
Confirmation Entry: Look for RSI (below 50) or decreasing volume to confirm the bearish signal.
Deviation Confirmation:
Enter trades when the deviation from the mean is significant, indicating that the price has strayed far from its expected value and is likely to revert.
🞘 Possible Take Profit Strategies
Static Take Profit Levels:
Set predefined take profit levels based on historical volatility, using the upper and lower bands as guides.
Place take profit orders near recent support/resistance levels, ensuring you're capitalizing on the mean-reversion behavior.
Trailing Stop Loss:
Use a trailing stop based on a percentage of the price deviation from the mean to lock in profits as the trend progresses.
Adjust the trailing stop dynamically along the calculated bands to protect profits as the price returns to the mean.
Deviation-Based Exits:
Exit when the deviation from the mean starts to decrease, signaling that the price is returning to its equilibrium.
🞘 Possible Stop-Loss Levels
Initial Stop Loss:
Place an initial stop loss outside the lower band (for long positions) or above the upper band (for short positions) to protect against excessive deviations.
Use a volatility-based buffer to avoid getting stopped out during normal price fluctuations.
Dynamic Stop Loss:
Move the stop loss closer to the mean as the price converges back towards equilibrium, reducing risk.
Adjust the stop loss dynamically along the bands to account for sudden market movements.
🞘 Additional Tips
Combine with Other Indicators:
Enhance your strategy by combining the Mean Reversion Cloud with momentum indicators like MACD, RSI, or Bollinger Bands to confirm market conditions.
Backtesting and Practice:
Backtest the indicator on historical data to understand how it performs in various market environments.
Practice using the indicator on a demo account before implementing it in live trading.
Market Awareness:
Keep an eye on market news and events that might cause extreme price movements. The indicator reacts to price data and might not account for news-driven events that can cause large deviations.
🔸Customize settings 🞘 Decay Factor (λ): Defines the weight assigned to recent price data in the calculation of the mean. A value closer to 1 places more emphasis on recent prices, while lower values create a smoother, more lagging mean.
🞘 Autocorrelation Length (θ): Sets the period for calculating the speed of mean reversion and volatility. Longer lengths capture more historical data, providing smoother calculations, while shorter lengths make the indicator more responsive.
🞘 Threshold (σ): Specifies the number of standard deviations used to create the upper and lower bands. Higher thresholds widen the bands, producing fewer signals, while lower thresholds tighten the bands for more frequent signals.
🞘 Max Gradient Length (γ): Determines the maximum number of consecutive bars for calculating the deviation gradient. This setting impacts the transparency of the plotted bands based on the length of deviation from the mean.
🔶 CONCLUSION
The Mean Reversion Cloud (Ornstein-Uhlenbeck) indicator offers a sophisticated approach to identifying mean-reversion opportunities by applying the Ornstein-Uhlenbeck stochastic process. This dynamic indicator calculates a responsive mean using an Exponentially Weighted Moving Average (EWMA) and plots volatility-based bands to highlight overbought and oversold conditions. By incorporating advanced statistical measures like autocorrelation and standard deviation, traders can better assess market extremes and potential reversals. The indicator’s ability to adapt to price behavior makes it a versatile tool for traders focused on both short-term price deviations and longer-term mean-reversion strategies. With its unique blend of statistical rigor and visual clarity, the Mean Reversion Cloud provides an invaluable tool for understanding and capitalizing on market inefficiencies.

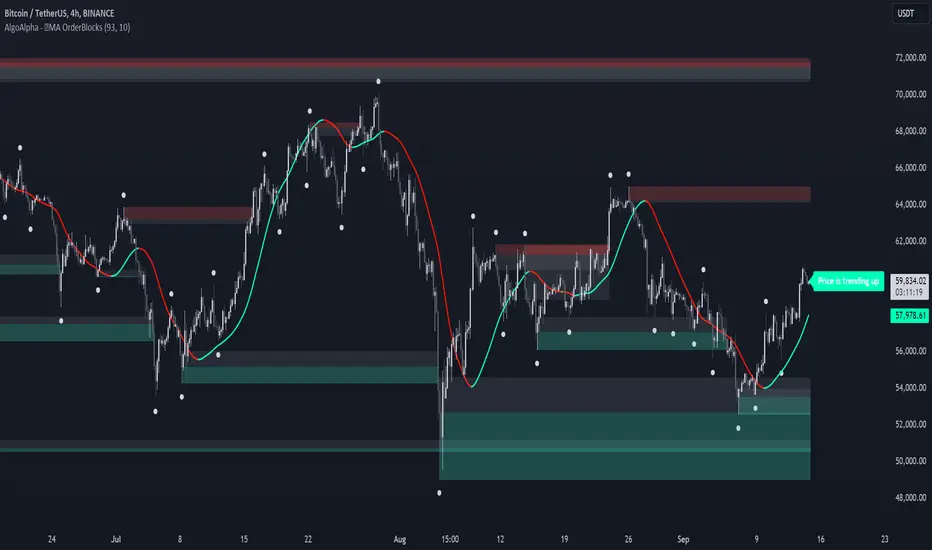
MA OrderBlocks [AlgoAlpha]🟨 HMA OrderBlocks by AlgoAlpha is a powerful tool designed to help traders visualize key pivot zones and order blocks based on the Hull Moving Average (HMA). By dynamically identifying bullish and bearish pivot points, this script provides insights into potential price reversals and trend continuations. With customizable settings, it allows traders to tweak the behavior of the indicator to match their strategies. Plus, it comes packed with built-in alerts for trend changes, making it easier to spot potential trade opportunities.
Key Features :
📊 Trend Detection : Utilizes Hull Moving Average to detect the current trend.
🟢🔴 Bullish & Bearish Zones : Automatically plots bullish and bearish order blocks, using customizable colors for clear visual cues.
🎯 Pivot Points : Detects and marks pivot highs and lows, helping traders spot key price reversals.
🚨 Alerts : Built-in alert system for when the price approaches key bullish or bearish zones, or when the trend changes.
🔨 Customizable MA: Choose from various moving averages (SMA, HMA, EMA, etc.) to suit your strategy.
How to Use :
⭐ Add the Indicator : Add the indicators to favourites by pressing the star icon. Once added, configure settings like the Hull MA period and pivot detection period.
📈 Analyze the Chart : Watch for the plotted order blocks and pivot points to identify possible price action strategies.
🔔 Enable Alerts : Set up alerts to be notified of potential trend reversals or when the price nears a bullish/bearish block.
How It Works :
The script starts by calculating the Hull Moving Average (HMA) based on the user-defined length, which is used to determine the market trend direction. It compares the current HMA value with the previous one to confirm whether the price is trending upwards or downwards. Once a trend change is detected, it plots bullish or bearish order blocks based on recent pivot highs and lows. These zones are extended in real-time as long as they remain invalidated. Zones are invalidated are invalidated when price completely closes through them. If the price gets close to a zone in the opposing direction, a warning system alerts the user that the block may not hold. Additionally, customizable alerts trigger whenever the price trend shifts or the price gets near important bullish/bearish blocks. The script’s logic ensures that order blocks are cleared if price violates them, keeping the chart clean and updated.
Standardized PSAR Oscillator [AlgoAlpha]Enhance your trading experience with the "Standardized PSAR Oscillator" 🪝, a powerful tool that combines the Parabolic Stop and Reverse (PSAR) with standardization techniques to offer more nuanced insights into market trends and potential reversals.
🔑 Key Features:
- 🛠 Customizable PSAR Settings: Adjust the starting point, increment, and maximum values for the PSAR to tailor the indicator to your strategy.
- 📏 Standardization: Smooth out volatility by standardizing the PSAR values using a customizable EMA, making reversals easier to identify.
- 🎨 Dynamic Color-Coding: The oscillator changes colors based on market conditions, helping you quickly spot bullish and bearish trends.
- 🔄 Divergence Detection: Automatic detection of bullish and bearish divergences with customizable sensitivity and confirmation settings.
- 🔔 Alerts: Set up alerts for key events like zero-line crossovers and trend weakening, ensuring you never miss a critical market move.
🚀 How to Use:
✨ Add the Indicator: Add the indicator to favorites by pressing the star icon, adjust the settings to suite your needs.
👀 Monitor Signals: Watch for the automatic plotting of divergences and reversal signals to identify potential market entries and exits.
🔔 Set Alerts: Configure alerts to get notified of key changes without constantly monitoring the charts.
🔍 How It Works:
The Standardized PSAR Oscillator is an advanced trading tool that refines the traditional PSAR (Parabolic Stop and Reverse) indicator by incorporating several key enhancements to improve trend analysis and signal accuracy. The script begins by calculating the PSAR, a widely used indicator known for its effectiveness in identifying trend reversals. To make the PSAR more adaptive and responsive to market conditions, it is standardized using an Exponential Moving Average (EMA) of the high-low range over a user-defined period. This standardization helps to normalize the PSAR values, making them more comparable across different market conditions.
To further enhance signal clarity, the standardized PSAR is then smoothed using a Weighted Moving Average (WMA). This combination of EMA and WMA creates an oscillator that not only captures trend direction but also smooths out market noise, providing a cleaner signal. The oscillator's values are color-coded to visually indicate its position relative to the zero line, with additional emphasis on whether the WMA is rising or falling—this helps traders quickly interpret the trend’s strength and direction.
The oscillator also includes built-in divergence detection by comparing pivot points in price action with those in the oscillator. This feature helps identify potential discrepancies between the price and the oscillator, signaling possible trend reversals. Alerts can be configured for when the oscillator crosses the zero line or when a trend shows signs of weakening, ensuring that traders receive timely notifications to act on emerging opportunities. These combined elements make the Standardized PSAR Oscillator a robust tool for enhancing your trading strategy with more reliable and actionable signals

HMA Z-Score Probability Indicator by Erika BarkerThis indicator is a modified version of SteverSteves's original work, enhanced by Erika Barker. It visually represents asset price movements in terms of standard deviations from a Hull Moving Average (HMA), commonly known as a Z-Score.
Key Features:
Z-Score Calculation: Measures how many standard deviations the current price is from its HMA.
Hull Moving Average (HMA): This moving average provides a more responsive baseline for Z-Score calculations.
Flexible Display: Offers both area and candlestick visualization options for the Z-Score.
Probability Zones: Color-coded areas showing the statistical likelihood of prices based on their Z-Score.
Dynamic Price Level Labels: Displays actual price levels corresponding to Z-Score values.
Z-Table: An optional table showing the probability of occurrence for different Z-Score ranges.
Standard Deviation Lines: Horizontal lines at each standard deviation level for easy reference.
How It Works:
The indicator calculates the Z-Score by comparing the current price to its HMA and dividing by the standard deviation. This Z-Score is then plotted on a separate pane below the main chart.
Green areas/candles: Indicate prices above the HMA (positive Z-Score)
Red areas/candles: Indicate prices below the HMA (negative Z-Score)
Color-coded zones:
Green: Within 1 standard deviation (high probability)
Yellow: Between 1 and 2 standard deviations (medium probability)
Red: Beyond 2 standard deviations (low probability)
The HMA line (white) shows the trend of the Z-Score itself, offering insight into whether the asset is becoming more or less volatile over time.
Customization Options:
Adjust lookback periods for Z-Score and HMA calculations
Toggle between area and candlestick display
Show/hide probability fills, Z-Table, HMA line, and standard deviation bands
Customize text color and decimal rounding for price levels
Interpretation:
This indicator helps traders identify potential overbought or oversold conditions based on statistical probabilities. Extreme Z-Score values (beyond ±2 or ±3) often suggest a higher likelihood of mean reversion, while consistent Z-Scores in one direction may indicate a strong trend.
By combining the Z-Score with the HMA and probability zones, traders can gain a nuanced understanding of price movements relative to recent trends and their statistical significance.

Ranges and Breakouts [AlgoAlpha]💥 Ranges and Breakouts by AlgoAlpha is a dynamic indicator designed for traders seeking to identify market ranges and capitalize on breakout opportunities. This tool automatically detects ranges based on price action over a specified period, visualizing these ranges with shaded boxes and midlines, making it easy to spot potential breakout scenarios. The indicator includes advanced features such as customizable pivot detection, internal range allowance, and automatic trend color changes for quick market analysis.
Key Features
💹 Dynamic Range Detection : Automatically identifies market ranges using customizable look-back and confirmation periods.
🎯 Breakout Alerts : Get alerted to bullish and bearish breakouts for potential trading opportunities.
📊 Visual Aids : Displays pivot highs/lows within ranges and plots midlines with adjustable styles for easier market trend interpretation.
🔔 Alerts : Signals potential take-profit points based on volatility and moving average crossovers.
🎨 Customizable Appearance : Choose between solid, dashed, or dotted lines for midlines and adjust the colors for bullish and bearish zones.
How to Use
⭐ Add the Indicator : Add the indicator to favorites by pressing the star icon. Adjust the settings like the look-back period, confirmation length, and pivot detection to match your trading strategy.
👀 Monitor the Chart : Watch for new ranges to form, highlighted by shaded boxes on the chart. Midlines and range bounds will appear to help you gauge potential breakout points.
⚡ React to Breakouts : Pay attention to color changes and alert signals for bullish or bearish breakouts. Use these signals to enter or exit trades.
🔔 Set Alerts : Customize alert conditions for new range formations, breakout signals, and take-profit levels to stay on top of market movements without constant monitoring.
How It Works
The indicator detects price ranges by analyzing the highest and lowest prices over a specified period. It confirms a range if these levels remain unchanged for a set number of bars, at which point it visually marks the range with shaded boxes. Pivots are identified within these ranges, and a midline is plotted to help interpret potential breakouts. When price breaks out of these defined ranges, the indicator changes the chart's background color to signal a bullish or bearish trend. Alerts can be set for range formation, breakouts, and take-profit opportunities, helping traders stay proactive in volatile markets.

Machine Learning Support and Resistance [AlgoAlpha]🚀 Elevate Your Trading with Machine Learning Dynamic Support and Resistance!
The Machine Learning Dynamic Support and Resistance by AlgoAlpha leverages advanced machine learning techniques to identify dynamic support and resistance levels on your chart. This tool is designed to help traders spot key price levels where the market might reverse or stall, enhancing your trading strategy with precise, data-driven insights.
Key Features:
🎯 Dynamic Levels: Continuously adjusts support and resistance levels based on real-time price data using a K-means clustering algorithm.
🧠 Machine Learning: Utilizes clustering methods to optimize the identification of significant price zones.
⏳ Configurable Lookback Periods: Customize the training length and confirmation length for better adaptability to different market conditions.
🎨 Visual Clarity: Clearly distinguish bullish and bearish zones with customizable color schemes.
📉 Trailing and Fixed Levels: Option to display both trailing and fixed support/resistance levels for comprehensive analysis.
🚮 Auto-Cleaning: Automatically removes outdated levels after a specified number of bars to keep your chart clean and relevant.
Quick Guide to Using the Machine Learning Dynamic Support and Resistance Indicator
Maximize your trading with this powerful indicator by following these streamlined steps! 🚀✨
🛠 Add the Indicator: Add the indicator to favorites by pressing the star icon. Customize settings like clustering training length, confirmation length, and whether to show trailing or fixed levels to fit your trading style.
📊 Market Analysis: Monitor the dynamic levels to identify potential reversal points. Use these levels to inform entry and exit points, or to set stop losses.
How It Works
This indicator employs a K-means clustering algorithm to dynamically identify key price levels based on the historical price data within a specified lookback window. It starts by initializing three centroids based on the highest, lowest, and an average between the highest and lowest price over the lookback period. The algorithm then iterates through the price data to cluster the prices around these centroids, dynamically adjusting them until they stabilize, representing potential support and resistance levels. These levels are further confirmed based on a separate confirmation length parameter to identify "fixed" levels, which are then drawn as horizontal lines on the chart. The script continuously updates these levels as new data comes in, while also removing older levels to keep the chart clean and relevant, offering traders a clear and adaptive view of market structure.

Hullinger Percentile Oscillator [AlgoAlpha]🚀 Introducing the Hullinger Percentile Oscillator by AlgoAlpha! 🚀
This versatile Pine Script™ indicator is designed to help you identify swing trends and potential reversals with precision. Whether you're looking to catch market swings or spot divergences, the Hullinger Percentile Oscillator offers a comprehensive suite of features to enhance your trading strategy.
Key Features
🎯 Customizable Hullinger Settings: Adjust the main length, source, and standard deviation multipliers to fine-tune the indicator to your preferred trading style.
🔄 Dynamic Oscillator Modes: Switch between "Swing" mode for trend identification and "Contrarian" mode for reversal spotting, adapting the indicator to your market view.
📉 Divergence Detection: The indicator includes parameters to control the sensitivity and confirmation of divergence signals, helping to filter out noise and highlight significant market moves.
🌈 Color-Coded Visuals: Easily distinguish between bullish and bearish signals with customizable color settings for a clear visual representation on your chart.
🔔 Alert Integration: Stay ahead of the market with built-in alerts for key conditions, including strong and weak reversals, as well as bullish and bearish swings.
Quick Guide to Using the Hullinger Percentile Oscillator
Maximize your trading edge with the Hullinger Percentile Oscillator by following these steps! 📈✨
🛠 Add the Indicator: Add the indicator to favorites by pressing the star icon ⭐. Customize settings like Main Length, Oscillator Mode, and Appearance to fit your trading needs.
📊 Market Analysis: Use "Swing" mode to track trends and "Contrarian" mode to spot reversals. Watch for divergence signals to catch potential trend changes.
🔔 Alerts: Set up alerts to be notified of significant market movements without constantly monitoring your chart.
How It Works
The Hullinger Percentile Oscillator calculates its signals by applying a modified standard deviation approach to the Hull Moving Average (HMA) of a selected price source. It creates both inner and outer bands based on different multipliers. The oscillator then measures the position of the price relative to these bands, smoothing the result for swing trend detection. Depending on the chosen mode, the oscillator either highlights swing trends or potential reversals. Divergences are detected by comparing recent pivot highs and lows in both price and the oscillator, allowing you to spot bullish or bearish divergence setups. Alerts are triggered based on key crossovers or when specific conditions are met, ensuring that you are always informed of crucial market developments.

Hullinger Bands [AlgoAlpha]🎯 Introducing the Hullinger Bands Indicator ! 🎯
Maximize your trading precision with the Hullinger Bands , an advanced tool that combines the strengths of Hull Moving Averages and Bollinger Bands for a robust trading strategy. This indicator is designed to give traders clear and actionable signals, helping you identify trend changes and optimize entry and exit points with confidence.
✨ Key Features :
📊 Dual-Length Settings : Customize your main and TP signal lengths to fit your trading style.
🎯 Enhanced Band Accuracy : The indicator uses a modified standard deviation calculation for more reliable volatility measures.
🟢🔴 Color-Coded Signals : Easily spot bullish and bearish conditions with customizable color settings.
💡 Dynamic Alerts : Get notified for trend changes and TP signals with built-in alert conditions.
🚀 Quick Guide to Using Hullinger Bands
1. ⭐ Add the Indicator : Add the indicator to favorites by pressing the star icon. Adjust the settings to align with your trading preferences, such as length and multiplier values.
2. 🔍 Analyze Readings : Observe the color-coded bands for real-time insights into market conditions. When price is closer to the upper bands it suggests an overbought market and vice versa if price is closer to the lower bands. Price being above or below the basis can be a trend indicator.
3. 🔔 Set Alerts : Activate alerts for bullish/bearish trends and TP signals, ensuring you never miss a crucial market movement.
🔍 How It Works
The Hullinger Bands indicator calculates a central line (basis) using a simple moving average, while the upper and lower bands are derived from a modified standard deviation of price movements. Unlike the traditional Bollinger Bands, the standard deviation in the Hullinger bands uses the Hull Moving Average instead of the Simple Moving Average to calculate the average variance for standard deviation calculations, this give the modified standard deviation output "memory" and the bands can be observed expanding even after the price has started consolidating, this can identify when the trend has exhausted better as the distance between the price and the bands is more apparent. The color of the bands changes dynamically, based on the proximity of the closing price to the bands, providing instant visual cues for market sentiment. The indicator also plots TP signals when price crosses these bands, allowing traders to make informed decisions. Additionally, alerts are configured to notify you of crucial market shifts, ensuring you stay ahead of the curve.
