Res/Sup With Concavity & Increasing / Decreasing Trend AnalysisPurple means the concavity is down blue means concavity is up which is good.
Yellow means increasing, Red means decreasing.
Sup = Green
Res = Red
Mean-reversion

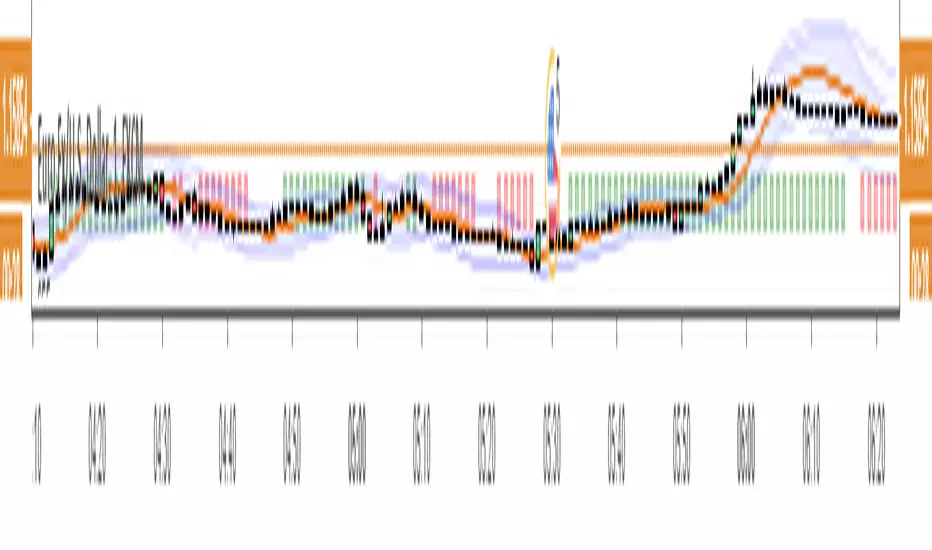
Hurst ExponentMy first try to implement Full Hurst Exponent.
The Hurst exponent is used as a measure of long-term memory of time series. It relates to the autocorrelations of the time series and the rate at which these decrease as the lag between pairs of values increases
The Hurst exponent is referred to as the "index of dependence" or "index of long-range dependence". It quantifies the relative tendency of a time series either to regress strongly to the mean or to cluster in a direction.
In short, depending on the value you can spot the trending / reversing market.
Values 0.5 to 1 - market trending
Values 0 to 0.5 - market tend to mean revert
Hurst Exponent is computed using Rescaled range (R/S) analysis.
I split the lookback period (N) in the number of shorter samples (for ex. N/2, N/4, N/8, etc.). Then I calculate rescaled range for each sample size.
The Hurst exponent is estimated by fitting the power law. Basically finding the slope of log(samples_size) to log(RS).
You can choose lookback and sample sizes yourself. Max 8 possible at the moment, if you want to use less use 0 in inputs.
It's pretty computational intensive, so I added an input so you can limit from what date you want it to be calculated. If you hit the time limit in PineScript - limit the history you're using for calculations.
####################
Disclaimer
Please remember that past performance may not be indicative of future results.
Due to various factors, including changing market conditions, the strategy may no longer perform as good as in historical backtesting.
This post and the script don’t provide any financial advice.

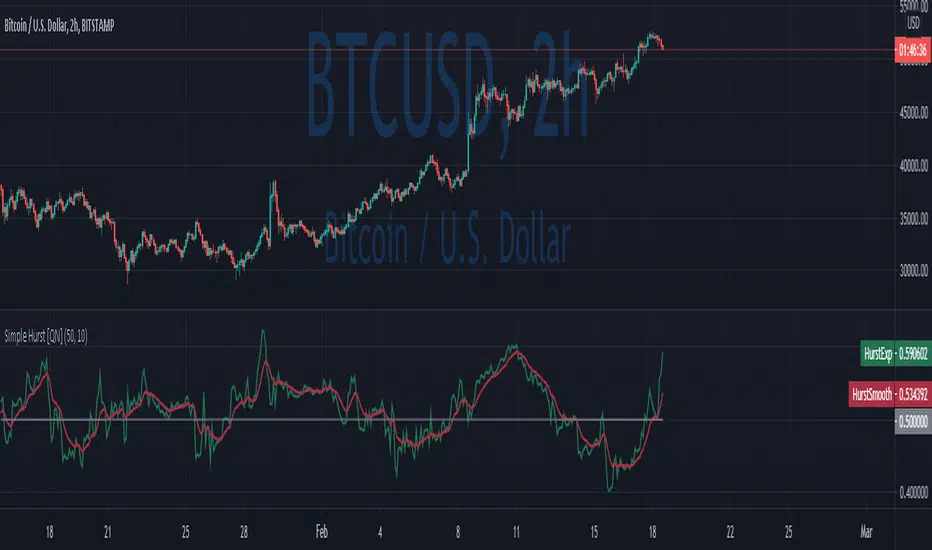
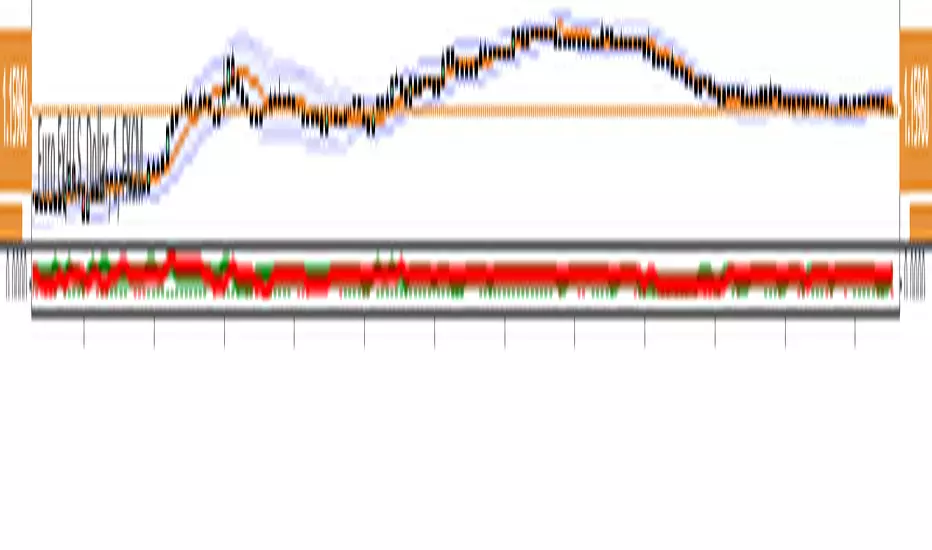
Simple Hurst Exponent [QuantNomad]This is a simplified version of the Hurst Exponent indicator.
In the meantime, I'm working on the full version. It's computationally intensive, so it's a challenge to squeeze it to PineScript limits. It will require some time to optimize it, so I decided to publish a simplified version for now.
The Hurst exponent is used as a measure of long-term memory of time series. It relates to the autocorrelations of the time series, and the rate at which these decrease as the lag between pairs of values increases
The Hurst exponent is referred to as the "index of dependence" or "index of long-range dependence". It quantifies the relative tendency of a time series either to regress strongly to the mean or to cluster in a direction.
In short depend on value you can spot trending / reversing market.
Values 0.5 to 1 - market trending
Values 0 to 0.5 - market tend to mean revert
####################
Disclaimer
Please remember that past performance may not be indicative of future results.
Due to various factors, including changing market conditions, the strategy may no longer perform as good as in historical backtesting.
This post and the script don’t provide any financial advice.

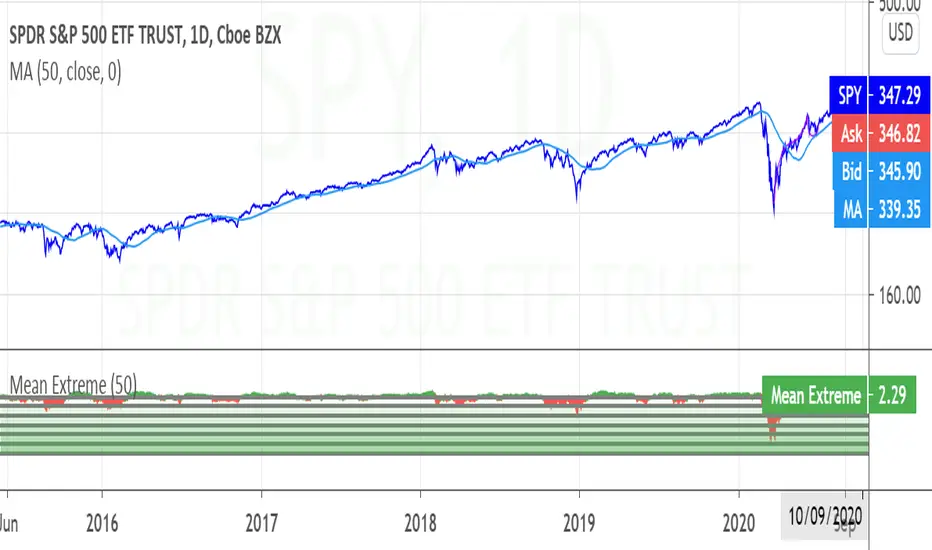
Mean ExtremeA simple script that shows the distance from a the mean, expressed as a percentage.
Simple Moving Average, in this case.
Informational only.
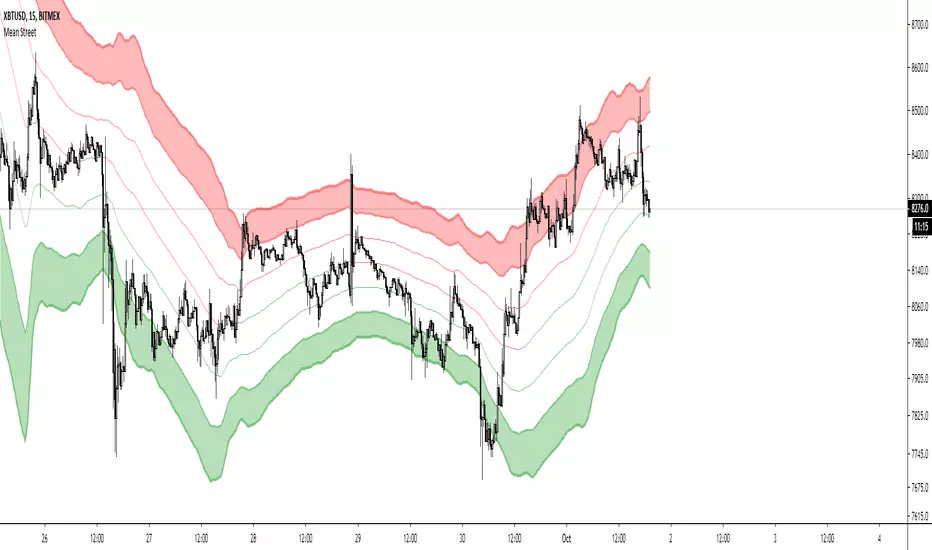
Mean recursion envelopeFree for public consumption
There is very little original here, the idea is discussed in the underground traders alliance, (google em), and was apparently the basis of what was at one time myfxbooks most profitable strategy.
I can't find the original video that was floating around on youtube, but if i find it again, i'll link it here.
This is bascially just the TV default envelope code copied and modified.
The idea is to have an envelope based on a low length, exponential basis. Then to manually "tune" the percent input so that the envelopes engulf most bars. Whenever price goes outside the envelopes (especially at key levels), look for a change to enter a reversion back to the ema.
This manual tuning when switching between time-frames and symbols of the percentage input, becomes arduous.
Instead this script uses the TV envelope code, but gets a setting based on the average of true range and "autotunes" with this.
Anything that protrudes beyond that level, especially at key levels, is likely to revert back to the ema. Bear in mind, a run away trend will also push past the envelopes and continue running for several (3-5) bars so, use it mindfully and thoughtfully with all the usual cautions about risk management.

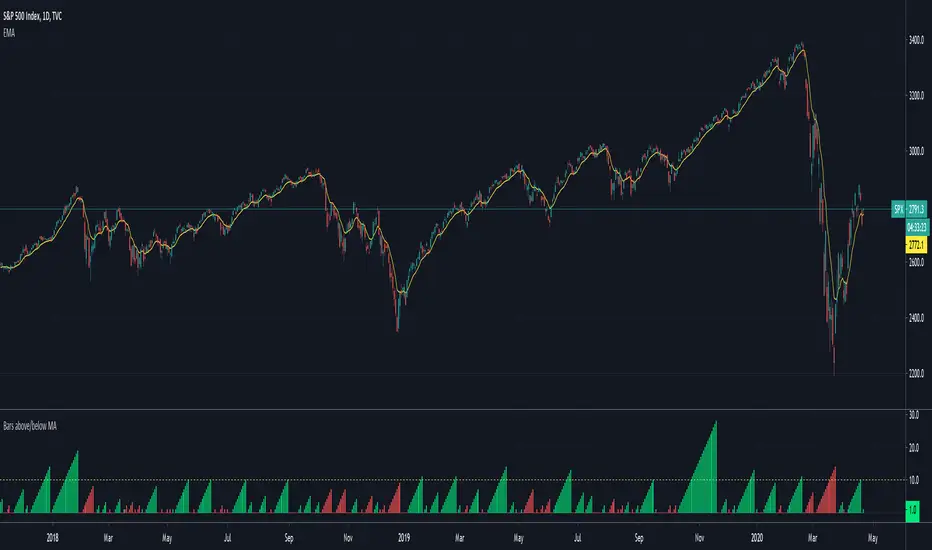
Bars above/below EMACount of previous bars above or below a chosen Exponential Moving Average. Typically price reconnects with well defined EMAs regularly. If the price has been above/below an EMA for too long, you can expect a reconnect in a short order and bet on mean reversion strategies.
Mean Street V1script for mean reversion conditions - tweak-able based on the volatility of the asset its used on, and the time frame
Mean Reversion IndicatorThis is a mean reversion indicator that anticipates a local trend reversion. Basically, it is a channel with the mid-line serving as a moving mean baseline. Each of the two curves run up and down within this channel bouncing off from the top and bottom bounds. Touching the bounds serves as an indication of a local trend reversal. The reversal signal is stronger when there exists a resonance (symmetry) in the two curves. The background histogram shows a Karobein oscillator that contributes support or resistance for the signal.

Mean Reversion and Momentum - Updated with gaussiana smoothingMean Reversion and Momentum
Interpretation:
- Divergence means trend reversal
- Parallel movement means trend continuation
Squares above serve as a confirming signal

Mean Reversion and Momentum - Indicator versionMean Reversion and Momentum
Interpretation:
- Divergence means trend reversal
- Parallel movement means trend continuation
Squares above serve as a confirming signal
B3 ALMA PendulumB3 Pendulums, quick little indicators that do change print inside the current bar, so beware. It is good for anticipation, but it is important to make sure the current and next bars follow through.
Ever wanted an indicator that really points out the micro term action in the form of a pendulum swing? This my attempt to show the market ups and downs in the smallest amount of lag possible. This indicator is designed to bounce back and forth from 100 to -100 as it shows you the price's relationship to ALMA. Really its just a simple deviance from mean study made to amplify the quick ups and downs, and kind of the neatest on Heikin Ashi setups. It looks like Arabic language at first glance, lol.
This should be easy to template out to your own MA's. ~I hope you are enjoying the B3 scripts, that is now 9 open source shares and a couple protected ones. I still plan on a few more give-a-ways, as I prepare some of the algorithmic things I do for subscription. Feel free to comment about things you would like to see! ~B3
