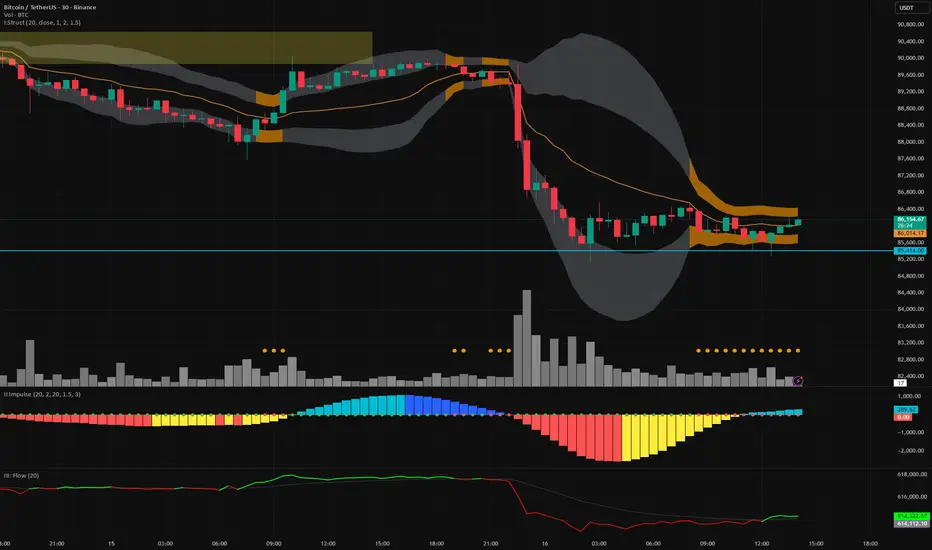
Vector Trinity indicator II: [Bottom: TTM Squeeze]**1. Introduction: The Engine of the System**
This indicator is **Part 2** of the "Vector Trinity" trading system. While Part I (Structure) defines *where* the price is, **Part II (Impulse)** defines *when* the move will happen and *how strong* it is.
It represents the **Time Dimension** of the system, focusing on momentum ignition and energy release.
* **I: Structure:** Spatial boundaries.
* **II: Impulse:** **Momentum velocity & Squeeze timing (Current Indicator).**
* **III: Flow:** Capital validation.
**2. Core Logic: Linear Regression Momentum**
Unlike standard momentum indicators (like MACD) which are based on Moving Averages and often lag significantly, **Vector Trinity II** utilizes **Linear Regression** on price deviations.
* **Math:** It calculates the distance between the price and the mean, then runs a linear regression to determine the angle of attack.
* **Benefit:** This provides a near-instantaneous reading of market "Velocity" and "Acceleration," reducing lag and allowing traders to see the turn before price fully commits.
**3. The "Squeeze" Mechanics (The Dots)**
The central line features dots that indicate the volatility state of the market:
* **🔴 Red Dot (Squeeze ON):** The Bollinger Bands have moved inside the Keltner Channels. Volatility is critically low. The market is storing energy like a compressed spring. **Action:** Wait. Do not trade yet.
* **🟢 Green Dot (Squeeze Fired):** The Bands have popped out of the Channels. The energy is releasing. **Action:** This is the "Ignition" signal. Look at the histogram color for direction.
**4. The 4-Color Momentum System**
The histogram bars are color-coded to tell the full story of the trend's lifecycle, not just direction:
* **Bullish Territory (Above 0):**
* **🟦 Cyan (Light Blue):** **Bullish Acceleration.** Buyers are aggressive. Momentum is increasing. (Best for entry).
* **🔷 Blue (Dark Blue):** **Bullish Deceleration.** Buyers are tired. Momentum is fading. (Prepare to take profit).
* **Bearish Territory (Below 0):**
* **🟥 Red:** **Bearish Acceleration.** Sellers are aggressive. Momentum is increasing. (Best for shorting).
* **🟨 Yellow:** **Bearish Deceleration.** Sellers are exhausted. Momentum is recovering towards zero. (Warning: Trend potential reversal).
**5. How to Use**
* **Step 1:** Look for **Red Dots** on the zero line. This identifies a high-potential setup building up.
* **Step 2:** Wait for the **First Green Dot**. This is the "Squeeze Fired" signal.
* **Step 3:** Confirm with the **Histogram Color**.
* If Green Dot + **Cyan Bar** = Long Signal.
* If Green Dot + **Red Bar** = Short Signal.
* **Advanced:** Use the **Yellow Bars** as an early warning to exit short positions before price actually reverses.
**Settings:**
* **Length:** 20 (Standard calculation period).
* **BB/KC Mult:** 2.0 / 1.5 (Standard ratios to define the Squeeze).
* **Smoothing:** Enabled (Default 3) to reduce noise and provide clearer color transitions.
---
### **中文说明**
**1. 简介:系统的核心引擎**
本指标是“矢量三位一体”交易系统的 **第二部分**。如果说第一部分 (Structure) 定义了价格*在哪里*,那么 **第二部分 (Impulse)** 则定义了行情*何时*启动以及力度*有多强*。
它代表了系统的 **时间维度**,专注于动能的点火与能量释放。
* **I: Structure 结构:** 空间边界。
* **II: Impulse 脉冲:** **动能速度与挤压时机(本指标)。**
* **III: Flow 流向:** 资金验证。
**2. 核心逻辑:线性回归动能**
传统的动能指标(如 MACD)通常基于移动平均线,存在显著的滞后性。**Vector Trinity II** 采用了基于价格偏离度的 **Linear Regression (线性回归)** 算法。
* **数学原理:** 它计算价格与均值的距离,并通过回归分析确定攻击的角度。
* **优势:** 这提供了几乎零滞后的市场“速度”与“加速度”读数,允许交易者在价格完全反转之前看到动能的拐点。
**3. “挤压”机制 (圆点信号)**
0轴上的圆点指示了市场的波动率状态:
* **🔴 红点 (Squeeze ON):** 布林带完全进入了肯特纳通道内部。波动率极低。市场像被压缩的弹簧一样在积蓄能量。**操作:** 等待,不要急于进场。
* **🟢 绿点 (Squeeze Fired):** 布林带扩张冲出通道。能量开始释放。**操作:** 这是“点火”信号。观察柱状图颜色以确定方向。
**4. 四色动能战术系统**
柱状图通过四种颜色讲述了趋势完整的生命周期,而不仅仅是涨跌:
* **多头区域 (0轴上方):**
* **🟦 青色 (Cyan):** **多头加速。** 买盘积极,动能增强。(最佳进场期)
* **🔷 蓝色 (Blue):** **多头减速。** 买盘疲惫,动能衰减。(准备止盈)
* **空头区域 (0轴下方):**
* **🟥 红色 (Red):** **空头加速。** 卖盘积极,动能增强。(最佳做空期)
* **🟨 黄色 (Yellow):** **空头减速。** 卖盘力竭,动能向0轴修复。(警告:趋势可能反转/抄底信号)
**5. 使用方法**
* **第一步:** 寻找0轴上的 **红点**。这标志着一个高爆发潜力的机会正在酝酿。
* **第二步:** 等待 **第一个绿点** 出现。这是“挤压释放/点火”的信号。
* **第三步:** 结合 **柱状图颜色** 确认。
* 绿点 + **青色柱** = 做多信号。
* 绿点 + **红色柱** = 做空信号。
* **进阶用法:** 利用 **黄色柱** 作为空单止盈的先行指标,往往在价格反弹之前,动能就已经变黄了。
**参数设置:**
* **Length (周期):** 20 (标准计算周期)。
* **BB/KC Mult (倍数):** 2.0 / 1.5 (定义挤压状态的标准比率)。
* **Smoothing (平滑):** 开启 (默认3) 以减少噪音,提供更平滑的颜色转换体验。
Macd-v
Dual Momentum Confluence Oscillator MACD + RSIThis indicator is built around the **simultaneous use of two complementary momentum perspectives**, designed to be read **together**, not in isolation.
### Core purpose
* Highlight moments where **momentum agreement** or **momentum imbalance** becomes visually evident.
* Help distinguish between **healthy movement**, **loss of strength**, and **potential transition phases**.
### Combined reading approach
* One component focuses on **momentum flow and acceleration**, showing how force develops or fades.
* The other evaluates **relative pressure within recent price action**, adding context to whether momentum is stretched or still balanced.
* Signals are meant to be interpreted when **both perspectives are considered at the same time**, reinforcing or filtering each other.
### Practical use
* Particularly useful as a **confirmation layer** for directional strategies.
* Helps avoid decisions based on a single momentum measure by requiring **contextual alignment**.
* Can also support timing refinement in both continuation and pullback scenarios.
### Visual structure
* Everything is displayed in **one compact pane**, allowing quick cross-market scanning without overloading the chart.
* Visual contrast makes changes in momentum state easy to spot at a glance.
### Best conditions
* Most effective in markets with **clear participation and readable momentum shifts**.
* Less informative during flat, low-energy phases.
*For educational and analytical purposes only. Always test across multiple markets and timeframes.*
---
Così è chiaro che **RSI e MACD lavorano insieme**, ma **nessuno può risalire a come**.

MTF Trend DashboardThe Multi-Timeframe Trend Dashboard PRO is an advanced technical analysis tool that consolidates trend signals across six configurable timeframes into a single, intuitive heat-map dashboard. Designed for traders who need instant market clarity without switching between charts.
Core Features
🌊 Multi-Timeframe Analysis
Analyzes up to 6 customizable timeframes simultaneously (5m, 15m, 1H, 4H, Daily, Weekly)
Each timeframe independently evaluated for trend direction and strength
Weighted scoring system prioritizes higher timeframe signals
📈 Four-Pillar Technical Confluence
EMA Crossover (20/50) - Trend direction indicator (🟢 Bullish / 🔴 Bearish)
RSI (14) - Momentum analysis with exact values and overbought/oversold zones
MACD (12,26,9) - Momentum confirmation (🟢 Positive / 🔴 Negative)
Volume Analysis - Confirms move validity (🔥 High / ❄️ Low / ⚪ Normal)
🎯 Smart Signal System
🚀 STRONG BUY - All indicators strongly bullish (Score ≥2.5)
📈 BUY - Multiple bullish confirmations (Score 1.5-2.5)
🟢 Bullish - Mild uptrend (Score 0-1.5)
⚪ NEUTRAL - Sideways market (Score = 0)
🔴 Bearish - Mild downtrend (Score -1.5 to 0)
📉 SELL - Multiple bearish confirmations (Score -2.5 to -1.5)
💥 STRONG SELL - All indicators strongly bearish (Score ≤-2.5)
🎨 Heat-Map Color Coding
Bright Green = Strong uptrend with high conviction
Yellow = Neutral/Choppy conditions
Bright Red = Strong downtrend with high conviction
Color intensity reflects signal strength
💪 Strength Meter
Visual bar showing average trend strength across all timeframes (0-100%)
Helps identify powerful moves vs weak consolidations
🎯 Overall Bias
Weighted composite score emphasizing higher timeframes
Daily/Weekly signals carry 4-5x more weight than intraday
Provides "big picture" directional bias
🚨 Built-in Alert System
Strong Bullish/Bearish Confluence detected
Major trend changes across multiple timeframes
Customizable alert messages
How to Use
Trend Confirmation - Look for alignment (all rows showing same color = strong trend)
Divergence Detection - Lower timeframes differ from higher = potential reversal
Entry Timing - Wait for Overall Bias + multiple green signals with 🔥 volume
Risk Management - Avoid trades when Overall Bias shows ⚪ NEUTRAL
Customization
Adjustable EMA, RSI, MACD, Volume parameters
Flexible timeframe selection (enable/disable any TF)
Dark/Light theme support
Position and size controls
© | Built on TradingView
Precision tools for precision traders.

Take Profit XTake Profit X
Take Profit X solves the #1 problem in trading: knowing when to exit. Instead of guessing or using single indicators, it aggregates 8 technical signals to identify high-probability exit points through multi-confirmation consensus. This eliminates premature exits and emotional decision-making.
The indicator counts confirmations from your chosen technical tools:
Green dot = Multiple signals say "take profit on longs/exit shorts"
Red dot = Multiple signals say "take profit on shorts/exit longs"
Signals appear when you reach the minimum confirmations threshold you set.
Possible Settings:
Conservative (Swing Trading)
pine
Minimum Confirmations: 4
Use: RSI, MACD, CCI, Supertrend, Price Action
Disable: Stochastic, Bollinger Bands, EMA Cross
Look Back Bars: 10
Aggressive (Day Trading)
pine
Minimum Confirmations: 2
Use: All indicators ON
Look Back Bars: 3-5
RSI OB/OS: 75/25
Balanced (Most Markets)
pine
Minimum Confirmations: 3
Use: RSI, MACD, CCI, Supertrend
Price Action: ON
Look Back Bars: 5-7

MACD Nexus Pro [OXE]MACD Nexus Pro
Institutional-Grade Momentum Intelligence System
Transform How You Read Market Momentum
Standard MACD indicators show you what happened. MACD Nexus Pro shows you what's about to happen.
Built for serious traders who demand more than basic crossovers, this indicator combines 8 proprietary analysis engines into one powerful momentum intelligence system. Whether you trade forex, crypto, stocks, or commodities — MACD Nexus Pro gives you the institutional edge.
What Makes This Different?
Most MACD indicators are stuck in the 1970s. They show you two lines, a histogram, and leave you guessing. MACD Nexus Pro was engineered from the ground up to answer the questions professional traders actually ask:
"Is this signal confirmed across multiple timeframes?"
"Is this momentum move real or a fake-out?"
"Are smart money players accumulating or distributing?"
"Is this trend exhausted or just getting started?"
Core Benefits for Traders
🎯 Eliminate False Signals with MTF Confluence
Stop getting chopped up by single-timeframe noise. The Multi-Timeframe Confluence Matrix scans 4 timeframes simultaneously and calculates a unified alignment score from -5 to +5.
How it helps you:
Only take trades when multiple timeframes agree
See instantly if higher timeframes support your entry
Avoid counter-trend trades that fail 80% of the time
Build confidence knowing the "big picture" backs your trade
📊 Know Your Market Regime Instantly
Markets behave differently in trending vs ranging conditions. The Regime Detection Engine automatically classifies current conditions as TRENDING, VOLATILE, RANGING, or NEUTRAL.
How it helps you:
Adjust your strategy to match market conditions
Avoid momentum trades in choppy, ranging markets
Capitalize on trending markets with confidence
Stop forcing trades when conditions don't favor your style
🔄 Catch Reversals Early with Smart Divergence Detection
Divergences signal potential reversals before they happen — but spotting them manually is tedious and error-prone. The Divergence Engine automatically detects both Regular and Hidden divergences, then rates their strength.
How it helps you:
Get early warning of trend exhaustion
Find high-probability reversal entries
Use Hidden divergences for trend continuation trades
Prioritize strong divergences (★★★★) over weak ones
🏦 Trade Alongside Smart Money
Institutional players leave footprints. The Smart Money Momentum Zones detect when volume-weighted momentum enters extreme territory — signaling potential accumulation (buying) or distribution (selling) by large players.
How it helps you:
Identify where institutions are likely positioning
Buy in accumulation zones with smart money
Sell or short in distribution zones
Avoid buying into institutional selling
⚡ Distinguish Impulse Moves from Corrections
Not all momentum is created equal. The Impulse Wave Detection system identifies whether current momentum is an impulse (strong, directional) or a correction (weak, counter-trend).
How it helps you:
Enter on impulses, not corrections
Hold winners through corrections without panic
Recognize when a trend is resuming
Time entries at the start of new momentum waves
📍 Never Miss True Equilibrium
Static zero lines are outdated. The Dynamic Zero Line adapts to the market's true momentum equilibrium, shifting based on long-term bias.
How it helps you:
Understand the market's real neutral point
Recognize bullish/bearish bias at a glance
Better time zero-line crossover trades
Filter signals based on positioning above/below equilibrium
⚠️ Get Warned Before Momentum Dies
Chasing extended moves is how traders lose money. The Momentum Exhaustion Detector calculates the thrust-to-follow-through ratio and warns you when momentum is overextended.
How it helps you:
Avoid late entries into tired trends
Take profits before reversals hit
Spot when bulls/bears are running out of steam
Stay patient for better entries after exhaustion
🌈 Read Momentum Strength at a Glance
The Gradient Histogram Heatmap shows momentum acceleration through color intensity — brighter colors mean momentum is building, faded colors mean it's dying.
How it helps you:
Instantly see if momentum is accelerating or fading
Confirm breakouts with strengthening momentum
Spot weakening moves before price confirms
Make faster decisions with visual clarity
The Signal System You Can Trust
Every buy/sell signal comes with a Star Rating (★ to ★★★★★) based on:
Multi-timeframe alignment
Position relative to dynamic zero
Market regime confirmation
Volume confirmation
Exhaustion status
Choose your signal mode:
Standard: Classic MACD crossovers
Confluence: Only signals with MTF agreement (recommended)
Aggressive: Early entries with directional confluence
All signals are 100% non-repainting — what you see is what happened, permanently.
Two Professional Dashboards
MTF Confluence Panel (Top-Right)
TimeframeTrendAbove ZeroCurrent▲/▼✓/✗15min▲/▼✓/✗1H▲/▼✓/✗4H▲/▼✓/✗Daily▲/▼✓/✗
Nexus Status Panel (Bottom-Right)
Regime: TRENDING / VOLATILE / RANGING / NEUTRAL
Confluence: Net score (-5 to +5)
Zone: ACCUMULATION / DISTRIBUTION / NEUTRAL
Momentum: IMPULSE / CORRECTION / NORMAL
Exhaustion: BULL TIRED / BEAR TIRED / OK
Built-In Alerts
Never miss a trade. Set alerts for:
✅ Buy/Sell signals
✅ High-confluence signals (4+ stars)
✅ Momentum exhaustion warnings
✅ Impulse wave starts
✅ Zero line crosses
✅ Bullish/Bearish divergences
Who Is This For?
✓ Day Traders — Filter noise with MTF confluence, catch impulse moves early
✓ Swing Traders — Ride trends confidently with regime detection and exhaustion warnings
✓ Scalpers — Use aggressive mode with volume-confirmed signals
✓ Position Traders — Align with smart money accumulation/distribution zones
✓ Crypto Traders — Essential for volatile markets where exhaustion detection saves accounts
✓ Forex Traders — Multi-session momentum tracking across timeframes
What Traders Are Saying
"Finally, a MACD that tells me more than just 'line crossed line.' The exhaustion warnings alone have saved me from so many bad trades."
"The MTF confluence is a game-changer. I only trade 4+ star setups now and my win rate has never been better."
"I love how the regime detection stops me from forcing momentum trades in ranging markets. Should have had this years ago."
Summary: Your Edge in 8 Features
FeatureWhat It DoesYour BenefitMTF ConfluenceScans 4 timeframesHigher probability entriesRegime DetectionClassifies market conditionsRight strategy, right timeDivergence EngineFinds reversal signalsCatch turns earlySmart Money ZonesDetects institutional activityTrade with the big playersImpulse DetectionIdentifies momentum qualityEnter on strength, not weaknessDynamic Zero LineAdapts to market biasTrue equilibrium referenceExhaustion DetectorWarns of tired momentumAvoid late, losing tradesGradient HistogramShows acceleration visuallyInstant momentum read
Settings Overview
Fully customizable for any trading style:
MACD lengths (Fast/Slow/Signal)
4 MTF timeframes
Divergence sensitivity
Regime detection parameters
Signal mode selection
Minimum confluence threshold
Zone thresholds
Visual colors and toggles
Risk Disclaimer
No indicator guarantees profits. MACD Nexus Pro is a decision-support tool designed to improve your analysis — not replace sound risk management. Always use stop losses and never risk more than you can afford to lose.
Upgrade Your Momentum Analysis Today
Stop guessing. Start trading with institutional-grade momentum intelligence.
MACD Nexus Pro — See Momentum Differently.

Trade TableDisplays a trade table for a given account size and risk percentage for long or short trades along with a calculated stop loss and number of shares to purchase. An optional table showing the PSC calculations is also available.

Trend Change ScannerTrend Change Scanner
Focused on detecting trend reversals:
Shows reversal status: BULL REV, BEAR REV, BULL SETUP, BEAR SETUP, or Neutral
Displays: Trend direction, RSI, ADX, EMA Gap %, Bull/Bear scores
Yellow highlight when EMA gap < 0.5% (EMAs converging - potential cross)
Overall signal with action recommendation

SCOTTGO Advanced MACD🌟 Custom MACD: Enhanced Visuals & Crossover Signals
This indicator is a highly customized version of the traditional Moving Average Convergence Divergence (MACD) oscillator, designed to provide clear, immediate visual confirmation of signal line crossovers and zero-line crossings.
Core Features:
MACD Crossover Shadow Fill: The area between the MACD line and the Signal line is filled with a customizable shadow. This instantly visualizes whether the MACD is above (bullish crossover) or below (bearish crossover) the Signal line.
Signal Crossover Markers (Arrows & Dots):
Crossover Dot: A small, configurable solid dot is plotted exactly at the point where the MACD and Signal lines intersect, providing pinpoint accuracy for the crossover event.
Crossover Arrows: Customizable up (green) and down (red) arrows are plotted using a small numerical offset from the crossover point, ensuring visibility without cluttering the indicator lines.
Zero-Line Crossing Markers: Distinct, small markers (circles/diamonds) are used to signal when the MACD line crosses the zero line, indicating a shift in momentum relative to the baseline.
Customizable MA Type: The user can select either Exponential Moving Average (EMA) or Simple Moving Average (SMA) for both the MACD oscillator calculation and the signal line calculation.
This indicator is ideal for traders who rely on MACD crossovers and require precise, configurable visual feedback directly on the chart.

KSL-Fullsystem V2.0Trend Following & Reversal Trading System. It combines **Price Action (Market Structure)** with multiple technical indicators to generate high-quality Buy and Sell signals.
---
1. How Signals are Generated (The Core Logic)
The script uses **"Internal Shifts"** (Market Structure Breaks) to find entry points.
* BUY Signal: The price breaks above a previous bearish structure (Higher High) + All enabled filters are Green.
* SELL Signal: The price breaks below a previous bullish structure (Lower Low) + All enabled filters are Red.
When a signal occurs, the script automatically calculates:
* Stop Loss (SL): Based on the recent Swing High/Low.
* Take Profit (TP): Three levels (TP1, TP2, TP3) based on risk-reward ratios (1.5x, 2.0x, 3.0x).
---
2. The Filters (Your Confirmation Checklist)
You can turn these On/Off in the settings. **Note:** If you turn *all* of them on, you might get very few signals because the conditions become too strict.
**A. Bollinger Bands (BB) Filters (Primary Feature)**
This is the main filter for this version.
* Squeeze Filter: Prevents trading when the bands are too narrow (low volatility). If the background turns **Yellow**, it means the market is "Squeezing" – **Do Not Trade.**
* Touch Entry: Looks for price bouncing off the Lower Band (Buy) or Upper Band (Sell).
* Breakout Entry: Looks for price blasting through the bands.
* Mean Reversion: Checks if price is reverting to the middle line (Basis).
**B. Moving Average Filters (Trend)**
The script includes three types of Moving Averages. You can choose which style suits you:
* EMA (Exponential): Fast-reacting. Good for scalping.
* SMA (Simple): Standard trend lines. Good for position trading.
* LWMA (Linear Weighted): Focuses heavily on recent data.
* Configuration: You can select specific setups like "Scalping" (9/21/50 EMA) or "Trend" (50/200 EMA).
**C. Momentum Filters**
* MACD: Checks momentum. You can choose settings for Scalping, Day Trading, or Swing Trading.
* AO (Awesome Oscillator) & AC: Helps confirm if the momentum is strong enough to support the trend.
---
**3. Visual Guide: What You See on the Chart**
* Green Box: A Buy Zone (Demand).
* Red Box: A Sell Zone (Supply).
* Labels (Text): Shows "BUY" or "SELL" with exact prices for TP1, TP2, TP3, and SL.
* Blue Lines: The Bollinger Bands (Upper and Lower).
* Orange Line: The Bollinger Band Basis (Middle).
* Small Triangles:
* Green Triangle (Below Bar): Price touched the Lower Bollinger Band.
* Red Triangle (Above Bar): Price touched the Upper Bollinger Band.
* Yellow Background: **WARNING.** The market has low volume/volatility (BB Squeeze). Wait for a breakout.
---
4. How to Use This Script
1. Select Your Style: Go to the Settings (Inputs).
* If you are a **Scalper**, turn on "Scalping EMA" or "Scalping MACD".
* If you are a **Swing Trader**, turn on "Swing SMA" or "Trend EMA".
2. Configure Bollinger Bands: Keep `Use Bollinger Bands Filter` checked. Decide if you want to trade "Squeezes" (usually safer to avoid them).
3. Wait for the Label: Do not enter blindly. Wait for the script to print a **BUY** or **SELL** label with the TP/SL targets.
4. Check the Background: If the background is **Yellow**, ignore the signal or wait until the color clears.
5. Manage Risk: Place your Stop Loss at the price shown on the label ("SL").

VWAP-Anchored MACD [BOSWaves]VWAP-Anchored MACD - Volume-Weighted Momentum Mapping With Zero-Line Filtering
Overview
The VWAP-Anchored MACD delivers a refined momentum model built on volume-weighted price rather than raw closes, giving you a more grounded view of trend strength during sessions, weeks, or months.
Instead of tracking two EMAs of price like a standard MACD, this tool reconstructs the MACD engine using anchored VWAP as the core input. The result is a momentum structure that reacts to real liquidity flow, filters out weak crossovers near the zero line, and visualizes acceleration shifts with clear, high-contrast gradients.
This indicator acts as a precise momentum map that adapts in real time. You see how weighted price is accelerating, where valid crossovers form, and when trend conviction is strong enough to justify execution.
It uses gradient line coloring to show bullish or bearish momentum, histogram shading to highlight energy shifts, cross dots to mark valid crossovers, optional buy/sell diamonds for execution cues, and candle coloring to display trend strength at a glance.
Theoretical Foundation
Traditional MACD compares the difference between two exponential moving averages of price.
This variant replaces price with anchored VWAP, making the calculation sensitive to actual traded volume across your chosen period (Session, Week, or Month).
Three principles drive the logic:
Anchored VWAP Momentum : Price is weighted by volume and aggregated across the selected anchor. The fast and slow VWAP-EMAs then expose how liquidity-corrected momentum is expanding or contracting.
Zero-Line Distance Filtering : Crossover signals that occur too close to the zero line are removed. This eliminates the common MACD problem of generating weak, directionless signals in choppy phases.
Directional Visualization : MACD line, signal line, histogram, candle colors, and optional diamond markers all react to shifts in VWAP-momentum, giving you a clean structural read on market pressure.
Anchoring VWAP to session, weekly, or monthly resets creates a systematic framework for tracking how capital flow is driving momentum throughout each trading cycle.
How It Works
The core engine processes momentum through several mapped layers:
VWAP Aggregation : Price × volume is accumulated until the anchor resets. This creates a continuous, liquidity-corrected VWAP curve.
MACD Construction : Fast and slow VWAP-EMAs define the MACD line, while a smoothed signal line identifies edges where momentum shifts.
Zero-Line Distance Filter : MACD and signal must both exceed a threshold distance from zero for a crossover to count as valid. This prevents fake crossovers during compression.
Visual Momentum Layers : It uses gradient line coloring to show bullish or bearish momentum, histogram shading to highlight energy shifts, cross dots to mark valid crossovers, optional buy/sell diamonds for execution cues, and candle coloring to display trend strength at a glance.
This layered structure ensures you always know whether momentum is strengthening, fading, or transitioning.
Interpretation
You get a clean, structural understanding of VWAP-based momentum:
Bullish Phases : MACD > Signal, histogram expands, candles turn bullish, and crossovers occur above the threshold.
Bearish Phases : MACD < Signal, histogram drives lower, candles shift bearish, and downward crossovers trigger below the threshold.
Neutral/Compression : Both lines remain near the zero boundary, histogram flattens, and signals are suppressed to avoid noise.
This creates a more disciplined version of MACD momentum reading - less noise, more conviction, and better alignment with liquidity.
Strategy Integration
Trend Continuation : Use VWAP-MACD crossovers that occur far from the zero line as higher-conviction entries.
Zero-Line Rejection : Watch for histogram contractions near zero to anticipate flattening momentum and potential reversal setups.
Session/Week/Month Anchors : Session anchor works best for intraday flows. Weekly or monthly anchor structures create cleaner macro momentum reads for swing trading.
Signal-Only Execution : Optional buy/sell diamonds give you direct points to trigger trades without overanalyzing the chart.
This indicator slots cleanly into any momentum-following system and offers higher signal quality than classic MACD variants due to the volume-weighted core.
Technical Implementation Details
VWAP Reset Logic : Session (D), Week (W), or Month (M)
Dynamic Fast/Slow VWAP EMAs : Fully configurable lengths, smoothing and anchor settings
MACD/Signal Line Framework : Traditional structure with volume-anchored input
Zero-Line Filtering : Adjustable threshold for structural confirmation
Dual Visualization Layers : MACD body + histogram + crosses + candle coloring
Optimized Performance : Lightweight, fast rendering across all timeframes
Optimal Application Parameters
Timeframes:
1- 15 min : Short-term momentum scalping and rapid trend shifts
30- 240 min : Balanced momentum mapping with clear structural filtering
Daily : Macro VWAP regime identification
Suggested Configuration:
Fast Length : 12
Slow Length : 26
Signal Length : 9
Zero Threshold : 200 - 500 depending on asset range
These suggested parameters should be used as a baseline; their effectiveness depends on the asset volatility, liquidity, and preferred entry frequency, so fine-tuning is expected for optimal performance.
Performance Characteristics
High Effectiveness:
Assets with strong intraday or session-based volume cycles
Markets where volume-weighted momentum leads price swings
Trend environments with strong acceleration
Reduced Effectiveness:
Ultra-choppy markets hugging the VWAP axis
Sessions with abnormally low volume
Ranges where MACD naturally compresses
Disclaimer
The VWAP-Anchored MACD is a structural momentum tool designed to enhance directional clarity - not a guaranteed predictor. Performance depends on market regime, volatility, and disciplined execution. Use it alongside broader trend, volume, and structural analysis for optimal results.

Supertrend + MACD + HMAIndicator Description: Supertrend + MACD + HMA
General Summary
It is a composite technical indicator that combines three analysis tools to generate buy and sell signals in institutional trading. It uses confirmation from multiple indicators to increase the precision of market entries.
Components
1. Supertrend (ST)
Function: Identifies the main market trend (bullish or bearish)
Parameters: ATR Length 10, Factor 3.0
Visualization:
Green line = Bullish trend
Red line = Bearish trend
Semi-transparent green/red background that fills the area according to direction
How it works: Uses ATR (Average True Range) to calculate dynamic support and resistance bands
2. MACD (Moving Average Convergence Divergence)
Function: Measures price momentum and direction
Parameters: Fast 18, Slow 144, Signal Smoothing 9
Components:
MACD Line (orange): Difference between two EMAs
Signal Line (purple): EMA of the MACD
Histogram (green/red columns): Difference between MACD and its signal
Green = Positive histogram (bullish momentum)
Red = Negative histogram (bearish momentum)
3. HMA 100 (Hull Moving Average)
Function: Identifies support/resistance level and price direction
Parameters: Length 100
Visualization: Blue thick line
Characteristics:
Less lag than traditional moving averages
Price > HMA = Bullish trend
Price < HMA = Bearish trend
Signal Logic
🟢 BUY SIGNAL
Generated when ANY of these conditions is met:
Total Confluence:
MACD positive (histogram > 0)
Price above HMA 100
Supertrend in Bullish mode
Supertrend Change:
Supertrend changes from Bearish to Bullish
MACD remains positive
Price above HMA
Price Crossover:
Price crosses above HMA (at candle close)
Supertrend is in Bullish mode
MACD is positive
🔴 SELL SIGNAL
Generated when ANY of these conditions is met:
Total Confluence:
MACD negative (histogram < 0)
Price below HMA 100
Supertrend in Bearish mode
Supertrend Change:
Supertrend changes from Bullish to Bearish
MACD remains negative
Price Crossover:
Price crosses below HMA (at candle close)
Supertrend is in Bearish mode
MACD is negative
Important Features
✅ Single Signal Per Type
Once a BUY is generated, no other BUY is generated until a SELL appears
Avoids multiple entries in the same direction
✅ Crossover Detection
The indicator generates signals at candle close when price crosses HMA
Allows capturing quick market moves
✅ Trend Changes
Detects when Supertrend changes direction
Provides early exits from the market
✅ Automatic Alerts
Push notifications when BUY or SELL is generated
Ideal for automated trading

Sk Macd TrendSk Macd Trend + Hidden Bullish MACD Divergence (Enhanced)
Original Author: Sujeetjeet1705
Enhanced by: Community Contribution (MACD-style Hidden Bullish Signal)
A powerful and widely respected WaveTrend-based oscillator with all the original premium features intact:
• Laguerre-smoothed WaveTrend (WT1 & WT2)
• Professional 4-color momentum histogram (strong/weak bull & bear)
• Filled MACD/Signal area for instant trend bias
• Built-in regular + hidden divergences (signal & histogram)
• Smart trailing stop system with ATR-based dynamic stops
• Clean buy/sell cross signals with overbought/oversold filtering
NEW POWERFUL ADDITION:
Hidden Bullish MACD-Style Divergence Detector
(Exactly like institutional MACD hidden bullish setups)
The indicator now highlights — with a bright blue histogram bar and a blue square below the price candle — when ALL three high-probability conditions are met simultaneously:
1. WaveTrend Histogram (wt3) is below zero (still in bearish territory)
2. Histogram is rising (wt3 > wt3 ) → momentum turning up
3. Price makes a higher low (low > low ) → bullish hidden divergence
This is one of the strongest early-reversal signals in technical analysis and often marks the exact bottom before explosive bounces.
Key Features:
• Blue square appears directly on the main chart (overlay)
• Histogram turns solid blue only on valid setups (very easy to spot)
• No repainting — 100% real-time reliable
• Works perfectly on all timeframes and assets
• All original features, colors, and logic preserved
Perfect for swing traders, reversal hunters, and anyone looking to catch major turns early.
Use with confidence — this is now one of the most complete and visually intuitive WaveTrend oscillators available on TradingView.
Enjoy the edge!

FTPM - Institutional Trend Pressure Suite @darshaksscThis indicator provides an informational view of market trend pressure using fractal-based momentum events, smoothed pressure calculations, higher timeframe confirmation, and divergence analysis. It does not produce buy or sell signals. Instead, it presents market context to help traders interpret trend conditions in a structured and data-driven way.
The indicator includes the following components:
1). Non-repainting Trend Pressure Engine
The pressure line is derived from confirmed fractal events, body-to-range ratios, displacement strength, and a controlled decay factor. The value is normalized to a 0 to 100 scale. A rising pressure value suggests increasing trend strength, while a declining value indicates weakening strength. This is informational only.
2). Pressure Shifts
The tool highlights transitions where pressure crosses above or below key thresholds. These labels do not represent entries or exits, but simply indicate contextual changes in momentum.
3). Higher Timeframe Pressure Confirmation
Users can compare current timeframe pressure to a selected higher timeframe. When both pressures align in similar regions, it may indicate agreement in broader market structure. This feature is informational only and does not generate trading signals.
4). Divergence Detection
Identifies confirmed bullish or bearish divergences between price pivots and pressure pivots. Divergences are simply analytical tools and should not be interpreted as actionable trading signals.
5). Institutional Dashboard
A multi-line dashboard summarizes current pressure, regime classification, higher timeframe regime, pressure direction, divergence status, and alignment conditions. The dashboard is informational only. No part of the dashboard should be interpreted as a trade instruction.
6). Dashboard Size Selector
Users may switch between Full, Medium, or Thin dashboard layouts to match their screen preferences. This affects only display, not indicator logic.
Important Notes
This indicator does not forecast future price movement.
It does not generate buy, sell, long, or short signals.
It does not guarantee profitable outcomes.
It is intended purely for visual analysis and market context.
All information is derived from confirmed historical data.
No part of this script is designed to automate trading decisions.
This tool is suitable for traders who want a clear, non-repainting visualization of pressure conditions and structural behavior without violating TradingView House Rules.
======================================================================
HOW TO USE
The indicator helps traders observe whether pressure is increasing or decreasing, whether higher timeframe conditions agree with the current chart, and whether divergences are present. All outputs are informational and should be combined with the user's preferred strategy or manual analysis. The indicator is not intended to signal trades or provide recommendations.
======================================================================
DISCLAIMERS
This indicator is for educational and informational purposes only.
It does not constitute financial advice.
It does not provide buy, sell, long, or short signals.
It does not predict future price movement.
Past performance does not guarantee future results.
======================================================================

KENW Liq Sweep 17This indicator is designed to alert on potential liquidity sweep events:
- In uptrends, it tracks Sell-Side Liquidity (SSL) by marking swing lows that occur during negative MACD histogram periods. It generates a long entry alert when price makes a lower low in SSL (i.e., the most recent SSL level is below the prior one), suggesting a sweep of sell-side liquidity before a potential bullish continuation.
- In downtrends, it tracks Buy-Side Liquidity (BSL) by marking swing highs that occur during positive MACD histogram periods. It generates a short entry alert when price makes a higher high in BSL (i.e., the most recent BSL level is above the prior one), indicating a sweep of buy-side liquidity before a potential bearish continuation.

MACD_RDMACD_RD - Moving Average Convergence Divergence (Ryan DeBraal)
This indicator plots a standard MACD along with a color-adaptive histogram and
integrated momentum-shift alerts. It preserves the normal MACD structure while
improving visual clarity and signal recognition.
FEATURES
-----------------------------------------------------------------------------
• Standard MACD Calculation
- Fast MA (12 by default)
- Slow MA (26)
- Signal line (9)
- Choice between SMA/EMA for both MACD and Signal smoothing
• Color-Changing Histogram
- Green shades for positive momentum
- Red shades for negative momentum
- Lighter/darker tones depending on whether momentum is increasing or fading
- 50% opacity for improved readability
• Crossover-Based MACD Line Coloring
- MACD line turns green on bullish cross (MACD > Signal)
- MACD line turns red on bearish cross (MACD < Signal)
- Default blue when no crossover occurs
• Momentum-Shift Alerts
- Alerts when histogram flips direction
PURPOSE
-----------------------------------------------------------------------------
This MACD version emphasizes momentum shifts and trend transitions by
highlighting subtle histogram changes and providing clean crossover visuals.
Ideal for:
• Identifying early momentum reversals
• Filtering breakout/trend setups
• Confirming trend continuation vs exhaustion

Nova Trades | Opening Range IndicatorNova Trades | Opening Range With Confluences
Overview
The Nova Trades ORB Simple indicator is a clean, educational implementation of Opening Range Breakout (ORB) methodology combined with Exponential Moving Average (EMA) trend filtering. This script is designed to help traders visualize market structure during the critical opening session and identify high-probability breakout opportunities.
What Makes This Implementation Unique
1. Real-Time Dynamic ORB Tracking
Unlike static ORB indicators that plot fixed levels, this script:
Updates ORB high/low levels in real-time during the opening range period
Dynamically adjusts line positions as new highs/lows form within the ORB window
Uses line.set_y1() and line.set_y2() to provide smooth, live updates without cluttering the chart
Automatically extends ORB levels into the future for easy visual reference
2. Integrated Status Dashboard
The script includes a comprehensive real-time status table that shows:
Current ORB period status (ACTIVE vs COMPLETE)
Calculated ORB range size (useful for volatility assessment)
Current price position relative to ORB levels (ABOVE/BELOW/INSIDE)
Price position relative to EMA (trend context)
First breakout direction detection (BULLISH/BEARISH/PENDING)
This dashboard eliminates the need to manually assess market conditions and provides instant decision-making information.
3. Breakout Detection Logic
The script employs a first-breakout-only tracking system that:
Waits for the ORB period to complete before flagging breakouts
Records only the first directional break after ORB completion
Prevents false signals from intraday price whipsaws
Maintains breakout status throughout the trading session for consistency
4. EMA Confluence Filter
While many ORB scripts exist and EMA is a standard indicator, this script's value lies in how they work together:
Trading Edge: The combination provides a two-factor confirmation system:
ORB Breakout = Short-term momentum shift (microstructure)
EMA Position = Intermediate trend alignment (macrostructure)
Why This Matters:
ORB breakouts above ORB high + price above EMA = Aligned bullish momentum (highest probability long setups)
ORB breakouts below ORB low + price below EMA = Aligned bearish momentum (highest probability short setups)
Conflicting signals (e.g., ORB breakout up but price below EMA) = Lower probability, potential reversal zones
5. Customizable Time Periods
Supports multiple ORB timeframes (5m, 15m, 30m, 45m, 60m) because:
Different securities have different volatility profiles
Intraday traders may prefer shorter ORB periods (5-15m)
Position traders may prefer longer ORB periods (45-60m)
Allows optimization for specific trading styles and instruments
6. Clean Visual Design
Market open line clearly marks session start
Color-coded ORB levels (customizable) for instant visual recognition
Minimal chart clutter with toggle options for each component
Data window plots for programmatic strategy access
How It Works
Opening Range Breakout (ORB) Calculation
Initialization: At 9:30 AM NY time (market open), the script begins tracking
Range Formation: During the selected timeframe (default 30 minutes):
Continuously updates the highest high → ORB High
Continuously updates the lowest low → ORB Low
Range Completion: After the ORB period ends, levels are locked
Breakout Detection: Price breaking above ORB High (bullish) or below ORB Low (bearish) triggers the breakout flag
EMA Trend Filter
Calculates exponential moving average (default 50-period, customizable 1-500)
Provides trend context: Price > EMA = uptrend, Price < EMA = downtrend
Acts as dynamic support/resistance level
Combined Strategy Logic
Why Open Source?
This script is published as open source to:
Provide educational value to the trading community
Demonstrate clean coding practices for ORB implementations
Allow traders to customize and adapt to their specific needs
Serve as a foundation for more complex strategy development
The code uses standard Pine Script functions (ta.ema(), line.new(), table.new()) intentionally to maintain transparency and educational value.
Disclaimer
This indicator is for educational and informational purposes. It does not constitute financial advice. Past performance does not guarantee future results. Always practice proper risk management.

MACD Momentum Structure & Volume Profile Sniper [MTF]**Description and Methodology**
This script offers a unique approach to Market Structure by moving away from traditional fractal-based highs and lows (which can be noisy). Instead, it utilizes **MACD Momentum Swings** to identify significant structural points, combined with an automated Fixed Range Volume Profile to pinpoint high-probability entry zones.
**1. Why MACD Structure? (The Core Concept)**
Traditional "ZigZag" or Fractal indicators rely solely on price action, often leading to fake-outs during low-volume consolidation.
* This script defines a "Swing High" only when the MACD Histogram crosses below zero (Momentum shifts Bearish).
* This script defines a "Swing Low" only when MACD crosses above zero (Momentum shifts Bullish).
By linking structure to momentum, we filter out weak price movements and focus on the true "heartbeat" of the trend.
**2. The "Mashup" Synergy: Structure + Volume + Logic**
This is not a random combination of indicators. Each component serves a specific step in the trading execution sequence:
* **Step 1 (Structure):** The script identifies a Change of Character (CHoCH) based on the MACD peaks described above.
* **Step 2 (Liquidity/Value):** When a CHoCH occurs, the script *automatically* draws a **Fixed Range Volume Profile (FRVP)** specifically covering the impulse leg that caused the break. This reveals the "Point of Control" (POC)—the hidden price level where the most volume occurred during the move.
* **Step 3 (The Sniper Entry):** The script creates a "Zone" around that POC. It then waits for Price to retrace into this zone.
* **Step 4 (Confirmation):** Once the zone is touched, the script monitors a lower timeframe (User selectable, default M1) for a fresh MACD crossover to trigger the final entry signal.
**Features**
* **Multi-Timeframe Dashboard:** Monitor the MACD Trend direction across 4 different timeframes simultaneously.
* **Dynamic Trendlines:** Automatically connects confirmed MACD peaks to visualize trend integrity.
* **Fibo Time Zones:** Projects potential future pivot points based on the duration of the previous swing.
* **Alert System:** Integrated alerts for Zone Touches and "Sniper" entries (Zone Touch + LTF Momentum Confirmation).
**How to Use**
1. **Identify Trend:** Look for the CHoCH labels. Green indicates a shift to Bullish, Red to Bearish.
2. **Wait for Pullback:** Do not chase the break. Wait for price to return to the Yellow POC Zone generated by the Volume Profile.
3. **Entry Trigger:** Watch for the "BUY" or "SELL" marks. These appear only when price hits the zone AND the lower-timeframe momentum aligns with the trade direction.
**Settings & Inputs**
* **Global MACD:** Adjust the sensitivity of the swing detection (Default 12, 26, 9).
* **Sniper Entry:** Select the timeframe used for the final confirmation (e.g., use M1 confirmation for an H1 chart structure).
* **VP Settings:** Customize how the Volume Profile looks on the chart.
*Disclaimer: This script is intended for educational purposes and market analysis. It does not provide financial advice.*

MACD Forecast Colorful [DiFlip]MACD Forecast Colorful
The Future of Predictive MACD — is one of the most advanced and customizable MACD indicators ever published on TradingView. Built on the classic MACD foundation, this upgraded version integrates statistical forecasting through linear regression to anticipate future movements — not just react to the past.
With a total of 22 fully configurable long and short entry conditions, visual enhancements, and full automation support, this indicator is designed for serious traders seeking an analytical edge.
⯁ Real-Time MACD Forecasting
For the first time, a public MACD script combines the classic structure of MACD with predictive analytics powered by linear regression. Instead of simply responding to current values, this tool projects the MACD line, signal line, and histogram n bars into the future, allowing you to trade with foresight rather than hindsight.
⯁ Fully Customizable
This indicator is built for flexibility. It includes 22 entry conditions, all of which are fully configurable. Each condition can be turned on/off, chained using AND/OR logic, and adapted to your trading model.
Whether you're building a rules-based quant system, automating alerts, or refining discretionary signals, MACD Forecast Colorful gives you full control over how signals are generated, displayed, and triggered.
⯁ With MACD Forecast Colorful, you can:
• Detect MACD crossovers before they happen.
• Anticipate trend reversals with greater precision.
• React earlier than traditional indicators.
• Gain a powerful edge in both discretionary and automated strategies.
• This isn’t just smarter MACD — it’s predictive momentum intelligence.
⯁ Scientifically Powered by Linear Regression
MACD Forecast Colorful is the first public MACD indicator to apply least-squares predictive modeling to MACD behavior — effectively introducing machine learning logic into a time-tested tool.
It uses statistical regression to analyze historical behavior of the MACD and project future trajectories. The result is a forward-shifted MACD forecast that can detect upcoming crossovers and divergences before they appear on the chart.
⯁ Linear Regression: Technical Foundation
Linear regression is a statistical method that models the relationship between a dependent variable (y) and one or more independent variables (x). The basic formula for simple linear regression is:
y = β₀ + β₁x + ε
Where:
y = predicted variable (e.g., future MACD value)
x = independent variable (e.g., bar index)
β₀ = intercept
β₁ = slope
ε = random error (residual)
The regression model calculates β₀ and β₁ using the least squares method, minimizing the sum of squared prediction errors to produce the best-fit line through historical values. This line is then extended forward, generating a forecast based on recent price momentum.
⯁ Least Squares Estimation
The regression coefficients are computed with the following formulas:
β₁ = Σ((xᵢ - x̄)(yᵢ - ȳ)) / Σ((xᵢ - x̄)²)
β₀ = ȳ - β₁x̄
Where:
Σ denotes summation; x̄ and ȳ are the means of x and y; and i ranges from 1 to n (number of observations). These equations produce the best linear unbiased estimator under the Gauss–Markov assumptions — constant variance (homoscedasticity) and a linear relationship between variables.
⯁ Regression in Machine Learning
Linear regression is a foundational model in supervised learning. Its ability to provide precise, explainable, and fast forecasts makes it critical in AI systems and quantitative analysis.
Applying linear regression to MACD forecasting is the equivalent of injecting artificial intelligence into one of the most widely used momentum tools in trading.
⯁ Visual Interpretation
Picture the MACD values over time like this:
Time →
MACD →
A regression line is fitted to recent MACD values, then projected forward n periods. The result is a predictive trajectory that can cross over the real MACD or signal line — offering an early-warning system for trend shifts and momentum changes.
The indicator plots both current MACD and forecasted MACD, allowing you to visually compare short-term future behavior against historical movement.
⯁ Scientific Concepts Used
Linear Regression: models the relationship between variables using a straight line.
Least Squares Method: minimizes squared prediction errors for best-fit.
Time-Series Forecasting: projects future data based on past patterns.
Supervised Learning: predictive modeling using labeled inputs.
Statistical Smoothing: filters noise to highlight trends.
⯁ Why This Indicator Is Revolutionary
First open-source MACD with real-time predictive modeling.
Scientifically grounded with linear regression logic.
Automatable through TradingView alerts and bots.
Smart signal generation using forecasted crossovers.
Highly customizable with 22 buy/sell conditions.
Enhanced visuals with background (bgcolor) and area fill (fill) support.
This isn’t just an update — it’s the next evolution of MACD forecasting.
⯁ Example of simple linear regression with one independent variable
This example demonstrates how a basic linear regression works when there is only one independent variable influencing the dependent variable. This type of model is used to identify a direct relationship between two variables.
⯁ In linear regression, observations (red) are considered the result of random deviations (green) from an underlying relationship (blue) between a dependent variable (y) and an independent variable (x)
This concept illustrates that sampled data points rarely align perfectly with the true trend line. Instead, each observed point represents the combination of the true underlying relationship and a random error component.
⯁ Visualizing heteroscedasticity in a scatterplot with 100 random fitted values using Matlab
Heteroscedasticity occurs when the variance of the errors is not constant across the range of fitted values. This visualization highlights how the spread of data can change unpredictably, which is an important factor in evaluating the validity of regression models.
⯁ The datasets in Anscombe’s quartet were designed to have nearly the same linear regression line (as well as nearly identical means, standard deviations, and correlations) but look very different when plotted
This classic example shows that summary statistics alone can be misleading. Even with identical numerical metrics, the datasets display completely different patterns, emphasizing the importance of visual inspection when interpreting a model.
⯁ Result of fitting a set of data points with a quadratic function
This example illustrates how a second-degree polynomial model can better fit certain datasets that do not follow a linear trend. The resulting curve reflects the true shape of the data more accurately than a straight line.
⯁ What is the MACD?
The Moving Average Convergence Divergence (MACD) is a technical analysis indicator developed by Gerald Appel. It measures the relationship between two moving averages of a security’s price to identify changes in momentum, direction, and strength of a trend. The MACD is composed of three components: the MACD line, the signal line, and the histogram.
⯁ How to use the MACD?
The MACD is calculated by subtracting the 26-period Exponential Moving Average (EMA) from the 12-period EMA. A 9-period EMA of the MACD line, called the signal line, is then plotted on top of the MACD line. The MACD histogram represents the difference between the MACD line and the signal line.
Here are the primary signals generated by the MACD:
• Bullish Crossover: When the MACD line crosses above the signal line, indicating a potential buy signal.
• Bearish Crossover: When the MACD line crosses below the signal line, indicating a potential sell signal.
• Divergence: When the price of the security diverges from the MACD, suggesting a potential reversal.
• Overbought/Oversold Conditions: Indicated by the MACD line moving far away from the signal line, though this is less common than in oscillators like the RSI.
⯁ How to use MACD forecast?
The MACD Forecast is built on the same foundation as the classic MACD, but with predictive capabilities.
Step 1 — Spot Predicted Crossovers:
Watch for forecasted bullish or bearish crossovers. These signals anticipate when the MACD line will cross the signal line in the future, letting you prepare trades before the move.
Step 2 — Confirm with Histogram Projection:
Use the projected histogram to validate momentum direction. A rising histogram signals strengthening bullish momentum, while a falling projection points to weakening or bearish conditions.
Step 3 — Combine with Multi-Timeframe Analysis:
Use forecasts across multiple timeframes to confirm signal strength (e.g., a 1h forecast aligned with a 4h forecast).
Step 4 — Set Entry Conditions & Automation:
Customize your buy/sell rules with the 20 forecast-based conditions and enable automation for bots or alerts.
Step 5 — Trade Ahead of the Market:
By preparing for future momentum shifts instead of reacting to the past, you’ll always stay one step ahead of lagging traders.
📈 BUY
🍟 Signal Validity: The signal will remain valid for X bars.
🍟 Signal Sequence: Configurable as AND or OR.
🍟 MACD > Signal Smoothing
🍟 MACD < Signal Smoothing
🍟 Histogram > 0
🍟 Histogram < 0
🍟 Histogram Positive
🍟 Histogram Negative
🍟 MACD > 0
🍟 MACD < 0
🍟 Signal > 0
🍟 Signal < 0
🍟 MACD > Histogram
🍟 MACD < Histogram
🍟 Signal > Histogram
🍟 Signal < Histogram
🍟 MACD (Crossover) Signal
🍟 MACD (Crossunder) Signal
🍟 MACD (Crossover) 0
🍟 MACD (Crossunder) 0
🍟 Signal (Crossover) 0
🍟 Signal (Crossunder) 0
🔮 MACD (Crossover) Signal Forecast
🔮 MACD (Crossunder) Signal Forecast
📉 SELL
🍟 Signal Validity: The signal will remain valid for X bars.
🍟 Signal Sequence: Configurable as AND or OR.
🍟 MACD > Signal Smoothing
🍟 MACD < Signal Smoothing
🍟 Histogram > 0
🍟 Histogram < 0
🍟 Histogram Positive
🍟 Histogram Negative
🍟 MACD > 0
🍟 MACD < 0
🍟 Signal > 0
🍟 Signal < 0
🍟 MACD > Histogram
🍟 MACD < Histogram
🍟 Signal > Histogram
🍟 Signal < Histogram
🍟 MACD (Crossover) Signal
🍟 MACD (Crossunder) Signal
🍟 MACD (Crossover) 0
🍟 MACD (Crossunder) 0
🍟 Signal (Crossover) 0
🍟 Signal (Crossunder) 0
🔮 MACD (Crossover) Signal Forecast
🔮 MACD (Crossunder) Signal Forecast
🤖 Automation
All BUY and SELL conditions can be automated using TradingView alerts. Every configurable condition can trigger alerts suitable for fully automated or semi-automated strategies.
⯁ Unique Features
Linear Regression: (Forecast)
Signal Validity: The signal will remain valid for X bars
Signal Sequence: Configurable as AND/OR
Table of Conditions: BUY/SELL
Conditions Label: BUY/SELL
Plot Labels in the graph above: BUY/SELL
Automate & Monitor Signals/Alerts: BUY/SELL
Background Colors: "bgcolor"
Background Colors: "fill"
Linear Regression (Forecast)
Signal Validity: The signal will remain valid for X bars
Signal Sequence: Configurable as AND/OR
Table of Conditions: BUY/SELL
Conditions Label: BUY/SELL
Plot Labels in the graph above: BUY/SELL
Automate & Monitor Signals/Alerts: BUY/SELL
Background Colors: "bgcolor"
Background Colors: "fill"

REMS - Deep SynergyThis is a more flexible version of the REMS Synergy indicator. Like other indicators in the REMS family, it builds upon the foundations assessing the relationships between RSI, EMAs, MACDs, and Stochastic RSI across multiple timeframes. Designed to help traders identify less frequent, but high probability entries across 2 time frames. Uses 3 levels of confluence indicators for both long and short moves.
Features 3 levels of confluence across 2 timeframes. All 3 levels allow filtering of any combination of REMS filters. Features more options and customization than previous REMS Synergy.
Includes VWAP and 4 EMAs as optional visual representations.
Includes 'Enhanced Candles' than can colour code candlesticks for better visual identification. (off by default)
Originally designed with 5 minute and 2 minute timeframes in mind, and pairs well with REMS First Strike and/or REMS Snap Shot indicators.
This version features no hard-coded inputs and allows for more freedom than previous version. With the added flexibility comes the ability for the indicator to be more easily stacked.

Renko ScalperWhat it is-
A lightweight Renko Scalper that combines Renko brick direction with an internal EMA trend filter and MACD confirmation to signal high-probability short-term entries. EMAs are used internally (hidden from the chart) so the visual remains uncluttered.
Signals-
Buy arrow: Renko direction turns bullish AND EMA trend up AND MACD histogram positive.
Sell arrow: Renko direction turns bearish AND EMA trend down AND MACD histogram negative.
Consecutive same-direction signals are suppressed (only one arrow per direction until opposite signal).
Visuals-
Buy / Sell arrows (large) above/below bars.
Chart background tints green/red after the respective signal for easy glance recognition.
Inputs:-
Renko Box Size (points)
EMA Fast / EMA Slow
MACD fast/slow/signal lengths
How to use-
Add to chart
Use smaller Renko box sizes for scalping, larger for swing-like entries.
Confirm signal with price action and volume—this indicator is a signal generator, not a full automated system.
Use alerts (built in) to receive Buy / Sell arrow notifications.
Alerts-
Buy Arrow — buySignal
Sell Arrow — sellSignal
Buy Background / Sell Background — background-color state alerts
Recommended settings-
Timeframes: 1m–15m for scalping, 5m for balanced intraday.
Symbols: liquid futures/currency pairs/major crypto.
Disclaimer
This script is educational and not financial advice. Backtest and forward test on a demo account before live use. Past performance is not indicative of future results. Use proper risk management.

NAKED NINJA DOUBLE MACD SUPER STOC HELL 3just eye ball it on charts and you will see how it all works dedicatated to an OG

Smart MACD Divergence ScannerOriginal Base Indicator: "CM_MacD_Ult_MTF" by ChrisMoody
This indicator builds upon ChrisMoody's excellent multi-timeframe MACD foundation and transforms it into a professional divergence scanner with advanced quality assessment and filtering capabilities. The original MACD visualization and MTF functionality have been preserved while adding completely new divergence detection, scoring, and filtering systems.
🎯 What Makes This Indicator Unique:
Smart MACD Divergence Scanner is a professional tool for detecting MACD-based divergences with an advanced filtering system and signal quality assessment. Unlike standard divergence indicators, this version includes innovative features:
Adaptive Quality Scoring System — each signal receives a score from 0 to 100 based on multiple factors
Volatility Filter — automatic signal suppression during low market volatility periods
Multi-Timeframe Confirmation — divergence verification on higher timeframe for increased reliability
Divergence Strength Analysis — calculation of percentage difference between price and indicator movement
Information Dashboard — detailed real-time signal statistics
Cooldown System — prevention of multiple consecutive signals
💡 How It Works:
The indicator uses the classic divergence concept — the divergence between price movement and the MACD oscillator. However, instead of simple pivot detection, the algorithm:
Scans the market for local extremes (pivots) on price and MACD histogram
Searches for divergences — when price updates low/high while MACD shows opposite movement
Assesses quality — analyzes divergence strength, volatility, higher timeframe confirmation
Filters noise — eliminates weak signals through threshold system and cooldown
Generates signal — only when all quality criteria are met
🔧 Key Parameters:
MACD Settings: Fast Length (12), Slow Length (26), Signal Length (9)
Divergence Detection: Pivot Lookback (5), Max Lookback Range (60), Min Divergence Strength (15%)
Quality Filters: Min Quality Score (60), Volatility Filter, MTF Confirmation, Signal Cooldown (5)
📊 How to Use:
Add indicator to chart — it will automatically start scanning
Configure filters — start with default settings, then adapt to your trading style
Watch for signals: 🟢 Green "BUY" label = bullish divergence, 🔴 Red "SELL" label = bearish divergence
Check quality score on labels (Q: XX)
Use information panel to monitor statistics and current market conditions
⚙️ Settings Guide:
For swing trading (4H-Daily): Increase Pivot Lookback to 7-10, set Min Quality Score to 70+
For day trading (15m-1H): Keep default settings, enable all filters
For scalping (1m-5m): Decrease Min Quality Score to 50, disable MTF Confirmation
For volatile markets (crypto): Increase Min Divergence Strength to 20-25%, enable Volatility Filter
⚠️ Important Notes:
Divergences are probabilistic signals, not guaranteed reversals
Use additional confirmation (support/resistance levels, volume, price action)
Adjust parameters for specific asset and timeframe
Signals appear with Pivot Lookback bars delay (retrospective confirmation)
On volatile markets, increase Min Quality Score to reduce false signals

Divergence Scanner
Scanner and Indication (Divergence Scanner & Signal)An advanced experimental indicator designed to detect instances of Divergence between price action and key oscillator metrics (e.g., RSI or MACD).The primary function of this script is for Screener use. It plots a numerical value (a value greater than zero) on the chart when a confirmed bullish or bearish divergence signal appears."
