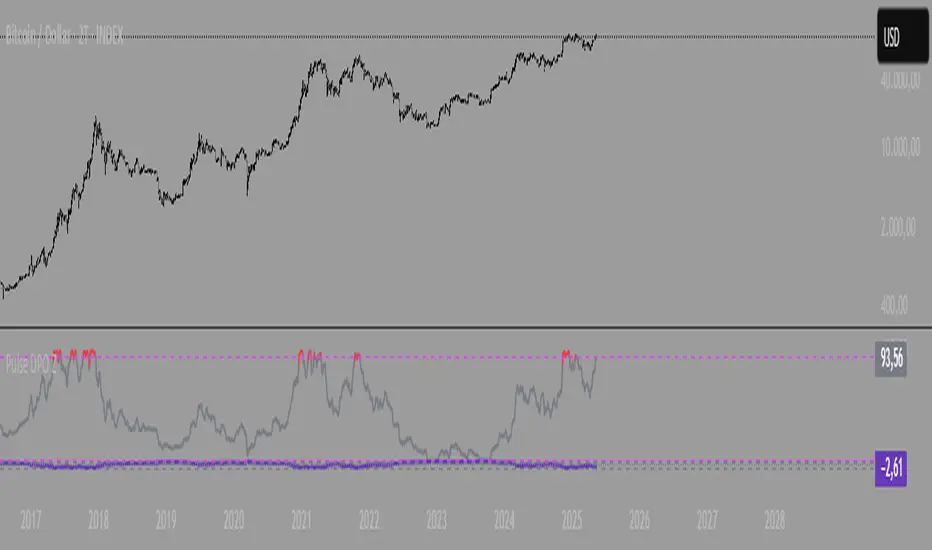
Disparity Index with Volatility ZonesDisparity Index with Volatility Zones
is a momentum oscillator that measures the percentage difference between the current price and its simple moving average (SMA). This allows traders to identify overbought/oversold conditions, assess momentum strength, and detect potential trend reversals or continuations.
🔍 Core Concept:
The Disparity Index (DI) is calculated as:
DI = 100 × (Price − SMA) / SMA
A positive DI indicates the price is trading above its moving average (potential bullish sentiment), while a negative DI suggests the price is below the average (potential bearish sentiment).
This version of the Disparity Index introduces a dual-zone volatility framework, offering deeper insight into the market's current state.
🧠 What Makes This Version Unique?
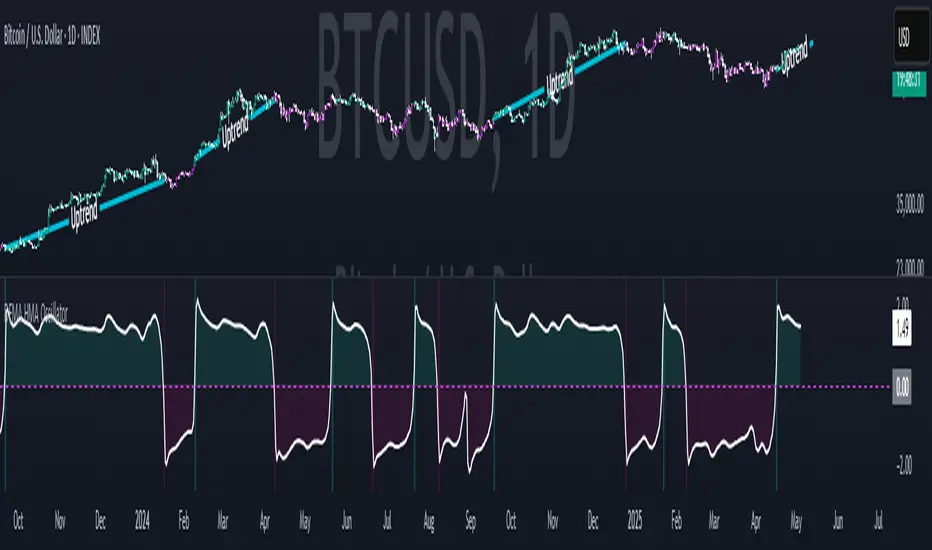
1. High Volatility Zones
When DI crosses above +1.0% or below –1.0%, it often indicates the start or continuation of a strong trend.
Sustained readings beyond these thresholds typically align with trending phases, offering opportunities for momentum-based entries.
A reversal back within ±1.0% after exceeding these levels can suggest a shift in momentum — similar to how RSI exits the overbought/oversold zones before reversals.
These thresholds act as dynamic markers for breakout confirmation and potential trend exhaustion.
2. Low Volatility Zones
DI values between –0.5% and +0.5% define the low-volatility zone, shaded for visual clarity.
This area typically indicates market indecision, sideways price action, or consolidation.
Trading within this range may favor range-bound or mean-reversion strategies, as trend momentum is likely limited.
The logic is similar to interpreting a flat ADX, tight Bollinger Bands, or contracting Keltner Channels — all suggesting consolidation.
⚙️ Features:
Customizable moving average length and input source
Adjustable thresholds for overbought/oversold and low-volatility zones
Optional visual fill between low-volatility bounds
Clean and minimal chart footprint (non-essential plots hidden by default)
📈 How to Use:
1. Trend Confirmation:
A break above +1.0% can be used as a bullish continuation signal.
A break below –1.0% may confirm bearish strength.
Long periods above/below these thresholds support trend-following entries.
2. Reversal Detection:
If DI returns below +1.0% after exceeding it, bullish momentum may be fading.
If DI rises above –1.0% after falling below, bearish pressure may be weakening.
These shifts resemble overbought/oversold transitions in oscillators like RSI or Stochastic, and can be paired with divergence, volume, or price structure analysis for higher reliability.
3. Sideways Market Detection:
DI values within ±0.5% indicate low volatility or a non-trending environment.
Traders may avoid breakout entries during these periods or apply range-trading tactics instead.
Observing transitions out of the low-volatility zone can help anticipate breakouts.
4. Combine with Other Indicators:
DI signals can be enhanced using tools like MACD, Volume Oscillators, or Moving Averages.
For example, a DI breakout beyond ±1.0% supported by a MACD crossover or volume spike can help validate trend initiation.
This indicator is especially powerful when paired with Bollinger Bands:
A simultaneous price breakout from the Bollinger Band and DI moving beyond ±1.0% can help identify early trend inflection points.
This combination supports entering positions early in a developing trend, improving the efficiency of trend-following strategies and enhancing decision-making precision.
It also helps filter false breakouts when DI fails to confirm the move outside the band.
This indicator is designed for educational and analytical purposes and works across all timeframes and asset classes.
It is particularly useful for traders seeking a clear framework to identify momentum strength, filter sideways markets, and improve entry timing within a larger trading system.
Wskaźnik Pine Script®