Least Median of Squares Regression | ymxbThe Least Median of Squares (LMedS) is a robust statistical method predominantly used in the context of regression analysis. This technique is designed to fit a model to a dataset in a way that is resistant to outliers. Developed as an alternative to more traditional methods like Ordinary Least Squares (OLS) regression, LMedS is distinguished by its focus on minimizing the median of the squares of the residuals rather than their mean. Residuals are the differences between observed and predicted values.
The key advantage of LMedS is its robustness against outliers. In contrast to methods that minimize the mean squared residuals, the median is less influenced by extreme values, making LMedS more reliable in datasets where outliers are present. This is particularly useful in linear regression, where it identifies the line that minimizes the median of the squared residuals, ensuring that the line is not overly influenced by anomalies.
STATISTICAL PROPERTIES
A critical feature of the LMedS method is its robustness, particularly its resilience to outliers. The method boasts a high breakdown point, which is a measure of an estimator's capacity to handle outliers. In the context of LMedS, this breakdown point is approximately 50%, indicating that it can tolerate corruption of up to half of the input data points without a significant degradation in accuracy. This robustness makes LMedS particularly valuable in real-world data analysis scenarios, where outliers are common and can severely skew the results of less robust methods.
Rousseeuw, Peter J.. “Least Median of Squares Regression.” Journal of the American Statistical Association 79 (1984): 871-880.
The LMedS estimator is also characterized by its equivariance under linear transformations of the response variable. This means that whether you transform the data first and then apply LMedS, or apply LMedS first and then transform the data, the end result remains consistent. However, it's important to note that LMedS is not equivariant under affine transformations of both the predictor and response variables.
ALGORITHM
The algorithm randomly selects pairs of points, calculates the slope (m) and intercept (b) of the line, and then evaluates the median squared deviation (mr2) from this line. The line minimizing this median squared deviation is considered the best fit.
DISCLAIMER
In the LMedS approach, a subset of the data is randomly selected to compute potential models (e.g., lines in linear regression). The method then evaluates these models based on the median of the squared residuals. Since the selection of data points is random, different runs may select different subsets, leading to variability in the computed models.
Regresja liniowa
ATR TrendTL;DR - An average true range (ATR) based trend
ATR trend uses a (customizable) ATR calculation and highest high & lowest low prices to calculate the actual trend. Basically it determines the trend direction by using highest high & lowest low and calculates (depending on the determined direction) the ATR trend by using a ATR based calculation and comparison method.
The indicator will draw one trendline by default. It is also possible to draw a second trendline which shows a 'negative trend'. This trendline is calculated the same way the primary trendline is calculated but uses a negative (-1 by default) value for the ATR calculation. This trendline can be used to detect early trend changes and/or micro trends.
How to use:
Due to its ATR nature the ATR trend will show trend changes by changing the trendline direction. This means that when the price crosses the trendline it does not automatically mean a trend change. However using the 'negative trend' option ATR trend can show early trend changes and therefore good entry points.
Some notes:
- A (confirmed) trend change is shown by a changing color and/or moving trendline (up/down)
- Unlike other indicators the 'time period' value is not the primary adjustment setting. This value is only used to calculate highest high & lowest low values and has medium impact on trend calculation. The primary adjustment setting is 'ATR weight'
- Every settings has a tooltip with further explanation
- I added additional color coding which uses a different color when the trend attempts to change but the trend change isn't confirmed (yet)
- Default values work fine (at least in my back testing) but the recommendation is to adjust the settings (especially ATR weight) to your trading style
- You can further finetune this indicator by using custom moving average types for the ATR calculation (like linear regression or Hull moving average)
- Both trendlines can be used to determine future support and resistance zones
- ATR trend can be used as a stop loss finder
- Alerts are using buy/sell signals
- You can use fancy color filling ;)
Happy trading!
Daniel

Divergence AnalyzerUnlock the potential of your trading strategy with the Divergence Analyzer, a sophisticated indicator designed to identify divergence patterns between two financial instruments. Whether you're a seasoned trader or just starting, this tool provides valuable insights into market trends and potential trading opportunities.
Key Features:
1. Versatility in Symbol Selection:
- Choose from a wide range of symbols for comparison, including popular indices like XAUUSD and SPX.
- Seamlessly toggle between symbols to analyze divergences and make informed trading decisions.
2. Flexible Calculation Options:
- Customizable options allow you to use a different symbol for calculation instead of the chart symbol.
- Fine-tune your analysis by selecting specific symbols for comparison based on your trading preferences.
3. Logarithmic Scale Analysis:
- Utilizes logarithmic scales for accurate representation of price movements.
- Linear regression coefficients are calculated on the logarithmic scale, providing a comprehensive view of trend strength.
4. Dynamic Length and Smoothing:
- Adjust the length parameter to adapt the indicator to different market conditions.
- Smoothed linear regression with exponential moving averages enhances clarity and reduces noise.
5. Standard Deviation Normalization:
- Normalizes standard deviations over 200 periods, offering a standardized view of price volatility.
- Easily compare volatility levels across different symbols for effective divergence analysis.
6. Color-Coded Divergence Visualization:
- Clearly distinguish positive and negative divergences with customizable color options.
- Visualize divergence deltas with an intuitive color scheme for quick and effective interpretation.
7. Symbol Information Table:
- An included table provides at-a-glance information about the selected symbols.
- Identify Symbol 1 and Symbol 2, along with their corresponding positive and negative divergence colors.
How to Use:
1. Select symbols for analysis using the user-friendly inputs.
2. Customize calculation options based on your preferences.
3. Analyze the divergence delta plot for clear visual indications.
4. Refer to the symbol information table for a quick overview of selected instruments.
Empower your trading strategy with the Divergence Analyzer and gain a competitive edge in the dynamic world of financial markets. Start making more informed decisions today!

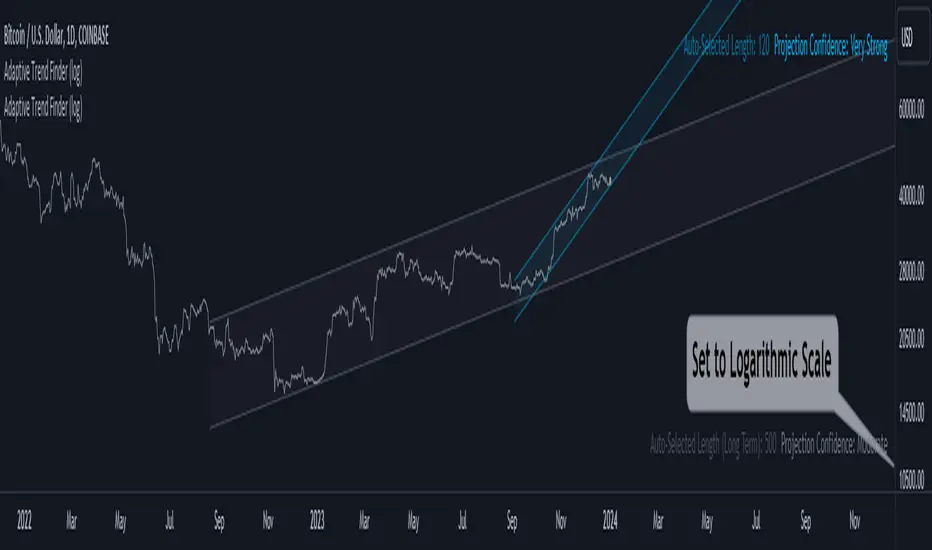
Adaptive Trend Finder (log)In the dynamic landscape of financial markets, the Adaptive Trend Finder (log) stands out as an example of precision and professionalism. This advanced tool, equipped with a unique feature, offers traders a sophisticated approach to market trend analysis: the choice between automatic detection of the long-term or short-term trend channel.
Key Features:
1. Choice Between Long-Term or Short-Term Trend Channel Detection: Positioned first, this distinctive feature of the Adaptive Trend Finder (log) allows traders to customize their analysis by choosing between the automatic detection of the long-term or short-term trend channel. This increased flexibility adapts to individual trading preferences and changing market conditions.
2. Autonomous Trend Channel Detection: Leveraging the robust statistical measure of the Pearson coefficient, the Adaptive Trend Finder (log) excels in autonomously locating the optimal trend channel. This data-driven approach ensures objective trend analysis, reducing subjective biases, and enhancing overall precision.
3. Precision of Logarithmic Scale: A distinctive characteristic of our indicator is its strategic use of the logarithmic scale for regression channels. This approach enables nuanced analysis of linear regression channels, capturing the subtleties of trends while accommodating variations in the amplitude of price movements.
4. Length and Strength Visualization: Traders gain a comprehensive view of the selected trend channel, with the revelation of its length and quantification of trend strength. These dual pieces of information empower traders to make informed decisions, providing insights into both the direction and intensity of the prevailing trend.
In the demanding universe of financial markets, the Adaptive Trend Finder (log) asserts itself as an essential tool for traders, offering an unparalleled combination of precision, professionalism, and customization. Highlighting the choice between automatic detection of the long-term or short-term trend channel in the first position, this indicator uniquely caters to the specific needs of each trader, ensuring informed decision-making in an ever-evolving financial environment.
EXOFADEEXOFADE is an incredible trading indicator designed help give traders a visual clue of price momentum by combining Linear regression calculations with volume.
Overview:
ExoFade is a unique and dynamic trading indicator designed for both beginner and professional traders. At its core, it uses a sophisticated blend of multiple linear regression analysis, incorporating price, time, and volume-weighted moving average (VWMA) to predict potential price movements. By analyzing these key factors, EXOFade offers an innovative approach to understanding market trends and identifying trade opportunities.
Why It Works:
ExoFade works by calculating a regression line that adapts to market conditions, factoring in both price trends and trading volumes. This approach provides a more nuanced view of market momentum, going beyond traditional price-only indicators. The inclusion of time as a variable offers unique insights into market dynamics, making ExoFade a valuable tool for various trading strategies.
Key Features to Look Out For:
Regression Line: The heart of ExoFade, offering visual cues about the market's direction.
ATR-Based Fade Levels: Utilizes Average True Range (ATR) to set dynamic levels that signal potential reversals or continuation. The indicator comes with three fade levels, which are described below
Alert Conditions: You can set up for alerts for when any of the fade levels have been been reached, indicating potential entry points.
What Are Fade Levels And How To Use The Enter Trades:
The exofade line always moves with price, this indicates that the current volume is moving in the same direction.
When you see the exofade start to move ahead of price. For example, in an Uptrend, if price stops making new highs and you see the exofade line continue moving up ahead of price as price stagnates, this is the first time that you should be expecting pull back or reversal. When the line starts to visibly curve, this when you want to enter the trade.
Sometimes, the exofade line will move just a little bit ahead of price, and sometimes it will move a clear distance ahead of price.
From my experience, the further ahead it moves from price without price keeping up, the higher the probability of a pullback or reversal.
The actual pullback then starts when the exofade line starts to curve, which signifies the start if the actual pullback.
Since we cannot sit and watch for when the line has either moved further ahead enough or started to curve, thats why i figured to use ATR as the best way to measure the distance the exofade line moves ahead of price and the ATR also happens to measure Volatility, which makes it a perfect match.
From forward testing this for months, i have found the pullbacks typically start when the exofade line has moved ahead of price by atleast 2 ATR's. A distance of 2 ATR and above are the ones i consider the best setups. This also marks the point for your stop loss, since 2 ATR is generally used stoploss level.
To catch and sell a pullback in an uptrend, you can set alert for one or both of these alerts
Fade Level 2 abv price - This alert will trigger once Exofade line reached 2 ATR ABOVE price (Just means it has reached 2 atr, dosent mean it has started curving yet)
Curve lvl 2 - SELL - This alert means the exofade line has started to curve at 2 ATR
To buy pullbacks in a downtrend you set the opposite alerts of the one above for curve below price
There are also same alerts for level 3 as well, which is 2.5 ATR
IMPORTANT NOTES - DONT SKIP THIS
For daily and intra-day swings - Use this on 1hr trend upwards - The exofade line much slower on higher timeframe, so when you get a curve on a high time frame, like the 4HR or Daily timeframe, those are excellent signals
For scalpers trading 1hr below - The exofade moves faster on lower timeframes, so more caution should be used with these on lower timeframes , you this with other confluences like a good momentum oscillator oversold/overbought regions StochRSI, MACD etc
EXTRA TIPS
- Since the curve forms slower on higher time frames, it means getting a curve the on daily and weekly chart can help in your trend analysis to detect early signs of potential trend reversals
-I typically pair this with my customized version of Nadaraya watsons envelope ( a free indicator on tradingview) It will further improve your entry and winrate. Biggest advantage is for setting a profit target. In a buy trade for example, you buy the curve below price and set your profit target for the top band of the nadaraya watson envelope. Very efficient for scalping
- Unique areas were you want to pay attention to the exofade is when price enters points of interest, this depending on your trading style could be a
-FVG - fair value gaps
-Order blocks
- Supply / Demand areas
-Volume profile Value area High and Value area Low
The are two scenarios i would like you to be cautious of
1. As with every indicator and strategy, i most definitely wouldn't use this during high impact news.
2. If price is trending very strongly in one direction only, such that even barely gives any decent pull backs at all. Most especially if that strong push is happening between the 4hr to Daily time frame. Do not attempt to counter those trends unless you know what you are doing. Its not advisable.
Instead i'll recommend using the Exofade to catch an entry in the direction of the trade for a continuation.
And Lastly
Since this indicator uses VOLUME data as part of its calculations. It will not work on any pairs that tradingview does not provide volume data for, like Gold. But it will work normally on Gold Futures, since that has volume data

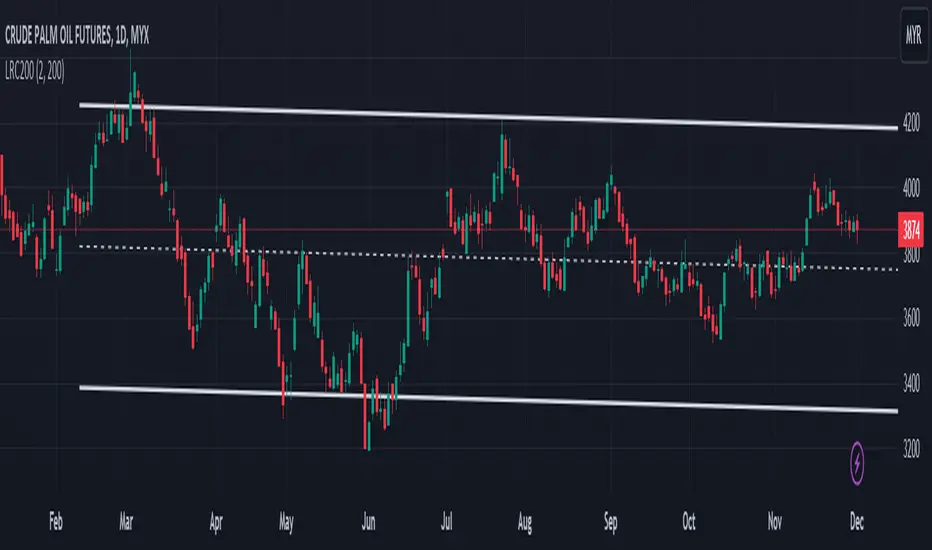
Linear Regression Channel 200█ OVERVIEW
This a simplified version of linear regression channel which use length 200 instead of traditional length 100.
█ FEATURES
Color change depends light / dark mode.
█ LIMITATIONS
Limited to source of closing price and max bars back is 1500.
█ SIMILAR
Regression Channel Alternative MTF
Regression Channel Alternative MTF V2
Adaptiv Trend Projection with Dynamic Length RegressionThe Adaptive Trend Projection indicator is a robust tool designed to provide an optimal trend projection calculated in a highly sophisticated manner. By utilizing linear regression lengths ranging from 20 to 200, this indicator estimates the duration of the trend by dynamically adjusting the projection length based on the calculated trend's strength.
Key Features:
1. Dynamic Length Adjustment: The indicator intelligently adapts the projection length between 20 and 200 using linear regression, ensuring adaptability to market conditions.
2. Trend Strength Calculation: Through linear regression analysis, the indicator calculates the slope, average, and intercept for each selected length, providing insights into the strength and direction of the trend.
3. Deviation Analysis: Beyond traditional trend analysis, the indicator calculates standard deviation, Pearson's correlation coefficient, and deviation values, offering a comprehensive view of market dynamics.
4. Confidence Levels: A unique feature of the Adaptive Trend Projection is its ability to determine confidence levels based on the highest Pearson's R value. Reliability is categorized into levels such as Neutral, Moderate, High, Very High, and Ultra High, providing users with a quick assessment of the projection's robustness.
5. Dynamic Forecasting: The indicator not only analyzes historical data but extends its functionality by dynamically forecasting future trend points. The projection adjusts in length based on the strength of the trend, allowing for more accurate predictions.
6. Visual Clarity: Enhancing visual clarity, the Adaptive Trend Projection indicator uses different line styles, widths, and colors to highlight crucial points, making it easier for traders to interpret and act upon the information.
In conclusion, the Adaptive Trend Projection indicator offers a nuanced understanding of market trends by combining advanced linear regression techniques, deviation analysis, and confidence level assessments. This enables traders to make informed decisions.

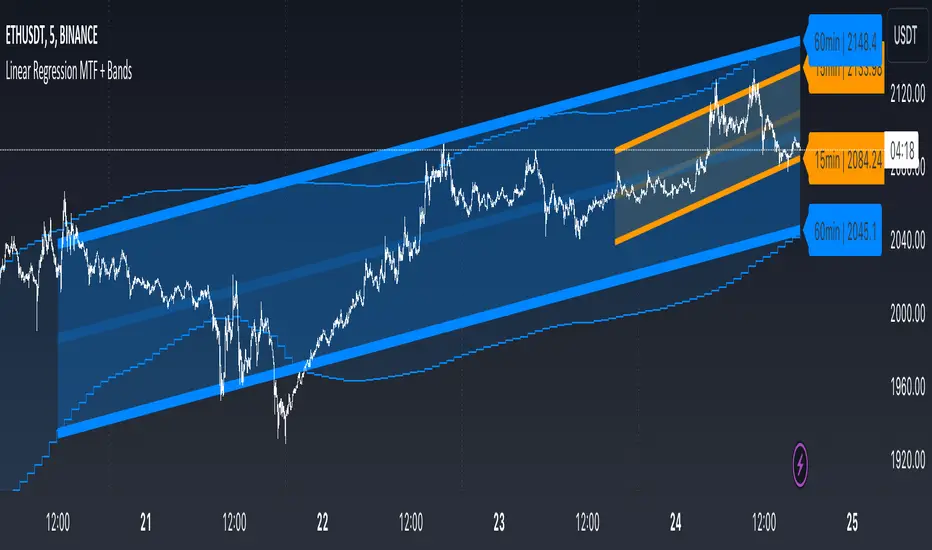
Linear Regression MTF + Bands
Multiple Time Frames (MTFs): The indicator allows you to view linear regression trends over three different time frames (TF1, TF2, TF3) simultaneously. This means a trader can observe short, medium, and long-term trends on a single chart, which is valuable for understanding overall market direction and making cross-timeframe comparisons.
Linear Regression Bands: For each time frame, the indicator calculates linear regression bands. These bands represent the expected price range based on past prices. The middle line is the linear regression line, and the upper and lower lines are set at a specified deviation from this line. Traders can use these bands to spot potential overbought or oversold conditions, or to anticipate future price movements.
History Bands: Looking at linear regression channels can be deceiving if the user does not understand the calculation. In order to see where the channel was at in history the user can display the history bands to see where price actual was in a non-repainting fashion.
Customization Options: Traders can customize various aspects of the indicator, such as whether to display each time frame, the length of the linear regression (how many past data points it considers), and the deviation for the bands. This flexibility allows traders to adapt the indicator to their specific trading style and the asset they are analyzing.
Alerts: The script includes functionality to set alerts based on the price crossing the upper or lower bands of any time frame. This feature helps traders to be notified of potential trading opportunities or risks without constantly monitoring the chart.
Examples
The 15minute linear regression is overlayed onto a 5 minute chart. We are able to see higher timeframe average and extremes. The average is the middle of the channel and the extremes are the outer edges of the bands. The bands are non-repainting meaning that is the actual value of the channel at that place in time.
Here multiple channels are shown at once. We have a linear regression for the 5, 15, and 60 minute charts. If your strategy uses those timeframes you can see the average and overbought/oversold areas without having to flip through charts.
In this example we show just the history bands. The bands could be thought of as a "don't diddle in the middle" area if your strategy is looking for reversals
You can extend the channel into the future via the various input settings.
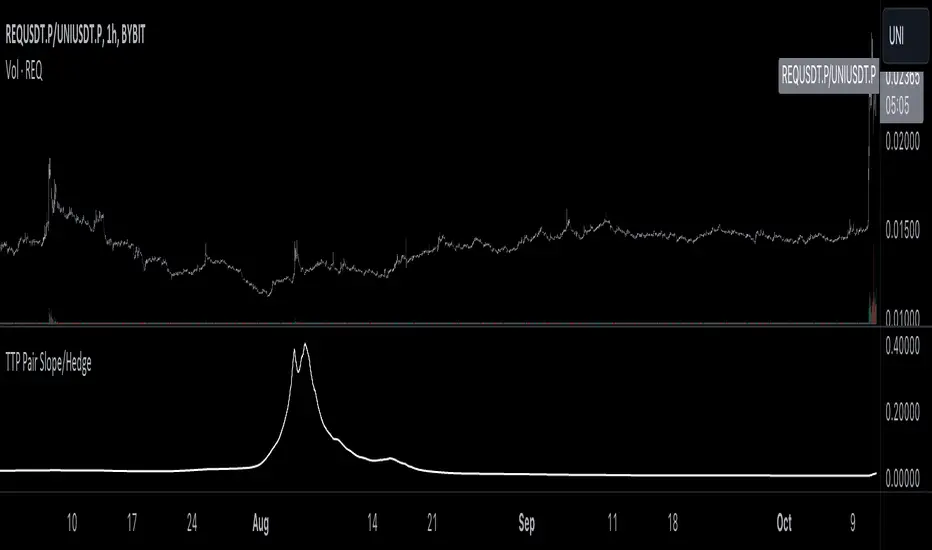
TTP Pair Slope/HedgePair slope/hedge uses linear regression to calculate the hedge ratio (slope) between the two assets within a period.
It allows you to specify a "from" and a "to" candle.
Example:
"A regression from 1000 candles back in time and ignore the last 100 candles. This would result in making a regression of 900 candles in total."
The formula used to perform the regression with the assts X and Y is:
Hedge =
mean( (X-mean(X))^2 )
——————————————————
mean( (X-mean(X)) * (Y-mean(Y)) )
You can later use the hedge in a chart of X - Hedge * Y
(Confirm with 1 / hedge )
If the plot is stationary the period tested should look like stationary.
If you cross an imaginary horizontal line across all the values in the period used it should look like a flat channel with values crossing above and below the line.
The purpose of this indicator is to help finding the linear regression test used for conintegration analysis. Conintegration assets is one of the requirements to consider assets for pair and hedge trading.
Triple Moving Averages + RSI Divergence + Trade Creator [CSJ7]This indicator uses triple moving averages to identify the prevailing trend, and calculates the linear regression of the closing price, and of the RSI, to either confirm the current trend direction, or to identify a potential trade reversal. Additionally, it includes a trade management tool that allows you to rate your trade setup according to your selected entry minimums and preferences, plus you obtain an estimated P&L with profitability metrics of your trade.
The key features are:
Dashboard : Includes entry/exit amounts, prices, quantities, estimated Profit & Loss, ROI, ROE, RRR, insights into market trends, entry conditions, and operational logs.
Trade Setup : Allows you to design your trade in detail. Select entry/exit levels, and let the tool suggest optimal target levels based on your ROI and RRR preferences. Specify your desired stop-loss type, and the tool will present the corresponding price.
Entry Conditions Management : Customize your trade entry prerequisites within the settings. The system evaluates these, offering a Trade Rating and displaying current values and entry statuses in the Entry Conditions table.
Trade Box : Visualize your trade strategy with a trade box that shows in alongside your chart, highlighting potential profit/loss zones and entry price points.
RSI & Close Price Linear Regressions : Calculates the linear regression of RSI and the close prices, since the beginning of the current trend, and presents them directly in the chart and alongside the active trend, to allow you to spot a potential trend continuation or reversal.
Adaptive price levels : The tool calculates the viability, trade rating and P&L based on contextual levels, like moving averages and highest or lowest prices, instead of using fixed prices; this allows for the results to adapt dynamically to market fluctuations, eliminating the need for manual recalibrations and adjustments.
Automatic Trade Side Detection : While manual input is available, the tool can intuitively determine the optimal trade side based on current data.
Market Outlook Events : By using the crossings of the three averages, the tool keeps track of the evolution of the current trend, providing points of interest like when the initial momentum is observed, when the trend initiates, when a potential entry zone starts, when a buy or sell opportunity arises and when the trend ends.
Alerts : You can set up two distinct alerts – one notifies on trend milestones and another for trade initiation conditions. Note: Manual activation is required in the Tradingview dashboard.
Logs : The tool provides a log section where you can find relevant information regarding the operation and any encountered errors via the dashboard's log section.
Usage
Choose your desired ticker and timeframe. If a tradable trend is detected and levels are set correctly, the trade box appears. Incorrect levels will trigger a warning in the error logs.
The tool will suggest the logical trade side, but manual adjustments are possible.
Customize ROI, maximum loss, and RRR in the settings. When in 'Auto', the tool will calculate the target price accordingly.
Adjust leverage to align with your risk and reward parameters.
View linear regressions for trend analysis and spotting RSI divergences.
Manage position sizing and risk in the settings, accounting for broker/exchange fees.
Activate alerts for trade notifications.
Enable 'Show Trade Levels' in settings to get the details of the necessary limit orders for the trade.
In the image below, you can view the expanded Trade Creator Dashboard, the Trade Box, and the Linear Regression Lines:
The linear regression lines are colored red when trending downward and green when trending upward.
The labels displaying information related to the entry and exit prices can be hidden, as demonstrated in the image above.

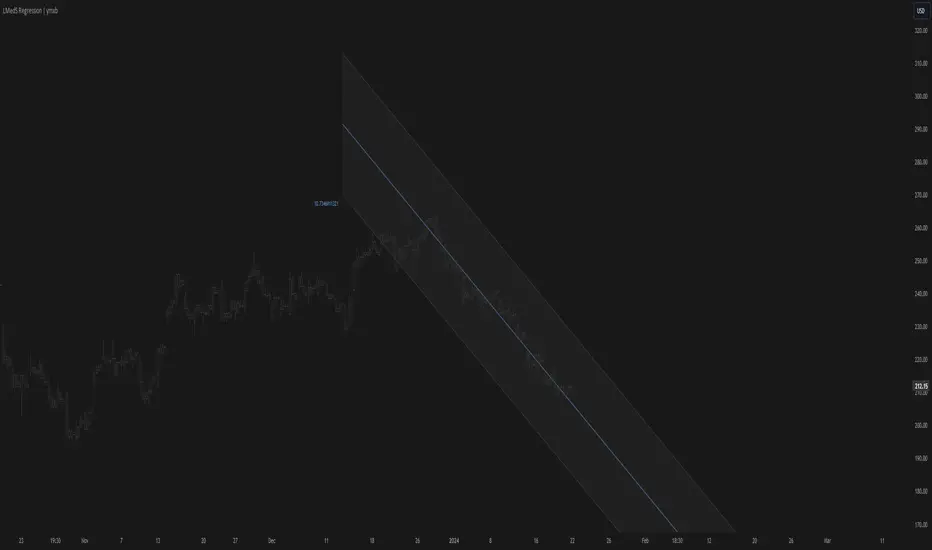
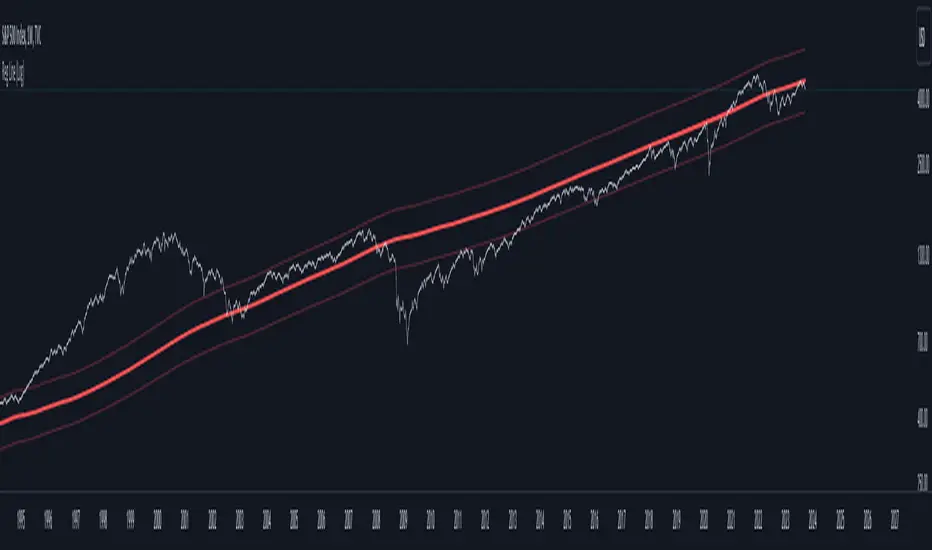
Regression Line (Log)This indicator is based on the "Linear Regression Channel (Log)," which, in turn, is derived from TradingView's "Linear Regression Channel."
The "Regression Line (Log)" indicator is a valuable tool for traders and investors seeking to gain insights into long-term market trends. This indicator is personally favored for its ability to provide a comprehensive view of price movements over extended periods. It offers a unique perspective compared to traditional linear regression lines and moving averages, making it a valuable addition to the toolkit of experienced traders and investors.
Indicator Parameters:
Before delving into the details, it's worth noting that the chosen number of periods (2870) is a personal preference. This specific value is utilized for the S&P 500 index due to its alignment with various theories regarding the beginning of the modern economic era in the stock market. Different analysts propose different starting points, such as the 1950s, 1970s, or 1980s. However, users are encouraged to adjust this parameter to suit their specific needs and trading strategies.
How It Works:
The "Regression Line (Log)" indicator operates by transforming the closing price data into a logarithmic scale. This transformation can make the linear regression more suitable for data with exponential trends or rapid growth. Here's a breakdown of its functioning and why it can be advantageous for long-term trend analysis:
1. Logarithmic Transformation : The indicator begins by applying a logarithmic transformation to the closing price. This transformation helps capture price movements proportionally, making it especially useful for assets that exhibit exponential or rapid growth. This transformation can render linear regression more suitable for data with exponential or fast-paced trends.
2. Linear Regression on Log Scale : After the logarithmic transformation, the indicator calculates a linear regression line (lrc) on this log-transformed data. This step provides a smoother representation of long-term trends compared to a linear regression line on a linear scale.
3. Exponential Reversion : To present the results in a more familiar format, the indicator reverts the log-transformed regression line back to a linear scale using the math.exp function. This final output is the "Linear Regression Curve," which can be easily interpreted on standard price charts.
Advantages:
- Long-Term Trend Clarity : The logarithmic scale better highlights long-term trends and exponential price movements, making it a valuable tool for investors seeking to identify extended trends.
- Smoothing Effect : The logarithmic transformation and linear regression on a log scale smooth out price data, reducing noise and providing a clearer view of underlying trends.
- Adaptability : The indicator allows traders and investors to customize the number of periods (length) to align with their preferred historical perspective or trading strategy.
- Complementary to Other Tools : While not meant to replace other technical indicators, the "Regression Line (Log)" indicator complements traditional linear regression lines and moving averages, offering an alternative perspective for more comprehensive analysis.
Conclusion:
In summary, the "Regression Line (Log)" indicator is a versatile tool that can enhance your ability to analyze long-term market trends. Its logarithmic transformation provides a unique perspective on price data, particularly suited for assets with exponential growth patterns. While the choice of the number of periods is a personal one, it can be adapted to fit various historical viewpoints. This indicator is best utilized as part of a well-rounded trading strategy, in conjunction with other technical tools, to aid in informed decision-making.
RSRS (Resistance Support Relative Strength)The Resistance Support Relative Strength (RSRS) indicator, published by Everbright Securities, is a technical analysis tool that enjoys immense popularity among Chinese quantitative traders, owing to its stellar performance in China's stock markets.
🟠 Principle
The indicator treats daily highs and lows as resistance and support levels respectively. It measures market strength by comparing the magnitude of price changes in daily highs versus lows. Specifically, it fits a linear regression model to the (low, high) data points over the past N days (typically 18) and uses the slope (beta) as the RSRS value. A steeper slope indicates stronger market strength.
🟠 Algorithm
1. Collect the daily low and high prices over the past N days.
2. Apply Ordinary Least Squares to estimate the linear regression model: high = alpha + beta * low. The beta is the RSRS value.
3. Compute the z-score of the RSRS over the past M days (typically 600).
4. Compare the z-score to preset buy and sell thresholds (typically 0.7 and -0.7) to generate trading signals. If z-score > buy threshold, a buy signal is triggered. If z-score < sell threshold, a sell signal is triggered.

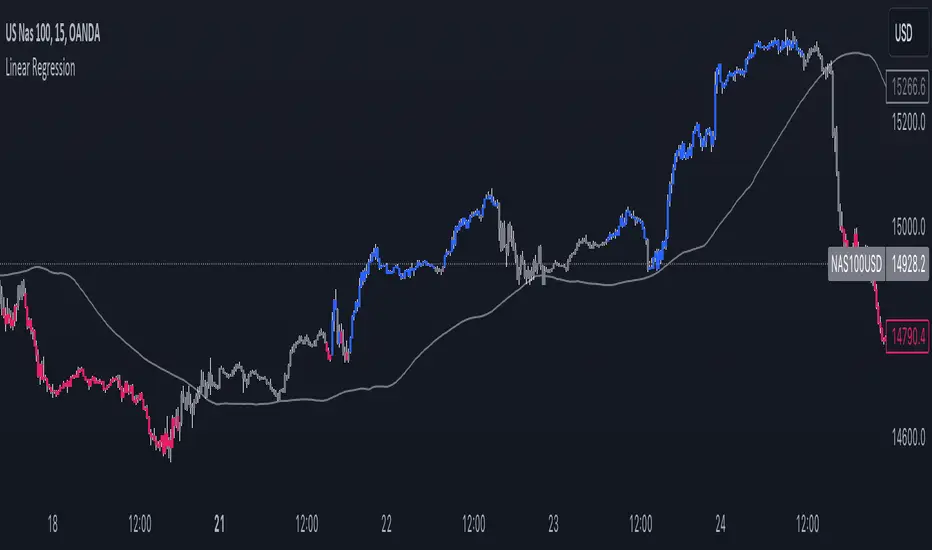
Linear RegressionThis indicator can be used to determine the direction of the current trend.
The indicator plots two different histograms based on the linear regression formula:
- The colored ones represent the direction of the short-term trend
- The gray one represents the direction of the long-term trend
In the settings, you can change the length of the short-term value, which also influences the long-term as a basis that will be multiplied

Linear Regression IndicatorThis tool can be used to determine the direction of the current trend.
The indicator changes the color of the candles based on the direction of the linear regression formula. This is made settings the length of the short-term linear regression in the settings, the longer one is also based on that parameter but significantly larger.
The indicator also plots the average between the two linear regression lines used in the candle coloring formula, and can be used both for support and resistance or as a trend line used to analyze breakouts.
Stablecoin Market Cap RiskThe Stablecoins Market Cap Risk indicator serves as a valuable risk oscillator for Bitcoin on a macro scale . This metric is derived by aggregating the market capitalization of CRYPTOCAP:USDT (Tether) and CRYPTOCAP:USDC (USD Coin), subsequently dividing this combined value by CRYPTOCAP:TOTAL (total market capitalization). The resulting figure is further normalized through linear regression.
The regression in question:
drive.google.com
However, it is essential to acknowledge that this model's reliability may diminish over time, as it is based solely on data from the most recent 4.5 years of cryptocurrency market trends. Consequently, adaptations and enhancements to the model are anticipated in the future to ensure its continued relevance and accuracy.

Smart Trend EnvelopeThe "Smart Trend Envelope" indicator is a powerful tool that combines the "Nadaraya-Watson Envelope " indicator by LuxAlgo and the "Strongest Trendline" indicator by Julien_Eche.
This indicator provides valuable insights into price trends and projection confidence levels in financial markets. However, it's important to note that the indicator may repaint, meaning that the displayed results can change after the fact.
The "Strongest Trendline" indicator by Julien_Eche focuses on identifying the strongest trendlines using logarithmic transformations of price data. It calculates the slope, average, and intercept of each trendline over user-defined lengths. The indicator also provides standard deviation, Pearson's R correlation coefficient, and upper/lower deviation values to assess the strength and reliability of the trendlines.
In addition, the "Nadaraya-Watson Envelope " indicator developed by LuxAlgo utilizes the Nadaraya-Watson kernel regression technique. It applies a kernel function to smooth the price data and estimate future price movements. The indicator allows adjustment of the bandwidth parameter and multiplier to control the width of the envelope lines around the smoothed line.
Combining these two indicators, the "Smart Trend Envelope" indicator offers traders and investors a comprehensive analysis of price trends and projection confidence levels. It automatically selects the strongest trendline length based on the highest Pearson's R correlation coefficient. Traders can observe the trendlines on the price chart, along with upper and lower envelope lines generated by the Nadaraya-Watson smoothing technique.
The "Smart Trend Envelope" indicator has several qualities that make it a valuable tool for technical analysis:
1. Automatic Length Selection: The indicator dynamically selects the optimal trendline length based on the highest Pearson's R correlation coefficient, ensuring accurate trend analysis.
2. Projection Confidence Level: The indicator provides a projection confidence level ranging from "Ultra Weak" to "Ultra Strong." This allows traders to assess the reliability of the projected trend and make informed trading decisions.
3. Color-Coded Visualization: The indicator uses color schemes, such as teal and red, to highlight the direction of the trend and the corresponding envelope lines. This visual representation makes it easier to interpret the market trends at a glance.
4. Customizable Settings: Traders can adjust parameters such as bandwidth, multiplier, line color, and line width to tailor the indicator to their specific trading strategies and preferences.
The "Smart Trend Envelope" indicator has been specifically designed and coded to be used in logarithmic scale. It takes advantage of the logarithmic scale's ability to represent exponential price movements accurately. Therefore, it is highly recommended to use this indicator with the chart set to logarithmic scale for optimal performance and reliable trend analysis, especially on higher timeframes.
It's important to remember that the "Smart Trend Envelope" indicator may repaint, meaning that the displayed results can change after the fact. Traders should use this indicator as a tool for generating trade ideas and confirmation, rather than relying solely on its historical values. Combining the indicator with other technical analysis tools and considering fundamental factors can lead to more robust trading strategies.

Trend Finder++ (by Alex L.)This indicator seeks for a short term trend within a bigger long term trend and displays both in a channel with an extension lines (optional).
Use of this indicator is quite simple: when the stock is near the trend line bottom (default RED) it can be a good time to buy and when the stock is near the trend line top (default GREEN) it can be a good time to sell.
What new ideas and cool stuff this indicator offers:
- 'Trend (Months)' -
Trend channels will always be displayed over the period: last 'X' months (regardless of the 'Time Interval' set in your chart)
This allows you to go into a larger or smaller resolution and still see the same trend lines!
- ' Trend (Bars)' -
Optional. You can choose to display the Trend channel based on bars instead of months.
This can be useful for advanced traders, or in case a security is new and there isn't even 1 month of data.
- 'Show long-term trend' -
Optional. Displays a larger 3rd (even more long-term) trend in addition to the two current trends.
This is for advanced traders who want to see an even more bigger picture. It is best viewed on a weekly time interval.
- Customizable channel size, channel colors and channel style.
- 'Extend lines' -
Optional (default: yes). Trend channels' can be displayed with extension or without using this option.
- Internal Feature -
When trend channel goes below zero (can happen if stock's price falls sharply) - its below-zero portion will be drawn as 'extension' instead.
This is useful if such occurs, and we're in an auto-scaled chart - the lines will take less space on screen (for cleaner view).
Based on an idea/indicator by @ DevLucem called "Linear Regression ++"
Open Source.
Enjoy!

Pearson's R Convergence DivergenceThis script calculates the convergence divergence and breakouts from the deviations for a fast and slow linear regression slope.
This can be used to predict major market moves before they happen.
For users familiar with MacD, the blue line is similar to the MacD line and the orange line the signal.
The difference is this is not a moving average comparison but a comparison between Pearson's R values.
-0.1 (positive direction)
0.1 (negative direction)
This is why the colors look inverse for a typical MacD.
How to use this:
The idea is that when both trends converge in the 0.8 or -0.8 range and you see a breakout cross occur on either line then the price has a high likelihood of reversing its current trend.
If you see a green cross it means the top of the linear regression for the 'fast' or 'slow' linear regression deviation was broken by the current price. This can signify that upward movement is coming soon.
On the flip side a red cross means the bottom of the linear regression for the 'fast' or 'slow' linear regression deviation was broken by the current price. This can signify that downward movement is coming soon.
These crosses mean a lot more if the pearson's R value is already maxed out near 0.8 or -0.8.
This indicator works because the more sure a trend becomes the more likely it is to break as more traders see the pattern.
The histogram colors do not mean much being 'red' or 'green', what you want to look for is when the histogram starts to approach the 0 mark. This signifies that both linear regression trends are about to reach their peak before reversing trend. So don't confuse this with how you might read the MacD even though it looks very similar. The histogram sloping towards the 0 line will give you a clue how long it might take before the reversal occurs .
Please PM me if you have any questions, and enjoy!

Ultimate Trend ChannelThe "Ultimate Trend Channel" indicator is a comprehensive trend analysis tool that calculates and displays a series of upper and lower bands based on user-defined input lengths. It uses linear regression and standard deviation to determine these bands for each of the 21 different group lengths. The indicator then computes the averages of these upper and lower bands, as well as the average of all the bands combined.
The visualization on the chart includes the plotting of the average upper and lower bands, with the space between these bands shaded for easy visualization of the overall trend. Additionally, the average of all the bands, referred to as the "Ultimate Trend Line," is also plotted on the chart.
This indicator provides a robust way of assessing market trends and volatility over varying periods, which can be extremely useful for both short-term and long-term trading strategies.

Nonlinear Regression, Zero-lag Moving Average [Loxx]Nonlinear Regression and Zero-lag Moving Average
Technical indicators are widely used in financial markets to analyze price data and make informed trading decisions. This indicator presents an implementation of two popular indicators: Nonlinear Regression and Zero-lag Moving Average (ZLMA). Let's explore the functioning of these indicators and discuss their significance in technical analysis.
Nonlinear Regression
The Nonlinear Regression indicator aims to fit a nonlinear curve to a given set of data points. It calculates the best-fit curve by minimizing the sum of squared errors between the actual data points and the predicted values on the curve. The curve is determined by solving a system of equations derived from the data points.
We define a function "nonLinearRegression" that takes two parameters: "src" (the input data series) and "per" (the period over which the regression is calculated). It calculates the coefficients of the nonlinear curve using the least squares method and returns the predicted value for the current period. The nonlinear regression curve provides insights into the overall trend and potential reversals in the price data.
Zero-lag Moving Average (ZLMA)
Moving averages are widely used to smoothen price data and identify trend directions. However, traditional moving averages introduce a lag due to the inclusion of past data. The Zero-lag Moving Average (ZLMA) overcomes this lag by dynamically adjusting the weights of past values, resulting in a more responsive moving average.
We create a function named "zlma" that calculates the ZLMA. It takes two parameters: "src" (the input data series) and "per" (the period over which the ZLMA is calculated). The ZLMA is computed by first calculating a weighted moving average (LWMA) using a linearly decreasing weight scheme. The LWMA is then used to calculate the ZLMA by applying the same weight scheme again. The ZLMA provides a smoother representation of the price data while reducing lag.
Combining Nonlinear Regression and ZLMA
The ZLMA is applied to the input data series using the function "zlma(src, zlmaper)". The ZLMA values are then passed as input to the "nonLinearRegression" function, along with the specified period for nonlinear regression. The output of the nonlinear regression is stored in the variable "out".
To enhance the visual representation of the indicator, colors are assigned based on the relationship between the nonlinear regression value and a signal value (sig) calculated from the previous period's nonlinear regression value. If the current "out" value is greater than the previous "sig" value, the color is set to green; otherwise, it is set to red.
The indicator also includes optional features such as coloring the bars based on the indicator's values and displaying signals for potential long and short positions. The signals are generated based on the crossover and crossunder of the "out" and "sig" values.
Wrapping Up
This indicator combines two important concepts: Nonlinear Regression and Zero-lag Moving Average indicators, which are valuable tools for technical analysis in financial markets. These indicators help traders identify trends, potential reversals, and generate trading signals. By combining the nonlinear regression curve with the zero-lag moving average, this indicator provides a comprehensive view of the price dynamics. Traders can customize the indicator's settings and use it in conjunction with other analysis techniques to make well-informed trading decisions.

Linear Regression Channel (Log)The Linear Regression Channel (Log) indicator is a modified version of the Linear Regression channel available on TradingView. It is designed to be used on a logarithmic scale, providing a different perspective on price movements.
The indicator utilizes the concept of linear regression to visualize the overall price trend in a specific section of the chart. The central line represents the linear regression calculation, while the upper and lower lines indicate a certain number of standard deviations away from the central line. These bands serve as support and resistance levels, and when prices remain outside the channel for an extended period, a potential reversal may be anticipated.
I have replaced the Pearson values with trend strength levels to enhance understanding for individuals unfamiliar with Pearson correlation.

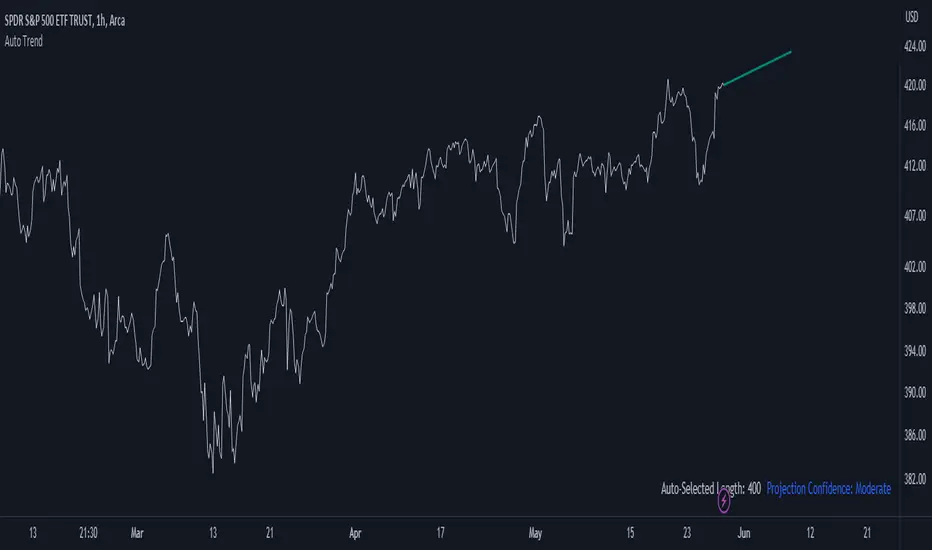
Auto Trend ProjectionAuto Trend Projection is an indicator designed to automatically project the short-term trend based on historical price data. It utilizes a dynamic calculation method to determine the slope of the linear regression line, which represents the trend direction. The indicator takes into account multiple length inputs and calculates the deviation and Pearson's R values for each length.
Using the highest Pearson's R value, Auto Trend Projection identifies the optimal length for the trend projection. This ensures that the projected trend aligns closely with the historical price data.
The indicator visually displays the projected trend using trendlines. These trendlines extend into the future, providing a visual representation of the potential price movement in the short term. The color and style of the trendlines can be customized according to user preferences.
Auto Trend Projection simplifies the process of trend analysis by automating the projection of short-term trends. Traders and investors can use this indicator to gain insights into potential price movements and make informed trading decisions.
Please note that Auto Trend Projection is not a standalone trading strategy but a tool to assist in trend analysis. It is recommended to combine it with other technical analysis tools and indicators for comprehensive market analysis.
Overall, Auto Trend Projection offers a convenient and automated approach to projecting short-term trends, empowering traders with valuable insights into the potential price direction.
Strongest TrendlineUnleashing the Power of Trendlines with the "Strongest Trendline" Indicator.
Trendlines are an invaluable tool in technical analysis, providing traders with insights into price movements and market trends. The "Strongest Trendline" indicator offers a powerful approach to identifying robust trendlines based on various parameters and technical analysis metrics.
When using the "Strongest Trendline" indicator, it is recommended to utilize a logarithmic scale . This scale accurately represents percentage changes in price, allowing for a more comprehensive visualization of trends. Logarithmic scales highlight the proportional relationship between prices, ensuring that both large and small price movements are given due consideration.
One of the notable advantages of logarithmic scales is their ability to balance price movements on a chart. This prevents larger price changes from dominating the visual representation, providing a more balanced perspective on the overall trend. Logarithmic scales are particularly useful when analyzing assets with significant price fluctuations.
In some cases, traders may need to scroll back on the chart to view the trendlines generated by the "Strongest Trendline" indicator. By scrolling back, traders ensure they have a sufficient historical context to accurately assess the strength and reliability of the trendline. This comprehensive analysis allows for the identification of trendline patterns and correlations between historical price movements and current market conditions.
The "Strongest Trendline" indicator calculates trendlines based on historical data, requiring an adequate number of data points to identify the strongest trend. By scrolling back and considering historical patterns, traders can make more informed trading decisions and identify potential entry or exit points.
When using the "Strongest Trendline" indicator, a higher Pearson's R value signifies a stronger trendline. The closer the Pearson's R value is to 1, the more reliable and robust the trendline is considered to be.
In conclusion, the "Strongest Trendline" indicator offers traders a robust method for identifying trendlines with significant predictive power. By utilizing a logarithmic scale and considering historical data, traders can unleash the full potential of this indicator and gain valuable insights into price trends. Trendlines, when used in conjunction with other technical analysis tools, can help traders make more informed decisions in the dynamic world of financial markets.
