SMC Alpha Engine [PhenLabs]📊 SMC Alpha Engine
Version: PineScript™ v6
📌 Description
The SMC Alpha Engine is a comprehensive Smart Money Concepts indicator that automates institutional trading pattern recognition. Built for traders who understand that confluence is king, this indicator stacks multiple SMC elements together and scores them in real-time, allowing you to focus exclusively on high-probability setups.
Rather than manually tracking HTF bias, market structure, liquidity levels, order blocks, and fair value gaps separately, the SMC Alpha Engine consolidates everything into a unified scoring system. When enough factors align, you get a signal. When they don’t, you wait. This systematic approach removes emotion and subjectivity from SMC trading.
The indicator is designed around one core principle: only trade when the probabilities are stacked in your favor. By requiring multiple confluence factors before generating signals, it filters out the noise and keeps you focused on setups that institutional traders actually care about.
🚀 Points of Innovation
Automated confluence scoring system that evaluates 6 distinct SMC factors in real-time
HTF-to-LTF bias alignment ensuring trades flow with institutional direction
Intelligent liquidity sweep detection using wick-ratio analysis for confirmation
ATR-based FVG quality filtering that eliminates noise and shows only significant imbalances
Anti-spam signal logic preventing overtrading during volatile market conditions
Session-aware killzone integration timing entries with institutional activity windows
🔧 Core Components
HTF Bias Engine: Analyzes higher timeframe swing structure to establish directional bias using pivot high/low comparisons
Market Structure Module: Detects BOS (Break of Structure) and CHoCH (Change of Character) with real-time confirmation
Premium/Discount Calculator: Dynamically maps price zones relative to recent swing range equilibrium
Liquidity Tracker: Monitors swing points as liquidity targets and identifies sweep events with rejection confirmation
POI Detector: Identifies valid Order Blocks with displacement requirements and Fair Value Gaps with ATR filtering
Confluence Scorer: Aggregates all factors into bull/bear scores displayed on real-time dashboard
🔥 Key Features
Multi-timeframe analysis combining HTF directional bias with LTF precision entries
Customizable confluence threshold from 1 (low filter) to 5 (sniper mode)
Three killzone sessions: London (02:00-05:00), NY AM (08:30-11:00), NY PM (13:30-16:00)
Flexible mitigation options for OBs and FVGs: Wick, Close, 50%, or None
Visual structure labeling for BOS and CHoCH events on chart
Real-time info dashboard showing all current market conditions and scores
Built-in alert conditions for BOS, liquidity sweeps, and high-confluence signals
🎨 Visualization
Premium Zone: Red-tinted box above equilibrium indicating sell-side interest areas
Discount Zone: Green-tinted box below equilibrium indicating buy-side interest areas
Equilibrium Line: Dotted gray line marking the 50% level of current range
Order Blocks: Color-coded boxes (green for bullish, red for bearish) showing institutional candles
Fair Value Gaps: Teal boxes for bullish FVGs, maroon boxes for bearish FVGs
Killzone Backgrounds: Blue (London), Orange (NY AM), Purple (NY PM) session highlighting
Info Table: Top-right dashboard displaying HTF bias, LTF trend, zone, killzone status, and scores
📖 Usage Guidelines
HTF Settings
HTF Timeframe - Default: 60 - Controls higher timeframe for directional bias
HTF Swing Length - Default: 10, Range: 3+ - Determines pivot sensitivity for HTF trend
Market Structure Settings
LTF Swing Length - Default: 3, Range: 1-10 - Controls swing detection sensitivity
Show BOS/CHoCH - Default: Off - Toggles structure labels on chart
Show Strong/Weak Points - Default: Off - Displays swing point classifications
POI Settings
Show Valid Order Blocks - Default: Off - Displays OBs that caused displacement
Show Unmitigated FVGs - Default: On - Shows active fair value gaps
Filter FVG by ATR - Default: On - Only shows FVGs larger than 0.5x ATR
OB Mitigation Type - Options: Wick, Close, None - Determines when OBs are invalidated
FVG Mitigation Type - Options: Wick, Close, 50%, None - Determines when FVGs are filled
Confluence Settings
Minimum Score for Signal - Default: 4, Range: 1-5 - Required confluence level for entries
Show Entry Signals - Default: On - Toggles LONG/SHORT labels on chart
✅ Best Use Cases
Trend continuation trades during active killzone sessions with HTF alignment
Discount zone entries on bullish HTF bias with recent liquidity sweep below
Premium zone shorts on bearish HTF bias after liquidity grab above recent highs
Reversal identification following CHoCH with POI confluence in optimal zone
Filtering existing strategy signals by requiring minimum confluence score
⚠️ Limitations
HTF bias detection requires sufficient price history for accurate pivot identification
Liquidity sweep detection depends on wick-ratio settings and may miss some events
Order blocks require displacement confirmation which may exclude some valid zones
Confluence scoring is probabilistic and does not guarantee profitable outcomes
Killzone times are based on EST/EDT and require timezone adjustment for other regions
Signal spam prevention may delay valid signals by up to 10 bars after previous signal
💡 What Makes This Unique
Unified SMC Framework: Combines all major SMC concepts into one cohesive indicator rather than requiring multiple tools
Objective Scoring System: Removes subjectivity by quantifying confluence into measurable scores
Institutional Timing Integration: Built-in killzone awareness ensures signals align with high-volume sessions
Quality Filtering: ATR-based FVG filtering and displacement-required OBs eliminate low-quality setups
Anti-Overtrading Logic: Smart signal spacing prevents emotional trading during choppy conditions
🔬 How It Works
Step 1: HTF Bias Determination
Analyzes higher timeframe pivot highs and lows
Compares consecutive pivots to identify HH/HL (bullish) or LH/LL (bearish) sequences
Establishes directional filter that all signals must respect
Step 2: LTF Structure Mapping
Detects swing points on execution timeframe
Identifies BOS when price closes beyond confirmed swing level
Recognizes CHoCH when structure break occurs against current trend
Step 3: Confluence Calculation
Awards +1 for HTF bias alignment
Awards +1 for active killzone timing
Awards +1 for optimal zone positioning (discount for longs, premium for shorts)
Awards +1 for price at unmitigated POI
Awards +1 for recent liquidity sweep in trade direction
Awards +1 for recent supportive structure break
Step 4: Signal Generation
Compares total score against user-defined minimum threshold
Requires candle confirmation (bullish close for longs, bearish close for shorts)
Applies 10-bar spacing filter to prevent signal clustering
💡 Note:
This indicator is designed for traders already familiar with Smart Money Concepts. While it automates detection and scoring, understanding why each factor matters will significantly improve your ability to filter signals and manage trades effectively. Use the minimum confluence setting to match your risk tolerance, higher values mean fewer but higher-quality signals.
Institutionalorderflow

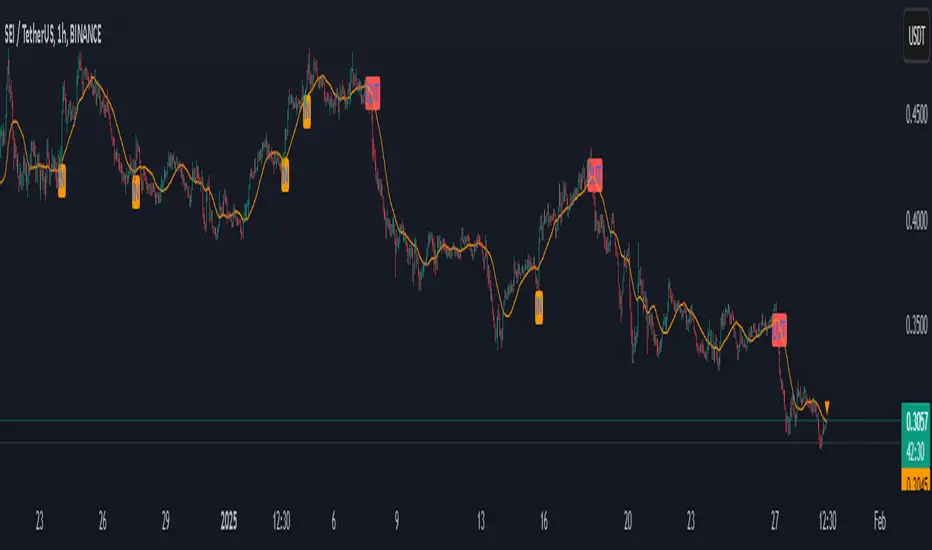
Institutional Moves DetectorIndicator Name: Institutional Pattern Detector
What It Does:
Trend Following: It uses a Moving Average (MA) to understand the general direction of the price. The MA is like a smoothed-out line of the price over time, showing if the price trend is going up or down.
Volatility Measurement: The script employs Bollinger Bands (BB) to see how much the price is fluctuating. Bollinger Bands create an upper and lower "channel" around the price, which gets wider or narrower based on how volatile the price is.
Volume Check: It looks at trading volume to find times when there's unusually high activity, which could mean big players (institutions like banks or funds) are trading. It flags this when the volume is 1.5 times more than the average volume of the last 100 bars.
Pattern Detection for Trading Signals:
Entry Signal ("IN"): When there's high volume and the price is above the upper Bollinger Band, it suggests there might be strong buying from big institutions. This could mean the price might keep going up.
EXIT Signal ("OUT"): If there's high volume and the price falls below the lower Bollinger Band, it indicates possible strong selling pressure from institutions, suggesting the price might go down.
Visual Cues:
An orange label "IN" appears below the price bar for entry signals.
A red label "OUT" appears above the price bar for exit signals.
The moving average line is plotted on the chart in orange to help you see the trend.
Alerts: The script can alert you when these entry or exit signals occur, so you can get notifications without needing to stare at the chart all day.
For New Traders:
This indicator helps you spot when big traders might be influencing the market, potentially giving you a clue about when to enter or exit.
Remember, this is one tool among many. You should not base your trading solely on this; combine it with other analysis methods.
It's always wise to practice with a demo account before using real money to get a feel for how these signals work in actual market conditions.
ICT Institutional Order Flow (fadi)ICT Institutional Order Flow indicator is intended to provide wholistic view to better analyze order flow and where price may go to next. The concept follows ICT principles.
ICT Market Structure
ICT breaks down Pivot points into three categories:
Short Term High/Low (STH/STL) is a 3 candle pattern with a low with higher low on each side (STL), or a high with lower high on each side (STH)
Intermediate Term High/Low (ITH/ITL) uses the calculated STH/STL and marks any STH that has lower or STH on each side, and STL that has higher STL on each side
Long Term High/Low (LTH/LTL) uses the calculated ITH/ITL and marks any ITH that has lower or ITH on each side, and ITL that has higher ITL on each side
Note: ICT also states that if a STH wicks into and closes (almost?) a FVG, he marks it as ITH even if it does not have STH on reach side. This scenario is not covered by this indicator
Liquidity
liquidity is usually present under pivot points. The more prominent the pivot point, the more likely higher values liquidity pools reside under/above it. Liquidity under ITL and LTL as an example, will have better indication of which liquidity the price may seek next.
Displacement
Displacement registers above average move in the price resulting in strong visible move. If requiring a FVG is enabled (in settings), then the displacement could possibly (but never guaranteed) be used to visually recognize a move as it develops.
Full Credit: The calculation for Displacement is derived from TFO's Visualizing Displacement
Imbalances
Imbalances can come in different forms. This indicator identifies three type of imbalances:
1. FVG
2. Volume Imbalance
3. Open Gaps
Imbalances completes the picture by help visualize strong moves, where possible pivot points may develop, and how to enter or manage a trade.
